Article Text

Abstract
Background Chest radiograph (CXR) is a basic diagnostic test in community-acquired pneumonia (CAP) with prognostic value. We developed a CXR-based artificial intelligence (AI) model (CAP AI predictive Engine: CAPE) and prospectively evaluated its discrimination for 30-day mortality.
Methods Deep-learning model using convolutional neural network (CNN) was trained with a retrospective cohort of 2235 CXRs from 1966 unique adult patients admitted for CAP from 1 January 2019 to 31 December 2019. A single-centre prospective cohort between 11 May 2020 and 15 June 2020 was analysed for model performance. CAPE mortality risk score based on CNN analysis of the first CXR performed for CAP was used to determine the area under the receiver operating characteristic curve (AUC) for 30-day mortality.
Results 315 inpatient episodes for CAP occurred, with 30-day mortality of 19.4% (n=61/315). Non-survivors were older than survivors (mean (SD)age, 80.4 (10.3) vs 69.2 (18.7)); more likely to have dementia (n=27/61 vs n=58/254) and malignancies (n=16/61 vs n=18/254); demonstrate higher serum C reactive protein (mean (SD), 109 mg/L (98.6) vs 59.3 mg/L (69.7)) and serum procalcitonin (mean (SD), 11.3 (27.8) μg/L vs 1.4 (5.9) μg/L). The AUC for CAPE mortality risk score for 30-day mortality was 0.79 (95% CI 0.73 to 0.85, p<0.001); Pneumonia Severity Index (PSI) 0.80 (95% CI 0.74 to 0.86, p<0.001); Confusion of new onset, blood Urea nitrogen, Respiratory rate, Blood pressure, 65 (CURB-65) score 0.76 (95% CI 0.70 to 0.81, p<0.001), respectively. CAPE combined with CURB-65 model has an AUC of 0.83 (95% CI 0.77 to 0.88, p<0.001). The best performing model was CAPE incorporated with PSI, with an AUC of 0.84 (95% CI 0.79 to 0.89, p<0.001).
Conclusion CXR-based CAPE mortality risk score was comparable to traditional pneumonia severity scores and improved its discrimination when combined.
- Imaging/CT MRI etc
- Pneumonia
- Respiratory Infection
Data availability statement
Data are available on reasonable request. Deidentified data are available from the corresponding author on reasonable request subjected to institutional approval.
This is an open access article distributed in accordance with the Creative Commons Attribution Non Commercial (CC BY-NC 4.0) license, which permits others to distribute, remix, adapt, build upon this work non-commercially, and license their derivative works on different terms, provided the original work is properly cited, appropriate credit is given, any changes made indicated, and the use is non-commercial. See: http://creativecommons.org/licenses/by-nc/4.0/.
Statistics from Altmetric.com
Key messages
Can artificial intelligence prognosticate pneumonia mortality based on chest radiographs?
An artificial intelligence tool was developed based on 2235 chest radiographs from a retrospective cohort of patients with community-acquired pneumonia. Subsequently, its discriminative power for 30-day mortality was determined based on a prospective cohort of 315 inpatient visits and found to be comparable to Pneumonia Severity Index and Confusion of new onset, blood Urea nitrogen, Respiratory rate, Blood pressure-65.
This is a novel tool using a single data source (chest radiograph) to prognosticate pneumonia mortality. Incorporating this into traditional Pneumonia Severity Scores improved the model discrimination for 30-day mortality.
Introduction
Community-acquired pneumonia (CAP) is the fourth-leading cause of death globally, with estimates at 2.96 million each year.1 CAP may result in long-term functional impairment, serious morbidity and mortality, particularly for those who require hospitalisation.2 3 To aid clinicians, Pneumonia Severity Scores were developed for mortality risk stratification, triaging of appropriate sites-of-care and disease management strategies.4–6
Numerous studies have been performed to identify risk factors for adverse outcomes in CAP patients. These serve to build clinical prediction models for stratifying pneumonia severity.5 6 Two of the most widely used tools are the Pneumonia Severity Index (PSI)6 and Confusion of new onset, blood Urea nitrogen, Respiratory rate, Blood pressure, 65 (CURB-65) score.5 PSI consists of 20 variables to derive a weighted score, which is further stratified into five classes of mortality risk.7 CURB-65 score is calculated using five variables of equal weighting: confusion of new onset; serum urea >7 mmol/L; respiratory rate ≥30 per min; low blood pressure (systolic blood pressure <90 mm Hg or diastolic blood pressure ≤60 mm Hg); age ≥65 years5.7 8
These prognostic scores demonstrate good discrimination for mortality. In a meta-analysis, Chalmers et al reported an area under the receiver operating characteristic curve (AUC) of 0.81 and 0.80 for the PSI and CURB-65 scores, respectively.9 However, the practical use of severity scores has significant challenges. Calculation requires multiple data point acquisition processes (medical history, physical examination, blood sampling, chest imaging), is time-consuming, prone to poor clinician compliance.10 A recent study in Singapore showed that PSI performed better for mortality prediction than CURB-65, however, its discriminative power decreased with advancing age.11
Artificial intelligence (AI) when applied on electronic medical data to support clinical decision-making processes, demonstrate the potential to mitigate some of these challenges.12 13 AI research in thoracic imaging has focused largely on diagnostic discrimination. Several studies have described convolutional neural network (CNN) models which demonstrate high accuracy rates in predicting chest imaging diagnoses.14–17 There has also been rapid progress in the use of AI for diagnosis of SARS-CoV-2 pneumonia based on chest computer tomography and radiographs.18–20
In addition to discriminating binary diagnoses, AI demonstrates the potential to prognosticate outcomes using chest imaging. Lu et al described the use of a single chest radiograph (CXR) in a cancer screening cohort to predict all-cause mortality at 12 years.21 Similarly, Liu et al described the use of AI algorithms to analyse CT changes in SARS-CoV-2 pneumonia to predict disease progression with an AUC of 0.93.22
The authors hypothesise that radiological abnormalities present on a single CXR taken at the start of an episode of CAP can aid in prognostication of mortality. Using a retrospective dataset, we developed a CNN named CAPE (CAP AI Predictive Engine). The primary aim of this study is to determine the AUC of the CAPE mortality risk score for 30-day mortality. The secondary aim is to compare the performance of this tool to well-validated pneumonia severity scores—CURB-65 and PSI. The tertiary aim is to investigate the potential additional value of combining CNN with pneumonia severity scores.
Methods
CNN model development
Model development was based on a single acute tertiary hospital’s data. Study consent waiver was obtained. Patients and public were not involved in the design, or conduct, or reporting, or dissemination plans of our research.
In the model development of CAPE CNN, a retrospective data set of consisting 2235 CXR from 1966 adult were used. They were identified from electronic medical records by emergency department attendance (with subsequent inpatient admission diagnosis of pneumonia by International Classification of Disease-10 coding) occurring between 1 January 2019 and 30 December 2019. All CXR were deidentified and preprocessed by centre-cropping, resizing to dimensions of 244×244 pixels, followed by histogram equalisation. Inpatient mortality data were used for model development instead of 30-day mortality as this retrospective data were not available from the national death registry.
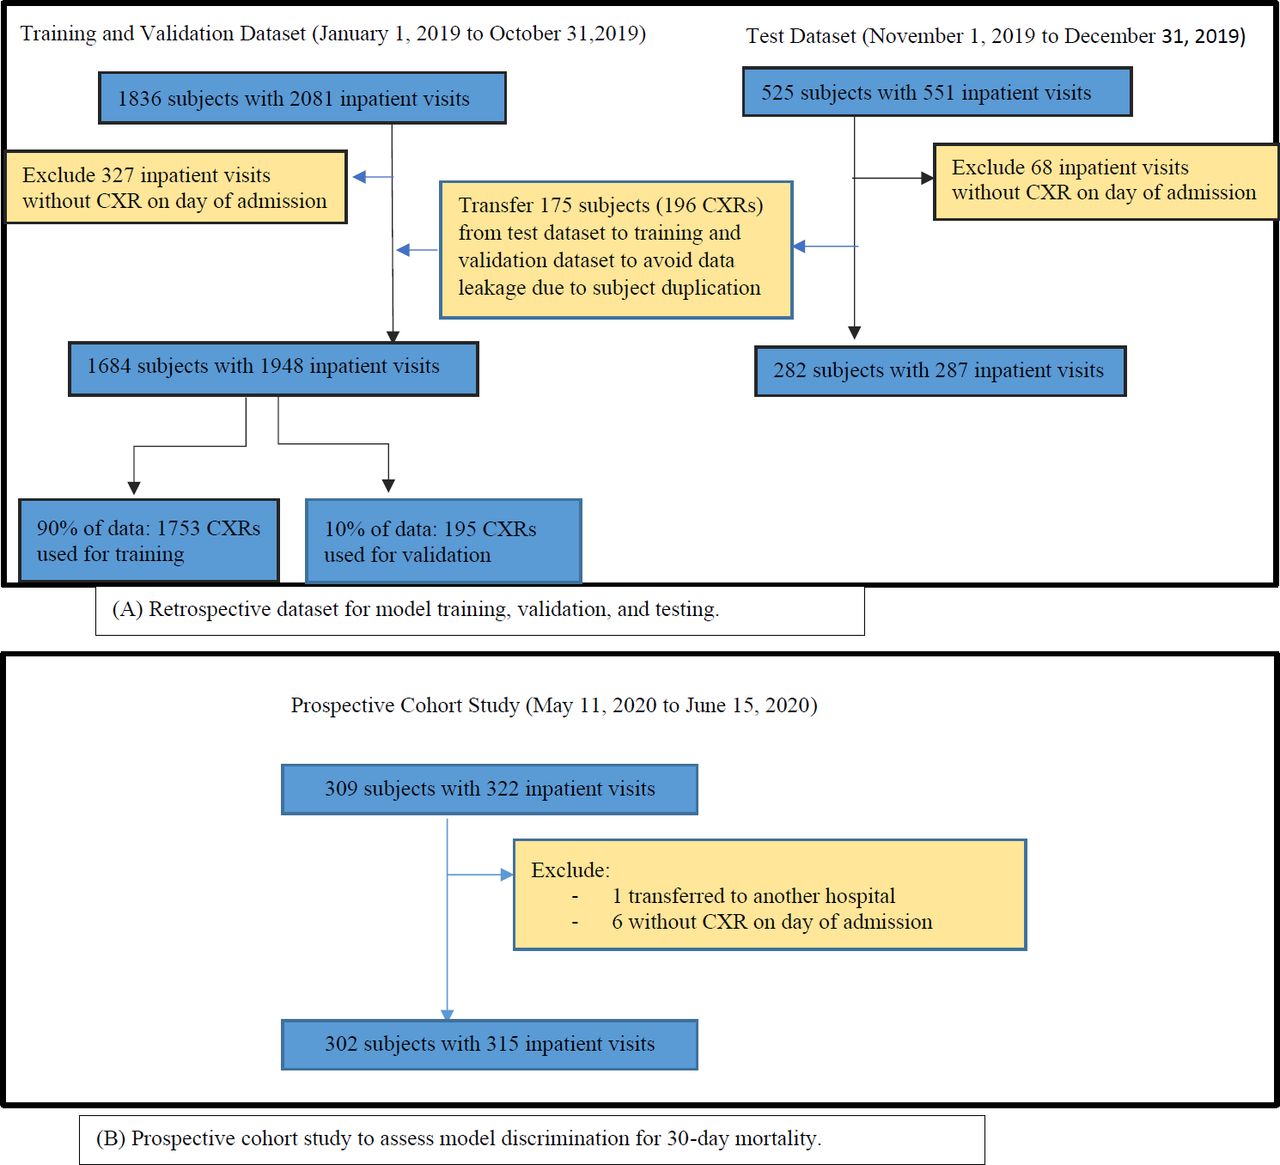
The retrospective cohort was grouped into three sets: ‘training’ set for model building; ‘validation’ set for selection of the optimal model; ‘test’ set to assess the performance of the selected model. Data from 1 January 2019 to 31 October 2019, were split into ‘training’ set and ‘validation’ set with proportion 90% and 10%, respectively (figure 1). Patients admitted from 1 November 2019 to 31 December 2019 were used to create ‘test’ set which split by calendar month to ensure temporal generalisability of the models. Where there were duplicate inpatient visits by the same patient in the ‘training’ and ‘test’ set, the record was excluded to avoid testing based on previously learnt data. These 196 CXRs excluded from the ‘test’ set was added to the ‘training’ and ‘validation’ set for model development.

Datasets for CAPE model development and prospective cohort study. (A) Retrospective dataset for model training, validation and testing. (B) Prospective cohort study to assess model discrimination for 30-day mortality. CAPE, CAP AI predictive Engine; CXR, chest radiography.
A deep-learning classifier was developed which combined a pretrained image classification network—Xception. Xception is an extension of the inception architecture, which replaces the standard Inception modules with depth-wise separable convolutions.23 A transfer learning approach, which uses a predefined model, has the benefit of taking advantage of data from the first setting to extract information that may be useful when learning or even when directly making predictions in the second setting.24 The models were implemented in Keras, V.1.3.0 29, Scikit-learn, V.0.19.one and Python V.3.7 (Python Software Foundation).
Model training was stopped in April 2020, when AUC for inpatient mortality in the ‘test’ set was determined to have reached 0.890 and accuracy of 0.899. After accounting for data clustering in the retrospective cohort, CAPE mortality risk score had an AUC of 0.88 (95% CI 0.86 to 0.90, p<0.001). The model showed good internal calibration (calibration intercept=0.00, slope=1.00, Brier score=0.069) (table 1).
Baseline risk factors and pneumonia characteristics in relation to 30-day mortality
Subsequently, CAPE was implemented as a computer application. Independent CXR in Digital Imaging and Communications in Medicine (DICOM) format uploaded into the software may be analysed for determination of an image-based mortality risk score. To aid clinicians in visually interpreting how the predictive score was generated by the deep-learning model, we adopted the use of a gradient-weighted class activation map to generate a heatmap. This demonstrates the neural-network activated in the forward-pass during inference/prediction. Figure 2 demonstrates an AI generated heatmap overlaid on a CXR showing pneumonic consolidation.

AI generated Grad-CAM heatmap of a CXR with community-acquired pneumonia. Frontal chest radiograph (A) of a patient presenting with acute respiratory failure secondary to pneumonia, performed in the emergency department. Grad-CAM heatmap (B) highlights areas of greatest class activation by the AI model, which corresponds to areas of pulmonary consolidation, with the extent and intensity of activation mirroring the severity of pneumonia. AI, artificial intelligence; CXR, chest radiography; Grad-CAM, gradient-weighted class activation map.
Prospective cohort study for discrimination of CAPE mortality risk score
The prospective cohort study included adults who required inpatient admission for a physician-determined diagnosis of CAP via the emergency department. This occurred over the period of 11 May 2020 to 15 June 2020. They were identified within 72 hours of admission utilising electronic medical records. Baseline demographic information and health risk factors such as age, smoking status, body mass index and comorbidities were collected by trained research personnel, who were blinded to CAPE. Disease characteristics at initial presentation were recorded, these included vital signs; pneumonia severity scores; self-reported respiratory symptoms; the presence of associated complications such as acute kidney injury, acute myocardial injury and delirium. Laboratory data such as blood indices, biochemistry, infection biomarkers and microbiology tests were collected. Significant treatment data which may affect mortality outcomes, like prior antibiotics usage in the previous 30 days and timing of antibiotic administration, were recorded for analysis.
Patients with pulmonary tuberculosis were not excluded from the cohort as pulmonary tuberculosis is endemic in Singapore. CAP with SARS-CoV-2 as the microbial aetiology is endemic in some countries, hence it was not excluded. Recently, PSI and CURB-65 has been shown to demonstrate good discrimination for SARS-CoV-2 pneumonia.25–27 The authors discern that a model incorporating all microbial causes of CAP would be practically more useful in healthcare systems where comprehensive testing for microbial aetiologies may be limited by available resources.
The first CXR performed on the day of inpatient admission, was extracted for CAPE analysis. The image is loaded from a standard DICOM file to generate an image-based heatmap and mortality risk score (figure 2). The mortality risk score is expressed in whole numbers from 0 to 100, with higher values indicating greater risk of death. A primary outcome of mortality at 30 days from the time of admission, concluded the data collection for analysis. Sample size calculation was based on a formula reported in Riley et al.28 To estimate the 30-day mortality risk in the prospective dataset with sufficient precision, assuming an anticipated outcome proportion of 0.2 and a margin of error <0.05, the required sample size is at least 246.
Statistical analysis
This study was reported in accordance with the Transparent Reporting of a multivariate prediction model for Individual Prognosis or Diagnosis guidelines.29
Logistic regression was used to model 30-day mortality, with the CAPE mortality risk score as a predictor in the retrospective dataset, and PSI or CURB-65 as a predictor in the prospective dataset. We assessed if the log odds of 30-day mortality was linearly associated with CAPE mortality risk score and PSI using Box-Tidwell tests. We then modelled CAPE mortality risk scores and PSI values using a restricted cubic spline function with five knots at the 5th, 27.5th, 50th, 72.5th and 95th ercentiles before testing if the coefficient of the non-linear spline terms jointly equal 0.30 Cluster-robust SEs were used to account for clustering by subjects. Model discrimination was assessed using the AUC, with 95% CI calculated by clustered bootstrap resampling (1000 replications).
Model calibration was assessed graphically using calibration plots with locally weighted scatterplot smoothing to examine the agreement between predicted and observed mortality risk across deciles.31 The calibration-in-the-large (CITL) and the calibration slope were assessed. An ideal CITL and calibration slope would have values of 0 and 1 respectively.32 A CITL of <0 (or >0) indicates that the model overestimates (or underestimates) risk on average, while a calibration slope of <1 (or >1) indicates that the predicted risks are too extreme (or too moderate).32 Where there was miscalibration, a more parsimonious method of model recalibration was adopted as the prospective dataset was small relative to the retrospective dataset. The intercept and slope were updated using the prospective dataset by using the linear predictor in the original model as the only covariable (logistic calibration).33 34
Overall goodness-of-fit was assessed using the Brier score,31 which measures the accuracy of predictions. The score ranges from 0 to 1, with a lower score indicating better model performance.
The high mortality risk cut-off was selected at ≥20%, similar with commonly used cut-offs in the literature.5 Model performance in terms of sensitivity, specificity, positive predictive value (PPV) and negative predictive value (NPV) were assessed across potential mortality risk cut-offs.
To quantify the incremental value of CAPE, the net reclassification improvement (NRI) for the addition of CAPE to PSI and CURB-65, respectively, were calculated.35
Spearman’s r was used to measure the strength of correlation between CAPE mortality risk score and PSI; CAPE mortality risk score and CURB-65. Weighted Cohen’s kappa was used to estimate the degree of agreement between CAPE mortality risk score and PSI class36; CAPE mortality risk score and CURB-65. For this analysis, CAPE mortality risk score (range 0–100) was divided into five categories (0–20, 21-40, 41–60, 61–80, 81–100); while CURB-65 (range 0–5), had scores 4 and 5 collapsed into one severity band, to make five categories.
Missing data were present in some variables such as body mass index and laboratory data. No missing data were present in the calculation of Pneumonia Severity Scores of CURB-65, PSI and CAPE mortality risk score. As the primary and secondary outcome analysis did not require use of variables with missing data, no treatment of missing data using imputation methods was necessary.
All statistical analyses were conducted using Stata V.15.0 (StataCorp).
Results
A total of 315 inpatient visits for CAP were included for analysis over the prospective cohort period between 11 May 2020 and 15 June 2020 (figure 1). This comprised 302 subjects, of whom two had three inpatient visits; nine had two inpatient visits. Statistical analysis was performed for all 315 inpatients visits for the following four reasons: subjects who had more than one visit had returned to community prior to a second or third inpatient episode of pneumonia; the CAPE mortality score generated based on the CXR at the start of each visit, were varied due to different severities of CAP at presentation; the 61 subjects who did not survive to 30 days were unique with no duplication primary outcome in the analysis; the authors sought to validate the model in a real-world situation, where some patients experience early hospital readmission after discharge.
Baseline demographics and comorbidities
A total of 315 inpatient visits for CAP over the prospective cohort study period had 30-day mortality of 19.4% (n=61/315). 56.8% (n=179/315) were male. Baseline demographics, health risk factors and comorbidities are presented in table 1.
Non-survivors were older than survivors (mean (SD)age, 80.4 (10.3) vs 69.2 (18.7)). They had lower body mass index (mean (SD), 19.9 (3.7) vs 23.5 (6.3)); more residing in long-term care facilities (n=18/61 vs n=45/254); had prior hospitalisations in previous 30 days (n=20/61 vs n=49/254). Comorbidities found more commonly in non-survivors were dementia (n=27/61 vs n=58/254); active malignancies (n=16/61 vs n=18/254) and chronic kidney disease (n=14/61 vs n=34/254).
CAP data
At initial disease presentation, non-survivors were more likely to have higher heart rates (mean (SD), higher respiratory rates, lower blood pressures, lower pulse oximetry readings, require high oxygen supplementation. Symptoms of dyspnoea (n=42/61 vs n=88/254) and delirium (n=15/61 vs n=11/254) were more common in the non-survivors. As were CAP complications of delirium (n=15/61 vs n=11/254); acute kidney injury (n=30/61 vs n=43/254); acute myocardial injury (n=10/61 vs n=43/254).
Significantly, non-survivors demonstrated higher inflammatory biomarkers such as serum C-reactive protein (mean (SD), 109 mg/L (98.6) vs 59.3 mg/L (69.7)); serum procalcitonin (mean (SD), 11.3 (27.8) μg/L vs 1.4 (5.9) μg/L); white cell count (mean (SD), 18.9 x10∧9 cells/L(30.7) vs 11.3 x10∧9 cells/L(4.9)).
The spectrum of microbiological data captured in the prospective study cohort was influenced by limited microbiological testing for non-severe CAP, and microbial aetiologies apart from SAR-CoV-2, over the period of study recruitment. This was to preserve local laboratory capacity for population SAR-CoV-2 screening. All patients received SARS-CoV-2 PCR testing, of which 5.7% (n=18/315) were positive. Twenty-nine mycobacterium tests were performed at physician discretion, yielded 3.5% (n=11/315) of pulmonary tuberculosis as the underlying microbial cause of CAP. No patients with COVID-19 or pulmonary tuberculosis demised.
All non-survivors received appropriate antibiotics in the first 24 hours of presentation, while 91.4% (n=288/315) of the total study cohort received the same.
CAPE mortality risk score and pneumonia severity scores: CURB-65, PSI
The AUC of CAPE mortality risk score for 30-day mortality was determined to be 0.79 (95% CI 0.73 to 0.85, p<0.001). The AUC of CURB-65 for 30-day mortality was 0.76 (95% CI 0.70 to 0.81, p<0.001); while that of PSI was 0.80 (95% CI 0.74 to 0.86, p<0.001) (table 2, figure 3A).
Model discrimination and calibration in retrospective and prospective datasets

(A) CAPE mortality risk score and pneumonia severity scores receiver operator characteristic curves for 30-day mortality. (B) PSI+CAPE mortality risk score and PSI receiver operator characteristic curves for 30-day mortality. (C) CURB-65+ CAPE mortality risk score and CURB-65 receiver operator characteristic curves for 30-day mortality. AUROC, area under the receiver operating characteristic curve; CAPE, CAP AI predictive Engine; CURB-65, Confusion of new onset, blood Urea nitrogen, Respiratory rate, Blood pressure, 65 years old; PSI, Pneumonia Severity Index.
There was evidence of miscalibration of CAPE mortality risk score with a CITL of 0.84, calibration slope of 0.58 and Brier score 0.14 (online supplemental figure 1). We recalibrated the model by updating both the intercept and slope using the prospective dataset. The recalibrated model had a CITL of 0.00, calibration slope of 1.00 and Brier score 0.13 (table 2).
Supplemental material
We incorporated CAPE with PSI, and CAPE with CURB-65, respectively. We then assessed if there were differences in the AUCs between (1) CURB-65 +CAPE, and (2) PSI+CAPE models, based on a method described by DeLong et al37 CURB-65 +CAPE (AUC 0.83, 0.77 to 0.88, p<0.001) had a larger AUC than CURB-65 (χ2=8.66, p=0.003), while PSI+CAPE (AUC 0.84, 95% CI 0.79 to 0.89, p<0.001) had a larger AUC than PSI (χ2=3.79, p=0.052) (figure 3B,C). Calibration performed in the prospective dataset is presented in online supplemental figure 2.
The NRI for the addition of CAPE to PSI at a 30-day mortality risk threshold of 0.20 was 4.6% (95% CI 3.9% to 5.3%); while the NRI for the addition of CAPE to CURB-65 was 4.5% (95% CI 3.8% to 5.2%), presented in online supplemental table 1.
Supplemental material
The performance of the CAPE mortality risk score in clinically relevant metrics across different risk cut-offs are described in table 3. At the 30-day mortality risk cut-off of 0.20, sensitivity was 0.77 (n=47/61), specificity 0.67 (n=169/254), PPV 0.36 (n=47/132), NPV of 0.92 (n=169/183).
Performance of CAPE mortality risk score in predicting 30-day mortality at different risk cut-offs in the prospective dataset
Logistic regression of CAPE mortality risk score for the binary outcome of 30-day mortality yielded an unadjusted OR of 1.04 (95% CI 1.03 to 1.05, p<0.01), indicating a 4% increase in the odds of death for every 1-point increase. The unadjusted OR of CURB-65 (0–5 scale) for 30-day mortality was 2.66 (95% CI 1.94 to 3.65, p<0.01); while that of PSI (ranged 16 to 210 in cohort) was 1.03 (95% CI 1.02 to 1.04, p<0.01), respectively. The Box-Tidwell test did not show evidence of departure from linearity for CAPE mortality risk score (p=0.63) or PSI values (p=0.80). This was consistent with tests of the coefficients of the non-linear spine terms for CAPE mortality risk scores (χ2=4.31, p=0.230) and PSI values (χ2=6.18, p=0.103).
To assess for correlation between CAPE mortality risk score and PSI, the Spearman’s r was 0.50 (p<0.01), while that of CAPE mortality risk score and CURB-65 was 0.44 (p<0.01), indicating moderate and low positive correlation, respectively.
To assess for agreement, weighted Cohen’s kappa was used for analysis. There was moderate agreement between CAPE mortality risk score and PSI, with kappa determined to be 0.46; while that of CAPE mortality risk score and CURB-65 had a kappa of 0.38, showing fair agreement.
The characteristics of the patients with discordant and concordant 30-day mortality risk categories based on CAPE and PSI are presented in online supplemental table 2.
Discussion
In this study, we demonstrated that an AI model based on first CXR image performed during the assessment for CAP can prognosticate 30-day mortality with an AUC of 0.79. This is comparable to that of currently used, well-validated pneumonia severity risk scores, with an AUC of 0.80 for PSI and 0.77 for CURB-65 demonstrated in the same study cohort. The AUCs for PSI and CURB-65 in this study are similar with that of a prior meta-analysis.9
We showed that CAPE mortality risk score had moderate positive correlation and agreement with PSI; low positive correlation and fair agreement with CURB-65. This suggests that while all three prognostic tools displayed similar AUCs, the CAPE mortality risk score can do so by using imaging parameters captured by CNN, independent of the need for descriptive medical data.
We further combined CAPE mortality risk score with well-validated pneumonia severity risk scores. The AUC of CURB-65 improved from 0.76 (95% CI 0.70 to 0.81) to 0.83 (95% CI 0.77 to 0.88), while PSI improved from 0.80 (95% CI 0.74 to 0.86) to 0.84 (95% CI 0.79 to 0.89). This indicates that the additional of an imaging CNN model to traditional pneumonia severity scoring has value in improving the discrimination of the model for mortality.
To our knowledge, this is the first report describing deep learning of CXRs to predict 30-day mortality in CAP. Future research may be conducted to accurately quantify the degree to which CNN analysis of CXRs correlate with commonly used pneumonia severity markers, such as oxygenation and sepsis indices, to understand the additional value that CNN brings to pneumonia prognostication.
The authors suggest that CAPE has the potential be a clinical decision support tool incorporated into emergency department or inpatient clinical workflows, for the purposes of triaging of CAP. One such example could be a triaging clinician indicating the diagnosis of CAP on a CXR request. The DICOM image can be processed through the CAPE software by trained personnel to generate the CAPE mortality risk score. If the CAPE mortality risk score threshold is below 5%, this would correspond to an NPV of 0.96. This information may be communicated on a radiology report to the clinician to encourage outpatient care for low-risk CAP or early discharge strategies. Conversely, if the CAPE mortality risk score threshold is above 20%, this would correspond to a PPV of 0.36 for mortality. This information may be communicated to the clinician to strongly consider the need for critical care monitoring, with advanced care plans in place. In centres where PSI and CURB-65 are scored routinely and available electronically, the combined PSI- CAPE or CURB-65- CAPE model can provide greater discrimination. This may subsequently be applied in pre-existing institution-specific workflows for CAP.
A potential advantage of an AI prognostic model is the flexibility of rapidly customising cut-off points or risk thresholds to CAP epidemiology and healthcare resource availability over time and space. This would maximise efficiency of healthcare resources. For example, during pandemic hospital bed shortages, (in conjunction with real-time vital signs) the model risk threshold can be increased to identify patients at higher risk of deterioration to prioritise care. (Data scientists) can remotely calibrate the model by CXR extraction, based on recent mortality data, and adjust the risk threshold of the model accordingly.
The authors recognise that while robust prognostic models may exist, further studies are needed to assess the effectiveness of real-world implementation. Currently, there is a paucity of data on quality improvement outcomes using AI as clinician decision support tools.38 39 In addition, the real-world implementation of existing disease prognostication tools may or may not contribute to improving clinical outcomes ultimately. Factors such as clinician acceptance and the availability of effective clinical support systems to incorporate these tools are likely to play a greater role in improving care outcomes.40–42
Limitations
The model was developed using radiological and health data from a single institution with prospective validation performed at the same place. Hence, we have not demonstrated generalisability. The study authors are currently in the process of performing a multicentre study for this purpose and welcome any collaborators who may be interested in developing, validating, and using this tool. While CAPE is proprietary (intellectual property belonging to Singapore Health Services and Integrated Health Information Systems), the authors have collectively agreed for free use of this software with acknowledgements, for research purposes, over the duration of COVID-19 pandemic.
A second limitation would be the lack of comprehensive or standardised microbiological data collection during the study period. This was due to manpower and laboratory resources being diverted to prioritise pandemic planning and SARS-CoV-2 testing. Despite this, the study authors suggest that radiological severity can be more predictive of mortality than microbiological aetiology. While impact of microbiological data on the AUC of CAPE mortality risk score is yet uncertain, the authors suggest that there may be minimal effect on the discrimination of the model.
A third limitation is that the authors have yet to ascertain if CAPE mortality risk score would have higher discriminative power if combined with non-imaging medical data, apart from PSI and CURB-65. Further model development in combination with known CAP mortality predictors is in progress.
Lastly, the authors acknowledge that the outcome of mortality in CAP, while important, may be less clinically useful than other outcome indicators such as risk of critical care admissions and estimated length of inpatient stay. The authors are currently working on AI models to address these clinical questions.
Conclusion
We have shown that AI can be used to build a mortality prognostic model for CAP based on CXR. The AUC for 30-day mortality is comparable to conventional pneumonia severity scores such as PSI and CURB-65, with further potential to improve its discrimination for mortality.
Supplemental material
Data availability statement
Data are available on reasonable request. Deidentified data are available from the corresponding author on reasonable request subjected to institutional approval.
Ethics statements
Ethics approval
Ethics approval was given by SingHealth Centralised Institutional Review Board (CIRB 2020/2100).
Acknowledgments
The authors thank Mr. Koh Tzan Tsai, Ms. Sandhiya Ramanathan, Dr. Angeline Poh, Dr. Jansen Koh, Dr. Perry Liew, Dr. Oh Hong Choon, Dr. Srinath Sridharan and research coordinators of Changi General Hospital, Clinical Trials & Research Unit, for their dedicated help in data preparation and analysis; We also thank the physicians of General Medicine and Respiratory departments, radiologists of Diagnostic Radiology department, for contributing data through their daily clinical work.
References
Supplementary materials
Supplementary Data
This web only file has been produced by the BMJ Publishing Group from an electronic file supplied by the author(s) and has not been edited for content.
Footnotes
JQ and CJYL contributed equally.
Contributors All listed authors have substantial contributions to the conception or design of the work; or the acquisition, analysis or interpretation of data for the work; and drafting the work or revising it critically for important intellectual content; and dinal approval of the version to be published; and agreement to be accountable for all aspects of the work in ensuring that questions related to the accuracy or integrity of any part of the work are appropriately investigated and resolved.
Funding The authors have not declared a specific grant for this research from any funding agency in the public, commercial or not-for-profit sectors.
Disclaimer We grant BMJ Open Respiratory Research exclusive license for publication of this work.
Competing interests None declared.
Provenance and peer review Not commissioned; externally peer reviewed.
Supplemental material This content has been supplied by the author(s). It has not been vetted by BMJ Publishing Group Limited (BMJ) and may not have been peer-reviewed. Any opinions or recommendations discussed are solely those of the author(s) and are not endorsed by BMJ. BMJ disclaims all liability and responsibility arising from any reliance placed on the content. Where the content includes any translated material, BMJ does not warrant the accuracy and reliability of the translations (including but not limited to local regulations, clinical guidelines, terminology, drug names and drug dosages), and is not responsible for any error and/or omissions arising from translation and adaptation or otherwise.