Article Text

Abstract
Background The Laboratory-based Intermountain Validated Exacerbation (LIVE) Score is associated with mortality and chronic obstructive pulmonary disease (COPD) exacerbation risk across multiple health systems. However, whether the LIVE Score and its associated risk is a stable patient characteristic is unknown.
Methods We validated the LIVE Score in a fourth health system. Then we determined the LIVE Score stability in a retrospective cohort of 98 766 patients with COPD in four health systems where it was previously validated. We assessed whether LIVE Scores changed or remained the same over time. Stability was defined as a majority of surviving patients having the same LIVE Score 4 years later.
Results The LIVE Score separated patients into three LIVE Score risk groups of low, medium, and high mortality and LIVE Score stability. Mortality ranged from 6.2% for low-risk LIVE to 45.8% for high-risk LIVE (p<0.001). We found that low-risk LIVE groups were stable and high-risk LIVE groups were unstable. Low-risk LIVE group patients remained low risk, but few high-risk LIVE group patients remained high risk (79.0% high vs 48.1% medium vs 8.8% low, p<0.001 for all pairwise comparisons).
Conclusion The LIVE Score identifies three major clinically actionable cohorts: a stable low-risk LIVE group, an unstable high-risk LIVE group with high mortality rates, and a medium-risk LIVE group. These observations further our understanding of how existing data used to calculate the LIVE Score may target interventions across risk cohorts of patients with COPD in a health system.
- COPD exacerbations
- emphysema
- health economist
- clinical epidemiology
This is an open access article distributed in accordance with the Creative Commons Attribution Non Commercial (CC BY-NC 4.0) license, which permits others to distribute, remix, adapt, build upon this work non-commercially, and license their derivative works on different terms, provided the original work is properly cited, appropriate credit is given, any changes made indicated, and the use is non-commercial. See: http://creativecommons.org/licenses/by-nc/4.0/.
Statistics from Altmetric.com
Key messages
What is the key question?
Is the mortality risk in patients with chronic obstructive pulmonary disease (COPD), which has been assessed by the Laboratory-based Intermountain Validated Exacerbation (LIVE) Score, a stable characteristic of patients, or does the LIVE Score fluctuate?
What is the bottom line?
The low-risk LIVE Scores are stable, meaning patients with COPD at low risk are likely to remain low risk, while the high-risk LIVE Scores are unstable, meaning that patients who are at high risk are likely to die or to recover to a lower-risk LIVE Score.
Why read on?
Understanding the LIVE Score and its characteristics in patients with COPD helps further our goal of personalising COPD care across a health system by harnessing routine clinical data in electronic health records.
Introduction
Chronic obstructive pulmonary disease (COPD) is a common, progressive respiratory disease characterised by airflow obstruction. COPD primarily impacts patients through exacerbations that worsen quality of life, reduce lung function, and increase healthcare utilisation.1 There is increasing recognition that multimorbidity, not just severity of lung function, drives poor health outcomes including mortality, COPD exacerbation frequency, functional ability, and healthcare utilisation among patients with COPD.1–6
Pulmonary function tests (PFTs) and physiological assessment of the presence and degree of obstruction remain the cornerstone of COPD diagnosis1. However, dyspnoea, exercise tolerance (as in the Body-Mass Index, Airflow Obstruction, Dyspnea, and Exercise Capacity [BODE] Index7), and COPD exacerbation frequency, are better predictors of mortality and COPD exacerbation frequency than PFTs alone, and form the basis of categorising patients with COPD in current guidelines.1 8 In addition, while dyspnoea, exercise tolerance, and hospitalisation in patients with COPD may be attributable to COPD, they may also be attributable to other comorbidities, such as cardiovascular disease.
Risk stratification among patients with COPD provides prognostic information to patients and families. This information can aid in shared decision making, guide care management strategies, and help focus limited resources for the highest patient benefit.9 10 However, most risk scores for patients with COPD rely on data typically unavailable for the majority of patients with COPD, such as PFTs, dyspnoea scores or exercise tolerance.7 While integration of multimorbidity data with risk scores has been lacking for COPD, laboratory-based risk scores have been shown to predict mortality, heart failure diagnosis, and 30-day readmission in cardiovascular patients.11–16 More recently, laboratory-based risk scores assessing 30-day readmission risk in patients with heart failure have been used to direct clinician management resources.17
Our team has developed and validated the Laboratory-based Intermountain Validated Exacerbation (LIVE) Score in patients with a COPD diagnosis18 using clinically collected electronic health record (EHR) data. This score has five categories of all-cause mortality risk and COPD exacerbation risk ranging from highest risk (LIVE 1) to lowest risk (LIVE 5). The LIVE Score has the advantage of accounting for multimorbidities (haemoglobin, albumin, and creatinine are among the variables that factor into the LIVE Score), and is easily calculated using available EHR data without additional data entry.
The LIVE Score has been validated in over 100 000 patients from multiple health systems within USA.18 These included the National Veterans Affairs Health System, comprising over 80 000 patients with COPD from across USA, the University of Chicago Health System, comprising over 2000 patients with COPD who live in an urban area, the Northwest Kaiser Permanente (NWKP) Health System, comprising over 17 000 patients with COPD in north-west USA who have predominantly employment-based insurance coverage, and over 48 000 patients from the Intermountain Healthcare system, which includes a combination of urban and rural patients with COPD from Utah as well as parts of Idaho, Wyoming, and Nevada. In the same cohorts, COPD exacerbation frequency was only a fair predictor of healthcare utilisation and all-cause mortality19
The LIVE Score and its associated mortality prediction may be useful for clinicians, researchers and healthcare decision makers. First, for the bedside clinician, the LIVE Score may help identify patients with COPD who have high mortality risk assessed beyond the severity of obstruction alone. While GOLD stage, and degree of obstruction, have been associated with COPD mortality, reliable identification of patients with COPD at high mortality risk due to factors beyond COPD remains a challenge.20 While patients with COPD have higher rates of heart failure and cardiovascular comorbidities, the treatment of cardiovascular disease in patients with COPD lags behind treatment in the general population.21 Thus, risk stratification for bedside clinicians using the LIVE Score may aid in personalising the care for patients with COPD and focusing attention on optimal therapy for COPD alone, and improved treatment of comorbidities, especially in these highest-risk patients.
For the researcher, the LIVE Score provides an easy-to-understand, reproducible tool for stratifying data sets of patients with a COPD diagnosis. It identifies patients at high mortality risk, and patients who have fewer comorbidities (low-risk LIVE Score) in whom COPD targeted therapies may be most efficacious.
Finally, from a health system perspective, the LIVE Score provides actionable data for personalised treatment of patients with COPD. While current guidelines recommend many proven therapies for the treatment of patients with COPD, at the bedside, for a variety of reasons, we do not implement these recommendations consistently. Using the LIVE Score to provide actionable risk data, health systems can focus on improving workflows and guideline adherence for the highest yield. For example, interventions aimed only at optimising COPD care are likely to have limited benefit in patients in whom the increased mortality is driven by multimorbidities. Thus, the LIVE Score, in addition to PFT data when available, may be used to best personalise interventions in patients with COPD.
Whether the LIVE Score, and its associated risk, is a stable patient characteristic that identifies patients who are high risk or low risk over years is unknown. Understanding the stability of the LIVE Score and its associated risk would further our understanding of its utility in clinical care and population health management. In this study, we tested whether the LIVE Score, and its associated risk, is a stable patient characteristic.
Methods
Study design and patients
This is a large, retrospective cohort study. LIVE Score stability was assessed in patients with COPD with a calculable LIVE Score across four health systems: Intermountain Healthcare, the National Veterans Affairs Health System, the NWKP Health System and the University of Chicago Health System. This study was conducted in accordance with the Declaration of Helsinki and Good Clinical Practice guidelines.
The LIVE Score had been previously validated in three health systems. Before assessing LIVE Score stability across all cohorts, we validated the LIVE Score in the fourth health system (NWKP Health System). COPD diagnosis was defined by billing codes (Blagev et al18 and online supplementary table 1).
Supplemental material
Data extraction
The four health systems have different EHRs and data warehouse architectures for electronic data extraction. Intermountain Healthcare designed an integrated, system-wide electronic medical record, which transitioned to iCentra (Cerner Corp, North Kansas City, Missouri, USA and Intermountain Healthcare, Salt Lake City, Utah, USA) in 2017. The Veterans Affairs (VA) Health System uses the Veterans Information Systems and Technology Architecture EHR and system. Kaiser Permanente and the University of Chicago Health System both use Epic as their EHR (Epic Corp, Verona, Wisconsin, USA). Smoking status was collected by each health system according to workflows and is encoded in the EHR data. These included categories of never, current, and former smoker status. Tobacco use rates and demographics were presented for the start of the study. Smoking rates, as with all variables in our study, were queried from the EHR.
The Intermountain site extracted EHR laboratory, spirometry, and professional coding data consisting of the variables needed to calculate the LIVE Score, COPD diagnoses, and health outcomes as previously described.18 The tables of the requested variables were available to the research team at Intermountain (DPB, SR and DSC). VA EHR data were extracted from the VA Corporate Data Warehouse databases through the VA Informatics and Computing Infrastructure (VINCI) server. VINCI is a Health Services Research and Development resource centre that provides researchers a nationwide view of high-value VA patient data. Data analysis was done by SZ and MA who had full access to the data.
NWKP employs a fully electronic medical record using a modified Epic (Health Connect) system with a research mechanism that is used to populate a variety of administrative and clinical databases that are available to investigators for use in approved research studies. These databases are linked using the member’s unique health record number. For this study we extracted information on COPD-related outpatient and inpatient encounters, demographics, spirometry and laboratory results from the NWKP data warehouse mapped to the specifications set by the original LIVE derivation element rules and parameters. A de-identified data set was created and via secured data transfer, shared with Intermountain for analyses. Data analysis was performed by DSC and DPB who had access to the de-identified data set.
Data analysis for the University of Chicago Health System was performed by KAC and VGP who had access to a de-identified data set of variables needed to calculate the LIVE Score for each year, healthcare utilisation, and mortality. Demographics, location data, vital signs, laboratory values, interventions, medications, nurse documentation and diagnostic orders were accessed through the Clinical Research Data Warehouse at the University of Chicago. Data were time stamped with the time that the data were made available in the EHR (eg, time the laboratory results were available in the EHR).
LIVE Score validation
The LIVE Score was previously validated in three health systems showing risk stratification for all-cause mortality, COPD exacerbation frequency and comorbidity rates.18 The LIVE Score validation for the NWKP cohort is reported here. Adult patients within the NWKP region who were alive in 2013 with a COPD diagnosis and a LIVE Score were included (online supplementary figure 1). The COPD diagnosis in this population was defined by encounter diagnosis codes present at least once between 2009 and 2013 (online supplementary table 1). LIVE Scores were calculated for each patient for each year starting in 2013 through 2016 based on laboratory values between 2009 and the ‘current’ year of calculation. All-cause mortality, and severe COPD exacerbation (hospitalisation and/or emergency department visit for COPD) were assessed over the cohort (2013 to 2016). Kaplan-Meier survival curves were calculated to evaluate time-to-event results for mortality and COPD exacerbation outcomes (online supplementary methods and Blagev et al18). All-cause mortality, and severe COPD exacerbation (hospitalisation and/or emergency department visit for COPD) were assessed over the cohort (2013 to 2016). Kaplan-Meier survival curves were calculated to evaluate time-to-event results for mortality and COPD exacerbation outcomes. In addition, Charlson Comorbidity Index22 comorbid condition rates were assessed in the first year of the cohort (2013) for each patient and prevalence of comorbidities was reported with descriptive statistics.23
LIVE Score stability
All patients who were alive and had a LIVE Score for 4 years were included for analysis. As previously reported, patients with high-risk LIVE Scores had very high mortality.18 To avoid issues with censorship by death, we included only patients who survived for 4 years and had a valid LIVE Score in the stability analysis. Thus, patients who remained alive and had a valid LIVE Score within their health system (though not necessarily specific hospital) were included and no additional censoring for movement out of a health system was done. LIVE Score stability was graphically represented following formatting of previous graphical representations of COPD exacerbation frequency stability.24
The LIVE Score was calculated as previously described based on laboratory data in the first year and up to 5 years prior depending on the variable (24). We categorised the LIVE Score in high-risk, medium-risk and low-risk LIVE Groups based on all-cause mortality (figure 1). The decision tree as originally published18 separated patients with COPD into five LIVE Scores based on six laboratory variables—namely the minimum haemoglobin, minimum albumin in the previous year, the minimum potassium in the previous year, the maximum creatinine in the previous year, the maximum haemoglobin within the previous year and the minimum chloride. The laboratory values at each decision node were based on local laboratory flags of high, low, or normal, since normal ranges can vary with laboratory equipment and analytical techniques. Thus, absolute cut-off’s for values could change over time at the same laboratory as well as expected variation among laboratories. A sample of laboratory value ranges for these variables from Intermountain Healthcare are presented in the online supplementary material, table 5.

LIVE Score. The LIVE Score was previously validated on a 5-point scale of highest-risk LIVE 1 to lowest-risk LIVE 5. Here we present the LIVE Score tree that categorises LIVE 1 and 2 as high-risk LIVE Score, LIVE 3 as medium risk and LIVE 4 and 5 as low risk. Laboratory cut-offs are based on categorical high/low/normal flags based on laboratory determination. ‘Ever’ variable is the minimum haemoglobin within the last 5 years. Other variables are min/max within the year. Alb, albumin; Creat, creatinine; Hgb, haemoglobin; K, potassium; LIVE, Laboratory-based Intermountain Validated Exacerbation; min, minimum; max, maximum.
In order to simplify the LIVE Score for bedside decision making, we divided it into three categories of high, medium and low risk. The LIVE 1 and 2 Scores were categorised as high-risk LIVE group. LIVE 3 was categorised as medium-risk LIVE group. LIVE 4 and 5 were categorised as low-risk LIVE group. LIVE Score stability was determined based on the categorical LIVE groups (high, medium, and low). A sensitivity analysis was performed to determine whether stability results were different when we considered the LIVE Scores 1 through 5.
A LIVE Score or LIVE risk group was considered ‘stable’ if more than half of surviving patients had the same LIVE Score or LIVE risk group 4 years later. We used 4 years as our definition of stability because although COPD exacerbation frequency as a stable characteristic was first described at 2 years,24 subsequent study in our clinical data has shown exacerbation frequency to become a ‘stable’ characteristic only after 3–4 years.19 The LIVE Score and LIVE risk groups were considered ‘unstable’ if the majority of patients who were alive at 4 years had a different LIVE Score or LIVE risk group. Finally, we created bar graphs illustrating LIVE Score stability over the years for LIVE 1 through 5 in all four health systems. Patients who were alive in year 1 with an existing LIVE Score and a COPD diagnosis in each health system were included. This figure was modelled after the stability of COPD exacerbation frequency as previously reported by Hurst et al.24 These graphs also include bars representing the number of patients who died during a given year.24
Patient and public involvement
Patients and public were not involved in the design, conduct or reporting of this trial.
Statistical analysis
Statistical analyses were performed using the R package V.3.6.1 2019 (R Foundation for Statistical Computing, Vienna, Austria) and SPSS Statistics for Windows software V.25.0 2017 (IBM Corp. Armonk, New York, USA). We compared proportions of stability and 4-year mortality between LIVE risk groups (low, medium, high) and LIVE Scores (1 through 5) using Fisher’s exact tests. Analysis of variance was used to determine statistical significance for continuous variables (COPD visits) and Fisher’s exact test was used to determine statistical significance for categorical variables (mortality, transthoracic echocardiogram and chest Computed Tomography [CT]). We ran the Cochran-Armitage trend test to check for associations between stability and LIVE Scores (1 through 5) and LIVE risk groups (low, medium, high). We used Kaplan-Meier survival analysis to compare LIVE Score survival functions for 4-year mortality and time to next exacerbation. We compared all survival functions using the pooled log rank test then compared individual survival functions using pairwise log rank tests of significance. We also ran Cox regressions of 4-year mortality and time to next exacerbation with LIVE Score as a predictor variable and age as a covariate.
Results
LIVE Score validation
The LIVE Score 1 through 5 association with mortality, COPD exacerbation risk and comorbidity rates were validated in the cohort of 17 124 patients from NWKP. All adult patients within the NWKP region who were alive in 2013 with a COPD diagnosis and a LIVE Score were included (online supplementary figure 1). Demographics for this population are summarised in table 1. Similar to our previous reports in the other health systems,18 only 11.6% of patients in this cohort had prior spirometry. A relatively low rate of current smoking (16.6%) was reported in that population and a relatively high rate of never smokers (37.9%) was noted. This rate of COPD in never smokers is within previously reported ranges from 27.7%25 up to 40.2% in a northern European population, with even higher rates of never smokers (up to 75.8% in women aged 76–77 years).26 However, the relatively high rate of never smokers could also be due to data quality variability, as these were data extracted from encoded elements captured in routine clinical workflows in the EHR and were not independently validated.
Baseline demographics for 17 124 patients from the Northwest Kaiser Permanente Health System
Using methods previously described for the other cohorts,18 all-cause mortality, COPD exacerbation rates and comorbidity rates were determined. Baseline demographics, comorbidities and healthcare utilisation for this cohort are shown in online supplementary tables 3–5. As noted in the other cohorts, 4-year all-cause mortality correlated with the LIVE Score. LIVE 1 (highest-risk) patients had 54.7% 4-year mortality, compared with 3.8% 4-year mortality in LIVE 5 (lowest-risk) patients, p<0.001 (table 2, figure 4A). Similarly, the LIVE Score correlated with COPD exacerbation risk with high-risk LIVE Score patients having higher risk of COPD exacerbation frequency compared with low-risk LIVE Score patients (table 2, figure 4B).
LIVE Score validation cohort—Kaiser Permanente mortality and healthcare utilisation
The same pattern repeated for comorbidity rates (for example, 40.9% of LIVE 1 patients had congestive heart failure whereas only 2.7% of LIVE 5 patients had congestive heart failure, p<0.001) (online supplementary table 4). High-risk LIVE 1 patients had much higher COPD exacerbation frequency compared with low-risk LIVE 5 patients (1.33 inpatient COPD visits per year vs 0.10 inpatient COPD, p<0.001) (online supplementary table 4).
LIVE Score and mortality survival analysis
A plot of the Kaplan-Meier 4-year mortality survival functions for LIVE Scores in the 17 124 patients in the NWKP cohort is shown in figure 2A. The overall pooled log rank test and each of the pairwise comparisons of mortality survival functions were statistically significant (p<0.001). A plot of the Kaplan-Meier time to next exacerbation survival functions is shown in figure 2B. The overall pooled log rank test was significant (p<0.001). In the pairwise comparisons of exacerbation survival functions, with the exception of LIVE 1 and 2 (p=0.43), all other pairwise comparisons were significant (p<0.001). Cox regressions for 4-year mortality and COPD exacerbation included LIVE Score as a predictor and age in 2013 as a covariate (table 3). LIVE Scores 1, 2, 3 and 4 represented a significant increase in the HR for the event of interest (4-year mortality or time to next exacerbation) while adjusting for age.
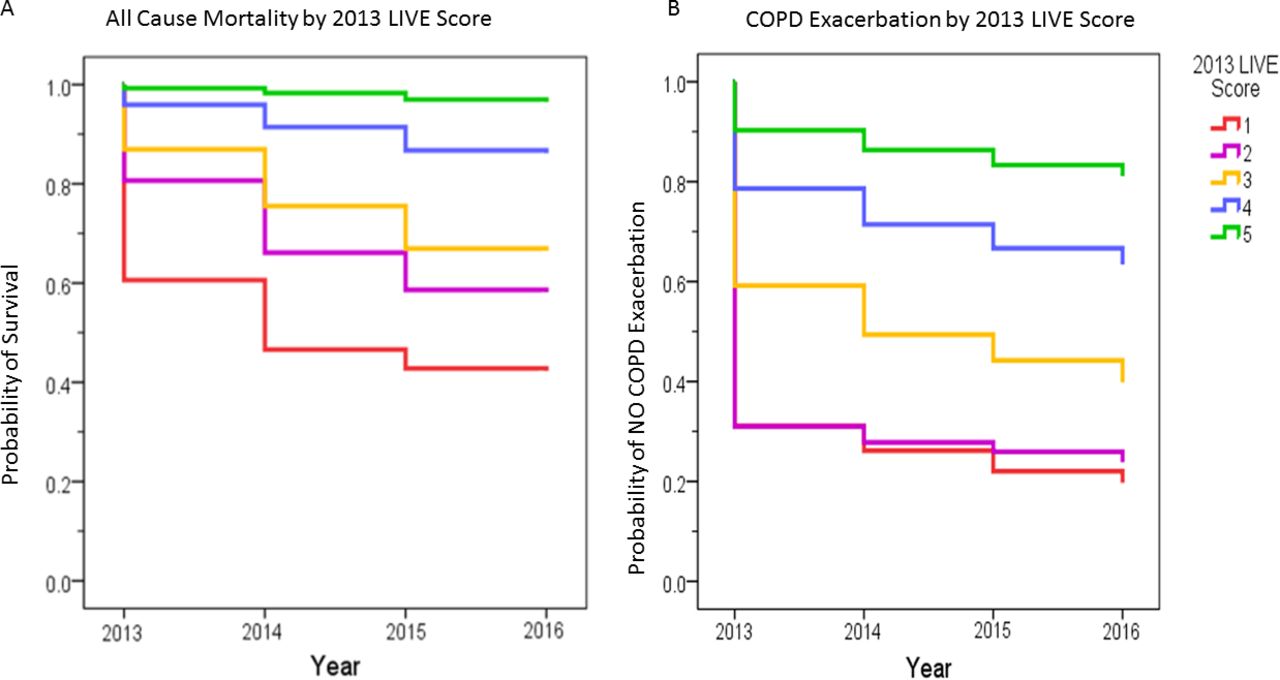
LIVE Score—mortality and COPD exacerbation frequency. (A) A Kaplan-Meier survival curve is shown for the 17 124 patients where 2013 LIVE Score is associated with 4-year all-cause mortality. High-risk LIVE Scores (1 and 2) have the highest mortality whereas low-risk LIVE Scores (LIVE 4 and 5) have low mortality. Cox regressions for 4-year mortality and COPD exacerbation included LIVE Score as a predictor and age in 2013 as a covariate (table 3). LIVE Scores 1, 2, 3 and 4 represent a significant increase in HRs for the event of interest (4-year mortality or time to next exacerbation) while adjusting for age. (B) A Kaplan-Meier curve is shown for the 17 124 patients where 2013 LIVE Score is associated with 4-year COPD exacerbation risk. High-risk LIVE Scores (1 and 2) have the highest COPD exacerbation risk whereas low-risk LIVE Scores (LIVE 4 and 5) have low COPD exacerbation risk.
Cox regression for mortality and COPD exacerbation for LIVE Score with age in 2013 adjustment
These regression results indicate that the LIVE Score predicts mortality and exacerbation risk independent of age.
Patient characteristics and LIVE Score categorised
The entire cohort of patients alive with a LIVE Score in year 1 was 110 439 patients, with overall 10.6% all-cause 4-year mortality yielding 98 766 patients included in the LIVE Score stability analysis (table 4). Mortality varied by LIVE Score, with high-risk LIVE group patients showing high 4-year all-cause mortality compared with low-risk LIVE group patients (45.8% vs 6.2%, p<0.001). Medium-risk LIVE group patients had 24.9% 4-year all-cause mortality (p<0.001 for comparisons vs high-risk and low-risk groups). Data for individual LIVE Scores 1 through 5 were similar and are shown in table 1. Data for individual health systems and log rank tests are presented in online supplementary table 2.
LIVE Score stability and mortality
LIVE Score stability
We included 98 766 adult patients with a diagnosis of COPD who were alive and had an existing LIVE Score for 4 years in the LIVE Score stability analysis. This cohort comprised: 12 587 adult patients from Intermountain Healthcare; 76 799 patients from the National Veterans Affairs Health System (VA); 8513 patients from the NWKP Health System; and 867 patients from the University of Chicago Health System. The Intermountain, VA and University of Chicago cohorts have been described in detail elsewhere.18 The majority of patients (84.9%) were in the low-risk LIVE Group, whereas very few patients (2.4%) were in the high-risk LIVE Group in the first year (table 4).
In all health systems, the low-risk LIVE Group was stable, whereas the high-risk LIVE Group was unstable among patients who survived all 4 years (table 4). The majority of low-risk LIVE group patients had the same LIVE risk group 4 years later while very few high-risk LIVE group patients did (79.0% vs 8.8%, p<0.001) (table 4). Similar results were noted when LIVE Scores were considered as LIVE 1 through 5 in the sensitivity analysis. LIVE 1 and 2 were unstable, LIVE 4 and 5 were stable, and LIVE 3 was in between (table 4 and figure 3). The majority of high-risk LIVE group patients who survived 4 years ‘recovered’ to a more stable medium-risk LIVE group (figures 4–7 and online supplementary figure 2A–C).

LIVE Score stability Kaplan-Meier curves for the four health systems. (A) The low-risk (LIVE 4 and 5) patients have a stable LIVE Score, whereas the high-risk patients (LIVE 1 and 2) have an unstable LIVE Score. Similar patterns are noted in the other cohorts: (B) The Veterans Affairs National Health System. (C) The Northwest Kaiser Permanente Health System. (D) The University of Chicago Health System.

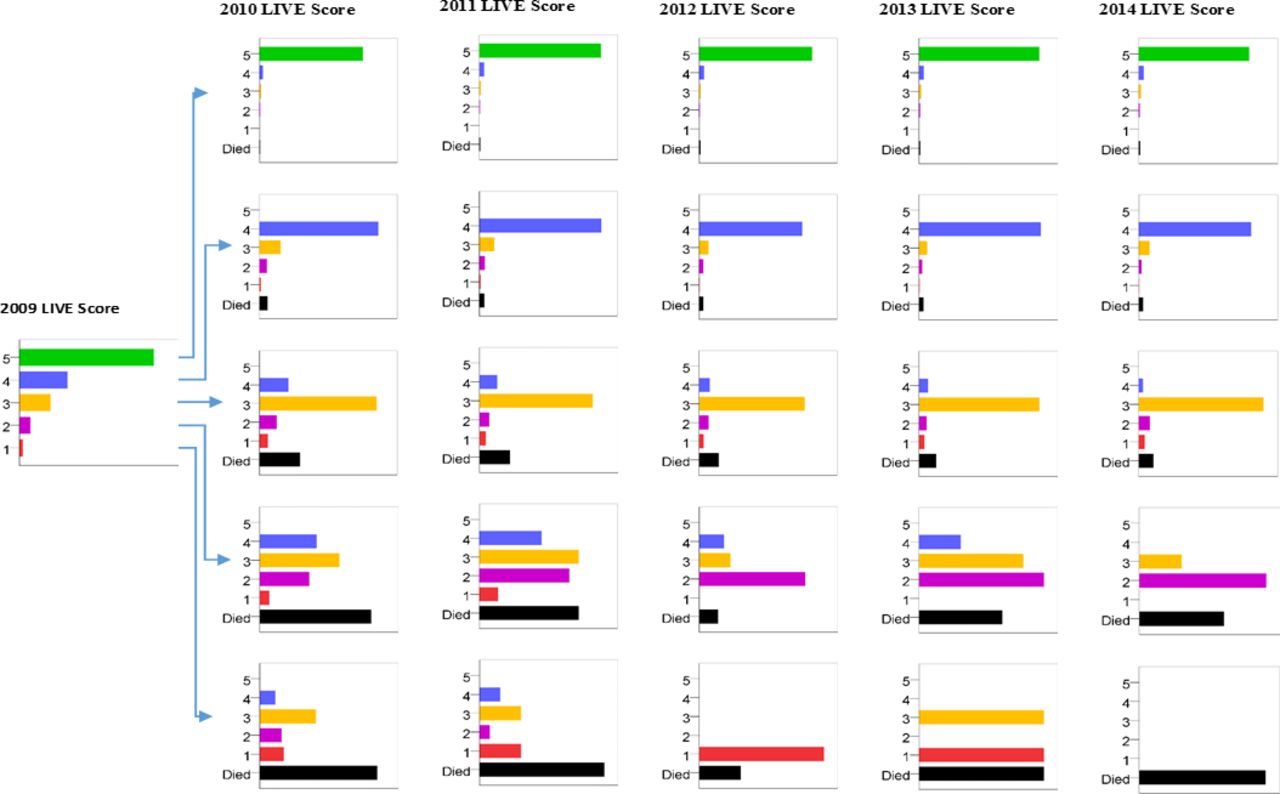
The 12 587 patients who met inclusion criteria at Intermountain Healthcare are shown. The majority of patients have a low-risk LIVE Score (LIVE 4 and 5) and very few patients have a high-risk LIVE Score (LIVE 1 and 2). LIVE 1 and 2 patients were unstable, whereas LIVE 3, 4, and 5 patients were stable, meaning the majority remained in the same LIVE Score 4 years later. Patients with a high-risk LIVE Score (1 and 2) have a very high mortality, and, if they survive, are likely to recover to a medium risk LIVE Score (LIVE 3). In contrast, patients with a low-risk LIVE Score (LIVE 4 and 5) have very low mortality and are likely to remain low risk with a stable LIVE Score. LIVE, Laboratory-based Intermountain Validated Exacerbation.
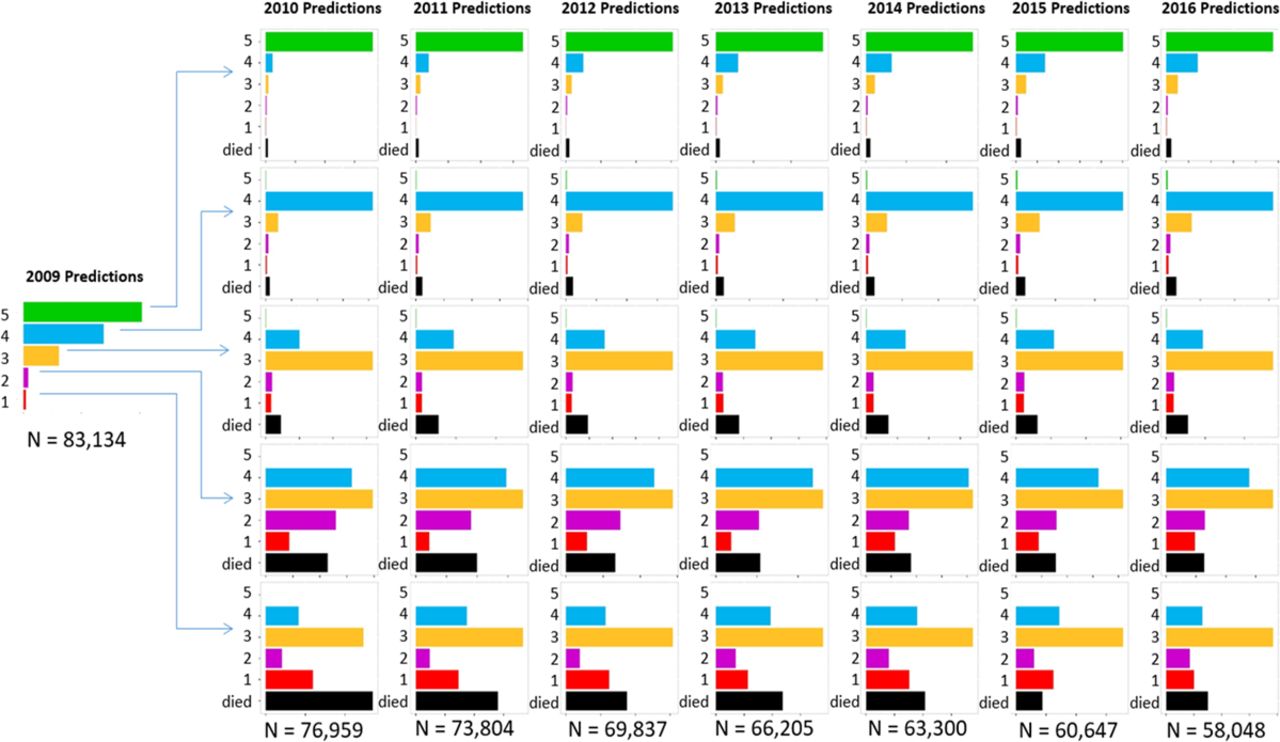
LIVE Score stability National Veterans Affairs Health System. Figure 5 Shows the National Veterans Affairs cohort of 76 799 patients showing that LIVE 1 and 2 Scores were unstable (the vast majority of patients who were LIVE 1 or 2 in the first year did not remain in the same LIVE Score 4 years later). LIVE 3, 4, and 5 Scores had increasing stability.

LIVE Score stability Northwest Kaiser Permanente Health System. Figure 6 LIVE Score stability for the 8513 patients from the Kaiser Permanente cohort are shown with the same pattern. LIVE 1 and 2 Scores were unstable, LIVE 3, 4 and 5 Scores had increasing stability and were stable.

LIVE Score stability University of Chicago Health System. Figure 7. The 867 patients from the University of Chicago cohort follow a similar pattern with instability in LIVE 1 and 2 Scores and stable LIVE 4 and 5 Scores.
The medium-risk LIVE group was unstable: only a minority of survivors (48.1%) remained with a medium risk LIVE group at 4 years (table 4) (figures 4–7). Considering the medium risk LIVE group within each health system, stability varied among health systems ranging from 33% (unstable) at University of Chicago to 67% (stable) at Intermountain Healthcare (figures 4–7, online supplementary table 2A). In all health systems, the medium-risk LIVE group stability was higher than high-risk LIVE group stability, and lower than low-risk LIVE group stability (table 4, figures 4–7, online supplementary table 2A).
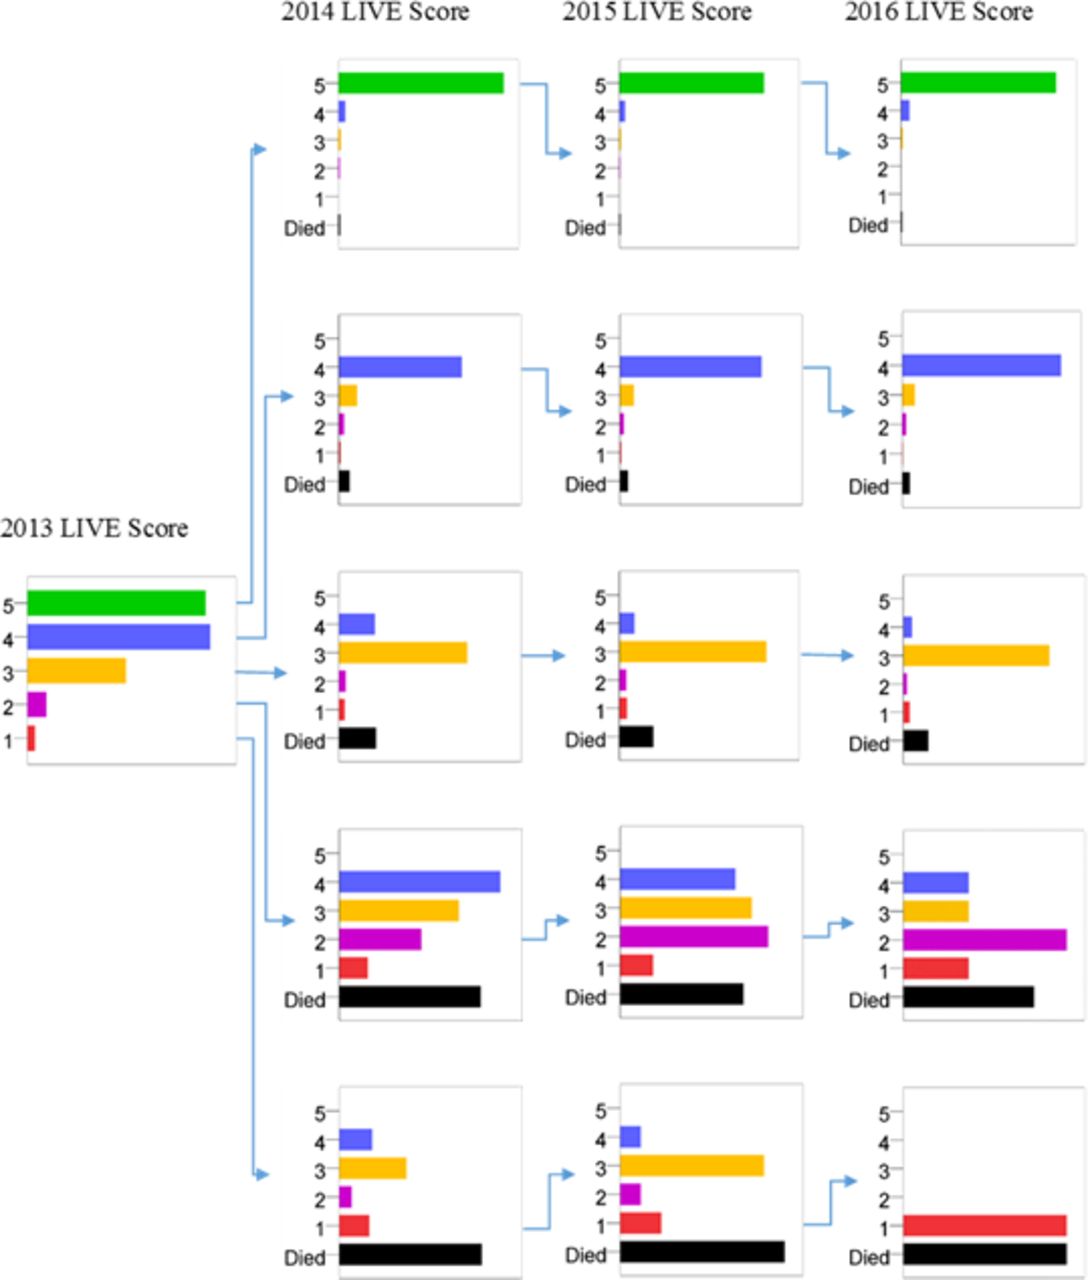
The flow charts of LIVE Scores 1 through 5 over time for the four health systems (figures 4–7) show that patients do not randomly change among LIVE Scores. LIVE Score changes correspond to gradations of risk. For example, no patients in the high-risk LIVE Scores (LIVE 1 and 2) changed to the lowest-risk LIVE Score (LIVE 5). Similarly, almost no patients who were lowest risk (LIVE 5) become highest risk (LIVE 1) in subsequent years. Indeed, very few high-risk LIVE Group (LIVE 1 and 2) patients remain high risk over years. As previously noted, their mortality is very high, but if they survive, they transition to lower-risk LIVE Scores (LIVE 3, and less frequently LIVE 4) (figures 4–7).
Discussion
In a large, multicentre study, we report that the stability of the LIVE Score, a risk stratification score in patients with COPD based on six laboratory variables has variable stability. Furthermore, the LIVE Score stability correlates with mortality and exacerbation frequency, and there is heterogeneity in how these scores impact potential clinical care. For instance, patients in the lowest-risk LIVE Score had low overall mortality and were very likely to remain low risk for at least 4 years. In contrast, more than half of patients with high-risk LIVE Scores died within 4 years;18 high-risk survivors had unstable LIVE Scores that vacillated between medium-risk to high-risk LIVE groups (figures 4–7). These findings translate into pragmatic clinical approaches to triaging resource-intensive interventions using readily available EHR data.
The LIVE Score has important advantages over existing COPD risk-stratification schema. First, the LIVE Score does not depend on symptom scores or lung function testing, which are often not available in current EHR data for the majority of patients. As has been increasingly observed, mortality, healthcare utilisation and functional ability for patients with a COPD diagnosis are significantly influenced by their multimorbidities. There are multiple reasons for the association of COPD disease course with multimorbidity. The association may be due to common risk factors for development of COPD and other morbidities, due to the systemic effects of COPD, due to complications of COPD therapy or a combination of the above. For instance, a major risk factor for the development of COPD is tobacco exposure, which is also a risk factor in the development of cardiovascular disease, lung cancer and osteoporosis, among other comorbidities.3 4 27 28 On the other hand, COPD itself may contribute to the development of cor pulmonale.29 Finally, treatments for COPD may increase the risk of other comorbidities—as in the use of oral steroids for COPD exacerbations and complications of diabetes mellitus.30 Current guidelines on COPD care recommend optimal multimorbidity management.1 However, how to successfully implement guideline recommendations across multimorbidities to improve health outcomes in clinical practice remains unclear.31 The LIVE Score, which incorporates objective evidence of comorbidities, allows for reliable identification of high-risk, medium-risk and low-risk LIVE group cohorts from easily accessible EHR data.
For instance, calculating the LIVE Score using EHR data, systems and providers can readily identify a population of low-risk LIVE group patients with COPD who may require few additional resources. In contrast, annual reassessment of the LIVE Score among patients who initially are in the high-risk LIVE group may inform future interventions among those who survive the initial insult. Interestingly, of the three LIVE risk groups, medium-risk LIVE group patients may represent the most prime group of patients with COPD for targeted multimorbidity interventions.
Medium-risk LIVE group patients have relatively high, stable risk, perhaps affording time for intervention. Components from the LIVE Score may shed some light on useful interventions. For instance, this group of patients typically have anaemia and markers of renal insufficiency, but with normal albumin in the current year (figure 1). Whether more intensive multimorbidity management of this group results in improved all-cause mortality remains unknown. Harnessing the clinical data in the EHR to calculate a LIVE Score and pair an intervention provides the potential for testing this hypothesis efficiently.
Similarly, while high-risk LIVE group patients have high mortality, it is unclear whether the mortality is attributable solely to COPD. The LIVE Score may help identify a high-risk group that requires a targeted, multimorbidity approach. Anaemia, low albumin and low potassium levels may identify patients who are at high risk due to multimorbidity where COPD-specific interventions are less likely to be effective in reducing mortality or healthcare utilisation. Given the lack of stability of the high-risk LIVE group, patients who survive may have their LIVE Scores recalculated to determine appropriate risk assessment as their clinical course evolves.
The reproducibility of LIVE Score stability and risk stratification across cohorts in multiple health systems is likely reflective of the importance of comorbidity on outcomes in patients with COPD. In addition, the reproducibility of routine laboratory measurements obtained through clinical care among institutions is very high, as these objective measurements have less variability than coding patterns among institutions and providers, or other less objective pieces of data. The simplicity and reliance on laboratory values allows for LIVE Score calculations to be done automatically within or outside the EHR, thereby not adding to bedside clinician burden. The ability to query health system data for groups of patients at varying risk profiles allows for design of interventions targeting a personalised population health approach in COPD care.
Thus, these observations set the stage for future work in prospectively identifying high-risk, medium-risk and low-risk LIVE group patients with COPD and targeting them from a health system level through personalised interventions based on individual risk. Interventions using the LIVE Score can account for a patient’s prognosis based on a single diagnosis, namely COPD, and incorporate systematic data in a multimorbidity model for COPD.
Although the use of EHR data to calculate LIVE risk groups is innovative and holds advantages over existing methods, our study has several notable limitations. To date, all work related to developing and validating the LIVE Score has been conducted with retrospective cohorts. Future work using prospective study designs to validate the LIVE Score and its use for clinical care is needed. Second, although the LIVE Score has been validated in over 100 000 patients across four different health systems, it reflects only patients and health systems within USA. Thus, the generalisability of the LIVE Score and its characteristics is uncertain, though its reliance on common laboratory values obtained in routine clinical care makes it likely. An important limitation is the lack of spirometry in these patients, and thus the diagnostic uncertainty of the COPD diagnosis. The relatively low rate of spirometry in these cohorts may be due to the fact that spirometry was not done at all, or that it was done at outpatient clinics and offices outside the integrated health records of the clinics, or that the data from PFTs were not encoded and queryable (eg, scanned in paper-faxed files in the record). While this lack of spirometry is an important limitation of our work, it also is reflective of the current clinical environment of COPD care. Finally, although the LIVE Score is robust in identifying all-cause mortality and COPD exacerbation risk, what specific interventions, if any, might modify those risks remains unclear. The variables used to calculate the LIVE Score are likely markers of comorbidity and illness and in themselves may not be amenable to targeted therapy. The utility of the LIVE Score is likely as a structured assessment of comorbidity risk in patients with COPD, which may inform whether therapies aimed at COPD, comorbidities or both are likely to have the highest impact. Further work on how to best use the LIVE Score to improve interventions in patients with COPD is needed.
In summary, the LIVE Score identifies three major clinically actionable cohorts. A stable low-risk LIVE Group, an unstable high-risk LIVE group associated with high mortality rates, and a third medium-risk LIVE group in between. These observations further our understanding of how existing EHR data used to calculate the LIVE Score may help to target interventions across risk cohorts of patients with COPD in a health system.
Acknowledgments
The authors thank Dr Michael Lanspa for a careful reading of this manuscript.
References
Footnotes
Twitter @vgpress13
Contributors All authors have made substantial contributions to the conception and design of the work, drafting and revisions of the manuscript for important intellectual content, final approval for publication and agree to be accountable for all aspects of the work in ensuring that questions related to the accuracy or integrity of any part of the work are appropriately investigated and resolved. In addition, SR, SZ, RM and KAC have provided data acquisition. DSC, SR, SZ, KAC, VP, DPB, MA and RM have provided data analysis and interpretation.
Funding This work was funded, in part, by the Intermountain Foundation. MA and SZ were supported by a grant from the Flight Attendant Medical Research Institute.
Competing interests DPB has participated in sponsored research, which has yielded publications in various forms at Intermountain Healthcare with the following companies: AstraZeneca, GlaxoSmithKline, Zebra Medical, and Prolung. VP has consulted for Edifices/Round Glass related to the need for and methods to address respiratory inhaler technique training, contributes to an asthma quality of care study funded by Novartis, is a subject matter expert for Vizient, and is currently supported on an NIH NHLBI R03 award (R03HL144883). MA receives salary support from the Department of Veterans Affairs. RM and the analytic group at Kaiser Permanente Center for Health Research had financial support in part from the Intermountain Foundation for data acquisition and analysis but otherwise no conflict relevant to this manuscript. RM has participated in sponsored research in COPD funded by GlaxoSmithKline, Spiration Inc, and Novartis. He has funding from PCORI as co-PI to lead the COPD Foundation Patient-Powered Research Network (PPRN).
Patient consent for publication Not required.
Ethics approval Institutional Review Boards (IRBs) at Intermountain Healthcare (IRB: 1040370), the University of California San Francisco and the San Francisco Veterans Affairs Medical Center Research and Development Committee (IRB: 15–16660), the Kaiser Permanente Northwest Research Center (IRB: STUDY00000759), and the University of Chicago Medicine (IRB: 17–0332).
Provenance and peer review Not commissioned; externally peer reviewed.
Data availability statement Data may be obtained from a third party and are not publicly available. Data Sharing Requests: In order to protect patient privacy and comply with relevant regulations, identified data are unavailable. Requests for de-identified data from qualified researchers with appropriate ethics board approvals and relevant data use agreements will be processed by the Intermountain Office of Research, officeofresearch@imail.org.