Article Text

Abstract
Background To identify metabolic biomarkers that can be used to differentiate sepsis from systemic inflammatory response syndrome (SIRS), assess severity and predict outcomes.
Methods 65 patients were involved in this study, including 35 patients with sepsis, 15 patients with SIRS and 15 normal patients. Small metabolites that were present in patient serum samples were measured by liquid chromatography mass spectrometry techniques and analysed using multivariate statistical methods.
Results The metabolic profiling of normal patients and patients with SIRS or sepsis was markedly different. A significant decrease in the levels of lactitol dehydrate and S-phenyl-d-cysteine and an increase in the levels of S-(3-methylbutanoyl)-dihydrolipoamide-E and N-nonanoyl glycine were observed in patients with sepsis in comparison to patients with SIRS (p<0.05). Patients with severe sepsis and septic shock displayed lower levels of glyceryl-phosphoryl-ethanolamine, Ne, Ne dimethyllysine, phenylacetamide and d-cysteine (p<0.05) in their sera. The profiles of patients with sepsis 48 h before death illustrated an obvious state of metabolic disorder, such that S-(3-methylbutanoyl)-dihydrolipoamide-E, phosphatidylglycerol (22:2 (13Z, 16Z)/0:0), glycerophosphocholine and S-succinyl glutathione were significantly decreased (p<0.05). The receiver operating characteristic curve of the differential expression of these metabolites was also performed.
Conclusions The body produces significant evidence of metabolic disorder during SIRS or sepsis. Seven metabolites may potentially be used to diagnose sepsis.
Trial registration number ClinicalTrial.gov identifier NCT01649440.
- Respiratory Infection
This is an Open Access article distributed in accordance with the Creative Commons Attribution Non Commercial (CC BY-NC 4.0) license, which permits others to distribute, remix, adapt, build upon this work non-commercially, and license their derivative works on different terms, provided the original work is properly cited and the use is non-commercial. See: http://creativecommons.org/licenses/by-nc/4.0/
Statistics from Altmetric.com
Key messages
-
The body produces significant evidence of metabolic disorder during systemic inflammatory response syndrome (SIRS) or sepsis.
-
S-(3-methylbutanoyl)-dihydrolipoamide-E, lactitol dehydrate, N-nonanoyl-glycine and S-phenyl-d-cysteine may differentiate sepsis from SIRS.
-
2-Phenylacetamide, Ne, Ne dimethyllysine, glyceryl-phosphoryl-ethanolamine and d-cysteine may change significantly when severe sepsis occurs.
-
PG (22:2(13Z,16Z)/0:0), S-(3-methylbutanoyl)-dihydrolipoamide-E, S-succinyl glutathione and glycerophosphocholine may reflect the possibility of death of critically ill patients with sepsis.
-
Metabolomics provides a new way to explore the diagnosis and mechanism of sepsis, which may contribute to a reduction in the mortality of critically ill patients in the intensive care unit.
Background
Sepsis is a whole-body inflammatory state that is caused by infection, which can threaten or reduce the quality of life. It is important to control sepsis progression within the shortest amount of time, to make an accurate diagnosis, and to choose the right treatment measures. However, the definition of sepsis and the use of sepsis biomarkers in the management of patients with sepsis remain limited.1 Thus, there is an urgent medical need for new techniques and platforms for the identification and validation of reliable biomarkers of sepsis.
Metabolic dysfunction has been reported to be a key feature in the development and response to sepsis.2–4 Although genomics, transcriptomics and proteomics have been used in many studies of sepsis, these results do not directly reflect the changes in metabolism that take place during sepsis. Only the metabolome can reveal the final downstream products that result from the preceding gene and protein expression.5 Furthermore, the development of high-throughput technologies and systems biology theory has resulted in the realisation that complex biological and natural phenomena cannot be sufficiently explained by only one X-omic technology. The construction of top-down systems biology models may become a future cutting-edge technique that can explain pathogenesis and molecular features in the field of critical care medicine.6 In this study, metabolic differences between serum samples from patients with sepsis, patients with systemic inflammatory response syndrome (SIRS), and healthy controls were analysed using Liquid chromatography mass spectrometry (LC-MS/MS) metabolomics techniques. The patients with sepsis were further divided into many subgroups, including sepsis, severe sepsis and death, to screen for potential metabolic biomarkers of sepsis during these different stages of disease.
Methods
Subjects
The study samples came from our sepsis biological specimen bank of the Respiratory Disease Department, Chinese People's Liberation Army (PLA) General Hospital. All the samples selected from inpatients who were hospitalised between July 2010 and March 2012 in the respiratory intensive care unit (ICU), emergency ICU and critical care medicine departments. In the light of the 2001 International Sepsis Definition Conference7 and the advanced diagnostic criteria from 2008,8 patients who exhibited two or more signs of SIRS and had a confirmed infection during their first 24 h stay in the ICU were eligible for selection. Based on the severity of the patients’ conditions, the patients were further subdivided into a sepsis group and a severe sepsis group (participants with severe sepsis and septic shock). To identify metabolic disorders before death, the death group was defined as patients with sepsis who would be dead within 48 h. In addition, 15 patients who had two or more signs of SIRS and a negative pathological examination within 24 h ICU admission were selected for inclusion in the SIRS group. The exclusion standards included the following factors: (1) younger than 18 years of age; (2) parenteral nutrition within 48 h after ICU admission; (3) diabetes and other metabolic-related diseases; (4) chronic liver disease; (5) AIDS; (6) reduced polymorphonuclear granulocyte count (<500 μL-1); (7) refusal to participate in the study. We also obtained serum samples from healthy volunteers to generate a set of reference metabolite values using the same MS platform. For the healthy control group, the possibility of an acute or past chronic disease was used to exclude certain patients. In addition, the healthy control participants included patients who had not been hospitalised or taken any drugs in the past 12 months and were shown to be normal in physical check-ups and lab examinations. All ongoing and related trials for this study are registered. Patients or their family members were fully informed of the study and signed informed consent forms of their own accord before this experiment.
Serum sample collection and preparation
Blood samples were acquired by direct venipuncture from healthy patients and patients with SIRS, sepsis and severe sepsis in the morning within 24 h of ICU admission. For the death group, the blood samples were obtained within 48 h before death. After the blood was drawn, it was placed on ice for at least an hour and then centrifuged at 3000 rpm for 15 min. The supernatants were collected to Eppendorf tubes.
For LC-MS/MS analysis, 200 µL of serum and 37 µL of glycine-1–13C were extracted with 500 µL of methanol. After centrifugation at 15 000 rpm for 15 min, the supernatant was transferred to an auto-sampler vial. Chromatographic separations were performed on a 2.1 mm i.d. 100 mm Acquity HPLC BEH C18 3.5 µm column (Waters, USA) using an HPLC system consisting of a binary pump, temperature-controlled autosampler and column oven (Shimadzu, Japan). The column was maintained at 45°C and eluted with a linear gradient of 3–100% of solution B, where solution A is water with 0.1% formic acid and solution B is methanol with 0.1% formic acid. The duration of the gradient programme was 0–2 min, 3% solution B; 2–9 min, 3–100% solution B; 9–17 min wash with 100% solution B; and a 5 min recycle time at a flow rate of 200 µL/min. Ten-microlitre aliquots of the sample were loaded. The column eluent was analysed with an LTQ Orbitrap Velos mass spectrometer (Thermo Fisher Scientific, Waltham, Massachusetts, USA) using positive ion electrospray ionisation.
LC-MS/MS analysis
Mass spectrometry was performed on an LTQ Orbitrap Velos mass spectrometer (Bruker, German) that was operating in the positive ion mode because the total ion chromatographs were more stable and because the signals of the profiled ions were stronger in the positive ion mode than in the negative mode during the instrument operations. The desolvation gas was set to 500 L/h at a temperature of 350°C. The cone gas was set to 25 L/h, and the source temperature was set to 120°C. The capillary and cone voltages were set to 3000 and 30 V, respectively. The Orbitrap was operated with an alternating collision energy of 6 eV. The data acquisition rate was set to 0.4 s with a 0.1 s interscan delay. All analyses were acquired using the lock spray to ensure accuracy and reproducibility. Leucine enkephalin was used as the lock mass (m/z 554.2615) at a concentration of 50 fmol/mL and a flow rate of 5 µL/min. Data were collected in continuum mode. The lockspray frequency was set at 10 s, and data were averaged over 10 scans.
Multivariate pattern recognition analysis and statistical analysis
Multivariate pattern recognition analyses were commonly used in the metabolomics analysis process. A non-supervised principal component analysis (PCA) model was constructed to determine the distributions and separations between the different groups.9 Before PCA, all the MS data variables were mean centred and Pareto-scaled by using XCMS software.10 The resulting data matrix was produced with associated retention time and accurate mass and chromatographic peak area calculated with a single accurate mass. Then the MS data were further processed using a partial least squares to discriminant analysis (PLS-DA)11 and an orthogonal partial least squares to discriminant analysis (OPLS-DA).12 For each metabolite peak reproducibly detected in whole samples, the non-parametric univariate method, Mann-Whitney-Wilcoxon test, was applied to measure the significance of each metabolite among the different sample groups, with results adjusted for multiple testing using the false discovery rate correction. The PLS-DA or OPLS model was constructed using the MS data as the X variable and the class information identifier as the Y variable. Furthermore, the pathological differences in the samples can be visualised in score plots, and the variable influence on projection (VIP) values for the metabolites that were responsible for the differences could be statistically identified with loading plots. Furthermore, the metabolites which the VIP values were above 2 should be used to search the metabolomics databases to make sure which metabolites were. Multivariate pattern recognition analyses and MS data were carried out using R software (V.2.13.2; http://www.r-project.org/). In addition, SPSS V.16.0 (SPSS Inc, Armonk, New York, USA) was used for the statistical analyses, and a two-tailed p<0.05 was considered significant.
Results
Subject groups
This study included a total of 65 participants who were selected from 301 people based on the relevant criteria (see online supplementary figure S1). Among these participants, there were 15 normal control patients, 15 cases of SIRS, 10 cases of sepsis, 16 cases of severe sepsis and 9 cases of death. Table 1 gives the general characteristics of the participants involved in this study. Based on whether the patient had an infection, the temperature, the CRP, PCT and BUN levels, and the APACHE II score of the sepsis group were higher than those of the SIRS group (p<0.05). There were no obvious differences between the sepsis and SIRS groups with regard to age, gender, WCC counts, SCr and predisposing factors. Furthermore, patients with sepsis were further subdivided into a sepsis group, a severe sepsis group and a death group. Among all the parameters, there were only differences in score systems between the groups that have statistical significance (p<0.05). The death group had higher APACHE II scores than the sepsis and severe sepsis groups (p<0.05). Although the severe sepsis group had a higher score than the sepsis group, the difference was not statistically significant. The SOFA score in the death group was higher than those in the other two groups, but only the difference between the death and sepsis groups was statistically significant (p<0.05).
Demographics of the enrolled patients in this metabolomics pilot study
Multivariate analysis
Inspection of the LC-MS/MS spectra revealed a wide variety of metabolites that were present in the spectra. Representative LC-MS/MS spectra of the serum samples from the participants with sepsis and SIRS and normal participants are shown in figure 1.

Typical liquid chromatography–mass spectrometry spectra of sera from patients with sepsis (A) or systemic inflammatory response syndrome (SIRS) (B) and normal patients (C). Significant differences existed between the sepsis, SIRS and normal groups. The metabolites that could distinguish among the sepsis, SIRS and normal groups were primarily concentrated in the 7–10 min period. The sepsis and SIRS groups had a higher response. For example, the response in the sepsis group was approximately fivefold higher than that in the SIRS group, and the response in the SIRS group was approximately twofold higher than that in the normal group.
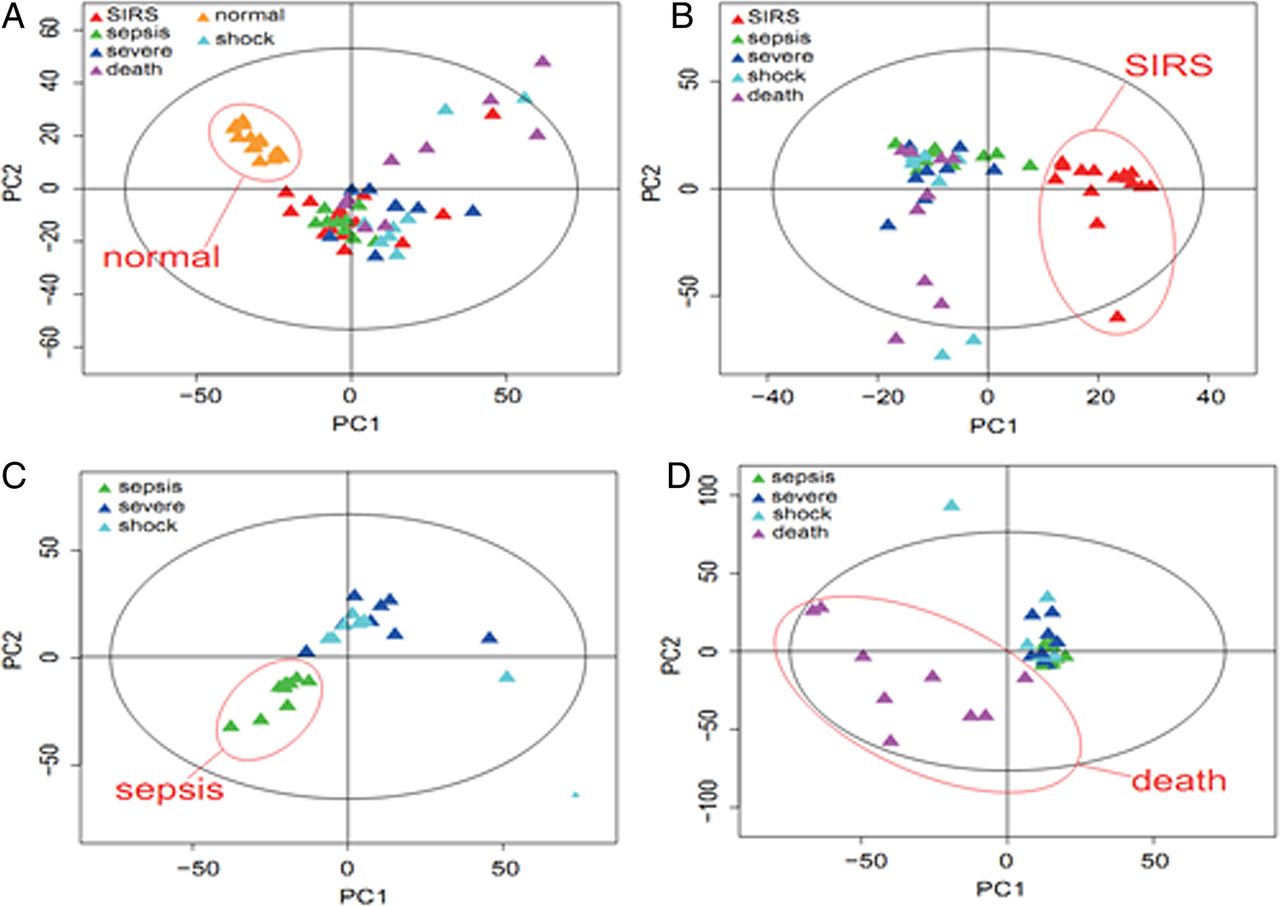
Based on the PCA score plot, the normal group, SIRS and sepsis groups were clearly classified (figure 2A). Furthermore, the metabolome differences between the SIRS and sepsis (sepsis+severe+shock+death) groups could be distinguished in the OPLS-DA score plot (figure 2B). The PLS-DA scores indicated that the sepsis/severe+shock (figure 2C) and death/sepsis+severe+shock groups could be distinguished from one another (figure 2D).

Pattern recognition analyses of serum liquid chromatography–mass spectrometry (LC-MS/MS) spectra. LC-MS/MS spectra from the normal, systemic inflammatory response syndrome , sepsis, severe sepsis and death groups using principal component analysis (A), orthogonal partial least squares to discriminant analysis (B), partial least squares to discriminant analysis (C and D).
Identification of potential biomarkers
The combination of high-resolution LTQ Orbitrap mass spectrometry and multivariate analysis permitted the identification of unknown endogenous metabolites. The significant variables in each of the PLS-DA and OPLS-DA models were selected for biomarker prediction. First, we obtained information about the predicted potential biomarkers that corresponded to the exact molecular mass data (m/z) from significant peaks provided from high-resolution LTQ Orbitrap mass spectrometry by searching the Metlin database (http://metlin.scripps.edu) and HMDB database (http://www.hmdb.ca). A metabolite name was reported when a mass difference between the observed and theoretical mass was <10 ppm. Second, we identified the differential RT–m/z pairs between each of the two groups by matching the tandem MS fragmentation patterns with the reference standards and the database. Since there were a number of significant variables in each OPLS loading, we chose the top 20 significant ions (according to the VIP value) in each PLS-DA loading plot or OPLS S-plot for further MS/MS structure analysis. Third, the p values and fold-changes were considered to be objective indicators of metabolite expression. Twelve metabolites were ultimately identified as potential biomarkers of sepsis, disease severity and death (table 2 and figure 3).
Metabolite differences that were identified between the different groups

The significantly different metabolites between the systemic inflammatory response syndrome SIRS (n=15) and sepsis (n=35) groups (A); the sepsis (n=10) and severe sepsis (n=25) groups (B); the sepsis (n=26) and death (n=9) groups (C). Y-axis is labelled as logarithmic.
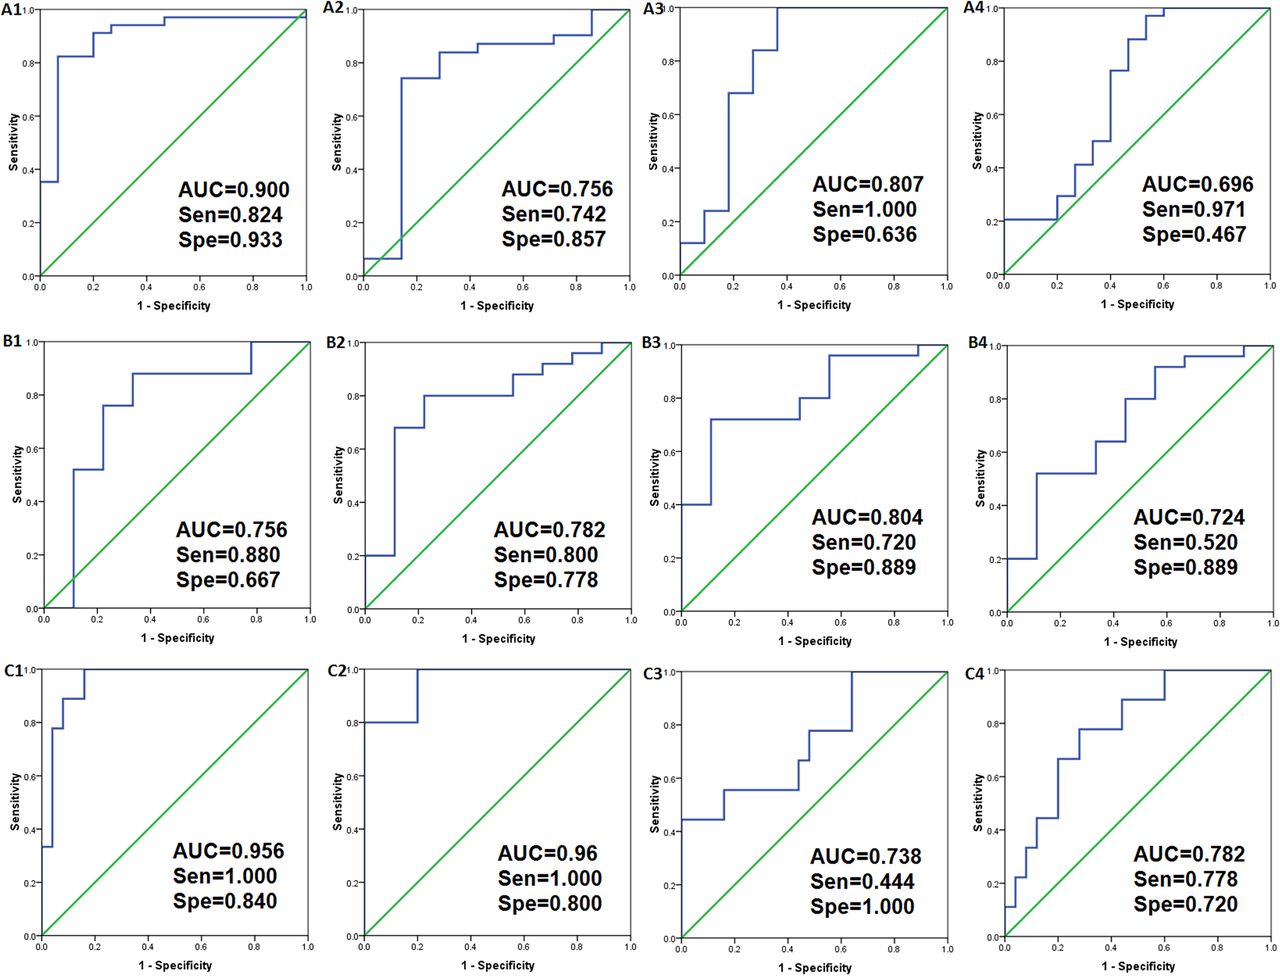
Diagnostic performance of potential biomarkers
The receiver operating characteristic curves denoting the roles of the various indicators, including sepsis diagnosis, sepsis severity and death, were then determined (figure 4). Based on the differences in the metabolites that were identified, the diagnostic performance of each of the potential biomarkers was calculated. The AUCs of the four indicators that reflected infection (S-(3-methylbutanoyl)-dihydrolipoamide-E, lactitol dehydrate, N-nonanoyl-glycine and S-phenyl-d-cysteine) were determined to be 0.9 (95% CI 0.799 to 1.001), 0.807 (95% CI 0.616 to 0.998), 0.756 (95% CI 0.523 to 0.988) and 0.696 (95% CI 0.515 to 0.877), respectively, (figure 4A). For the indicators that reflected the severity of sepsis (2-Phenylacetamide, Ne, Ne dimethyllysine, glyceryl-phosphoryl-ethanolamine and d-cysteine), the AUCs were determined to be 0.804 (95% CI 0.647 to 0.962), 0.782 (95% CI 0.602 to 0.962), 0.756 (95% CI 0.541 to 0.970) and 0.724 (95% CI 0.528 to 0.921), respectively (figure 4B). For the indicators that reflected death (PG (22:2(13Z,16Z)/0:0), S-(3-methylbutanoyl)-dihydrolipoamide-E, S-succinyl glutathione and glycerophosphocholine), the AUCs were determined to be 0.96 (95% CI 0.863 to 1.057), 0.956 (95% CI 0.891 to 1.021), 0.782 (95% CI 0.620 to 0.945) and 0.738 (95% CI 0.539 to 0.936), respectively (figure 4C).
Receiver operating characteristic curves (ROC) for the metabolites between the systemic inflammatory response syndrome (n=15) and sepsis (n=35) groups (A); the sepsis (n=10) and severe sepsis (n=25) groups (B); the sepsis (n=26) and death (n=9) groups (C). AUC indicates the area under the curve.
Discussion
Improvements in systems biology theory and the development of metabolomics technologies have led to the recognition of the significance of metabolomics to clinical work in the field of critical care medicine.6 ,13 Many previous metabolomics experiments in animals have shown that metabolite profiles change dramatically and that small molecule metabolites can be used to identify infections and assess prognosis.14–17 However, clinical trials of metabolomics in sepsis have been limited. Our study used LC-MS/MS methods to screen serum biomarkers of the different stages of sepsis. We found that metabolite profiling was altered significantly in patients with SIRS in comparison with healthy control patients (figure 2A). The metabolomics approach could reflect changes in the metabolic state of the different stages of sepsis (figures 2B–D). Based on the bioinformatics analyses, 12 metabolites were ultimately identified as potential biomarkers of sepsis, disease severity and death.
An nuclear MR-based metabolomics study explored systemic metabolic changes in traumatic, critically ill patients and found that carbohydrate and amino acid levels were changed in the early SIRS stage.18 A targeted metabolomics study used LC-MS/MS to reveal that lipid compounds (acylcarnitines and glycerophosphatidylcholines) may be helpful for differentiating infection, and that identified lipid compounds may become promising candidate biomarkers.19 Stringer et al20 found four metabolites that could distinguish sepsis-induced acute lung injury from healthy controls, and these metabolites showed significant correlations with acute physiology scores. We found a sharp increase in S-(3-methylbutanoyl)-dihydrolipoamide-E and N-nonanoyl-glycine and significant decreases in lactitol dehydrate and S-phenyl-d-cysteine (table 2). S-(3-methylbutanoyl)-dihydrolipoamide-E participates in the degradation of valine, leucine and isoleucine and in the synthesis of branched chain fatty acids. Valine, leucine and isoleucine are classified as branched-chain amino acids (BCAAs), and they play regulatory roles in protein metabolism. Both animal experiments and clinical studies have shown that the concentrations of BCAAs are reduced during sepsis.21 ,22 We conclude that S-(3-methylbutanoyl)-dihydrolipoamide-E may play an important role in this pathway process. Moreover, it has been reported that severe disorders in amino acid metabolism commonly occur in critically ill patients.23 ,24 Although we were not able to obtain sufficient previous literature about N-nonanoyl-glycine and S-phenyl-d-cysteine, the trends in the upregulation and downregulation of their expression indirectly indicate metabolic changes in glycine and cysteine. In addition, a recent study has suggested that hydrophilic metabolites may provide an early signature of sepsis even prior to the onset of clinical symptoms.25 Lactitol dehydrate identified here is a hydrophilic carbohydrate metabolite, which supported this viewpoint. ROC curves were employed to evaluate the diagnostic efficiency of four selected biomarkers. Lactitol dehydrate showed the highest sensitivity, while S-(3-methylbutanoyl)-dihydrolipoamide-E had the highest specificity.
When the body is subjected to various pathological or physiological stimuli, changes in metabolic profiles may indicate the state of a disease or its severity.26–28 All these factors, including elevated body temperature, tissue hypoxia, changes in the internal and external environment, inflammatory cytokine production and abnormal levels of reactive oxygen species and hormones significantly affect the expression levels and activities of metabolic enzymes, which contribute to metabolic disorders in carbohydrates, proteins, fatty acids and nucleic acids. We speculate that some of the metabolites may reflect the severity of sepsis. In the present study, we found four metabolites that showed a significant downward trend. Glyceryl-phosphoryl-ethanolamine is a characteristic property of anticoagulation activity.29 We hypothesise that it was reduced due to coagulation disorders and vascular endothelial dysfunction during severe sepsis. Ne, Ne dimethyllysine mediated the response to oxidative stress30 and participated in the histone modification and gene regulation.31 Based on the human metabolome database (HMDB), 2-phenylacetamide is an intermediate in phenylalanine metabolism. Changes in 2-phenylacetamide and d-cysteine indicated the existence of an amino acid metabolism disorder. Based on ROC analyses, the sensitivities of glyceryl-phosphoryl-ethanolamine, 2-phenylacetamide and d-cysteine were higher.
Similarly, the metabolomics approach can also be used to evaluate the prognosis of sepsis. Mickiewicz et al32 screened a list of potentially important metabolites that could be used for diagnosis and the prediction of mortality in septic shock in a paediatric population. Seymour et al30 found that the global metabolomic profile is broadly different between survivors and non-survivors who were hospitalised with pneumonia and sepsis. It has also been reported that significant disturbances in fat metabolism are found in multiple organ dysfunction syndrome (MODS) and in cases with a poor prognosis.3 ,18 We identified four metabolites that were elevated within the 48 h prior to death. S-(3-methylbutanoyl)-dihydrolipoamide-E appeared again during this stage, which suggested severe metabolic disorders of BCAA and fatty acid synthesis. The elevated serum levels of PG (22:2(13Z, 16Z)/0:0) may be attributed to high concentrations of lipoproteins.19 The HMDB indicates that glycerophosphocholine is involved in signal transduction, glycerophospholipid metabolism, prostaglandin and leukotriene metabolism, and energy storage and consumption. However, its specific mechanism in sepsis is not known. The increased S-succinyl-glutathione concentration most likely resulted from oxidative stress. Our findings have some similarity with the recent study by Langley et al33, which also demonstrated that the different profiles of metabolites clustered into fatty acid transport and β-oxidation, gluconeogenesis and the citric acid cycle. According to the ROC curve, S-(3-methylbutanoyl)-dihydrolipoamide-E and PG (22:2(13Z, 16Z)/0:0) had higher sensitivities, while glycerophosphocholine had the highest specificity in the assessment of prognosis. These compounds may become potential metabolic biomarkers of sepsis.
This study has certain limitations. The limited sample size of this study included only 35 cases of patients with sepsis. In accordance with different prognoses, we found that the sulfur-containing amino acid concentrations of the non-survivor group were significantly lower than those of the survivor group at all time points, but the differences were not statistically significant at certain time points. One explanation for the lack of statistical significance could be the heterogeneity among the patients with sepsis, which then led to many different metabolic disorders. It would be necessary to use a larger sample size to validate our conclusions, particularly in view of the multiple comparisons performed in our study. Additionally, the study of sepsis metabolomics in patients with diabetes and the inclusion of lactate as a biomarker would each be worthy of future research.
Conclusion
Metabolomics studies are important for use in the diagnosis and treatment of critically ill patients. This study explored the different stages of the sepsis process using LC-MS/MS. Some potential molecule metabolites we found in this study and their relevant pathway may become valuable clues and research focus in the intensive care medicine in the future.
References
Supplementary materials
Supplementary Data
This web only file has been produced by the BMJ Publishing Group from an electronic file supplied by the author(s) and has not been edited for content.
Files in this Data Supplement:
- Data supplement 1 - Online figure
Footnotes
LS, YH and YZ contributed equally.
-
Contributors LS and LX conceived and designed the project. LX, RW, KX and CL were involved in data collection. YH, LC, NM, HL, HW and PY conducted the experiments. LS, YZ, YH and BW took part in bioinformation analysis. LS, YH and XL were involved in writing the manuscript. All the authors read and approved the final manuscript.
-
Funding The work was supported by the general programme of the National Natural Science Foundation of China (81370103) and the General Programme “Twelfth Five-Year” Key Project of Chinese PLA (No CWSJ130).
-
Competing interests None.
-
Ethics approval This study obtained approval from the Ethics Committee of the Chinese PLA General Hospital (project No. CPLAGH-2012023).
-
Provenance and peer review Not commissioned; externally peer reviewed.
-
Data sharing statement No additional data are available.