Article Text

Abstract
Introduction Ventilation parameter data from patients receiving home mechanical ventilation can be collected via secure data cards and modem technology. This can then be reviewed by clinicians and ventilator prescriptions adjusted. Typically available measures include tidal volume (VT), leak, respiratory rate, minute ventilation, patient triggered breaths, achieved pressures and patient compliance. This study aimed to assess the potential impact of ventilator data downloads on management of patients requiring home non-invasive ventilation (NIV).
Methods A longitudinal within-group design with repeated measurements was used. Baseline ventilator data were downloaded, reviewed and adjustments made to optimise ventilation. Leak, VT and compliance data were collected for comparison at the first review and 3–7 weeks later. Ventilator data were monitored and amended remotely via a modem by a consultant physiotherapist between the first review and second appointment.
Results Analysis of data from 52 patients showed increased patient compliance (% days used >4 hours) from 90% to 96% (p=0.007), increased usage from 6.53 to 6.94 hours (p=0.211) and a change in VT(9.4 vs 8.7 mL/kg/ideal body weight, p=0.022). There was no change in leak following review of NIV prescriptions (mean (SD): 43 (23.4) L/min vs 45 (19.9)L/min, p=0.272).
Conclusion Ventilator data downloads, via early remote assessment, can help optimise patient ventilation through identification of modifiable factors, in particular interface leak and ventilator prescriptions. However, a prospective study is required to assess whether using ventilator data downloads provides value in terms of patient outcomes and cost-effectiveness. The presented data will help to inform the design of such a study.
- Non-invasive Ventilation
- Software
- Technology
This is an Open Access article distributed in accordance with the Creative Commons Attribution Non Commercial (CC BY-NC 4.0) license, which permits others to distribute, remix, adapt, build upon this work non-commercially, and license their derivative works on different terms, provided the original work is properly cited and the use is non-commercial. See: http://creativecommons.org/licenses/by-nc/4.0/
Statistics from Altmetric.com
Key messages
Ventilator data downloads facilitate optimisation of delivery of domiciliary NIV.
Ventilator data downloads can facilitate early, objective assessment of ventilator prescriptions and leak.
Ventilator data downloads can facilitate outpatient setups and are a useful interventional adjunct in the clinicians’ toolbox.
Introduction
Domiciliary non-invasive ventilation (NIV) is accepted as standard care for patients with chronic hypercapnic ventilatory failure.1 2 The efficacy of domiciliary NIV is dependent on optimal ventilator support and the correct interface to optimise ventilation and minimise side effects.3–5
In keeping with healthcare policies of providing high quality and cost-effective care in the community,6 both numbers of people receiving and services delivering domiciliary NIV are increasing.7–9 Traditionally, people undergo an inpatient admission for initiation of domiciliary NIV. With changing service models, more people are now being commenced on domiciliary NIV systems in outpatient or community settings. This has been shown to be as clinically effective as inpatient set-up in the neuromuscular disease (NMD) population10; cost effectiveness within the obese population is currently being assessed.11 Improved patient experience, alongside reduced costs are other proposed benefits of outpatient initialisation of domiciliary NIV.11 Nevertheless, a concern remains that domiciliary NIV outpatient set-up reduces the capacity for monitoring and assessing patients in comparison with bedside monitoring and the use of traditional tools such as transcutaneous CO2 monitoring and arterial blood gases (ABGs).10 Janssens et al12 argue that ventilator data downloaded into specific software can be used as an alternative to support clinical decision-making in the successful management of domiciliary NIV. The use of ventilator data downloads may therefore help promote the wider use of outpatient set-up for home NIV; indeed ventilator download data, transmitted via a modem, can be described as a form of telemedicine.13
Data are available by both Secure Data (SD) card download and via modem technology, which means this data can be viewed remotely on a daily basis. Bench studies have demonstrated ventilator data parameters provided in manufacturers’ software are reliable14 15 and clinical studies have demonstrated the apnoea hypnoea index recorded by built in software is also reliable.16 Most recently, Borel et al17 demonstrated that ventilator download data, particularly respiratory rate, trigger % and usage, can predict an exacerbation of chronic obstructive pulmonary disease (COPD).
To date, there is minimal evidence for using data downloads in the assessment, treatment and management of people receiving domiciliary NIV.12 17–19 The European Respiratory Society task force has called for further research in the area.13 Therefore, this study aimed to assess the impact of using ventilator data downloads in the management of people with chronic hypercapnic ventilatory failure receiving domiciliary NIV.
Specifically, this study assessed the impact of ventilator data downloads on:
Tidal volumes (VT);
The incidence of large leaks and interface issues;
Individual compliance with domiciliary NIV;
The incidence of continued hypercapnia (partial pressure of carbon dioxide (PaCO2 >6 kPa).
Methods
Ethics
After discussion with the research and development department, it was deemed that ethical approval was not required for this study as all data were anonymous and collected as part of routine practice. Participants completed a data protection consent form for the installation of a modem. The study was registered with the trust’s audit and governance department.
Study design and participants
A longitudinal within-group repeated measures study design was used. All adult patients with chronic hypercapnic ventilatory failure receiving care under a domiciliary NIV service at the Royal Free London National Health Service (NHS) Foundation Trust were eligible for study inclusion. All patients were offered a review appointment between December 2014 and April 2015 and followed up by June 2015. Participants were excluded when they died during the study period, had their care transferred to another provider or declined to attend a review appointment.
Procedure
Prior to the review appointment, all patients had been managed with clinical assessment, including symptoms and PaCO2 measurements obtained via Capillary Blood Gas (CBG); data from the patients’ ventilators had not been used as part of their clinical management. The purpose of the review appointment was to:
Exchange the participants’ current home ventilator for a new model which was fitted with a modem.
Use the ventilator data downloads to ensure optimal ventilation had been achieved, aiming for VT of 8–10 mL/kg of ideal body weight.
Review participants’ interface via the leak measurement on the ventilator data download to ensure minimisation of both leak and side effects. Interfaces were changed or resized where participants had a leak of >60 L/min (as per manufacturer’s guidance).
Ensure participants and carers had received verbal and written patient information leaflets regarding their condition, use, care of and maintenance of their ventilator, interface and accessories.
Participants with VT <6 mL/kg of ideal body weight or >10 mL/kg of ideal body weight were optimised through the use of a Philips Respironics A40 ventilator (Philips Respironics, Murraysville, USA) utilising Average Volume Assured Pressure Support/Average Volume Assured Pressure Support-Auto Expiratory Positive Airway Pressure (AVAPS/AVAPS-AE) mode and employing a titration approach.11 In this study, the titration approach involved using AVAPS-AE mode over 4–6 weeks to evaluate the NIV prescription required by each participant.
All participants were monitored via the modem technology and EncoreAnywhere (Philips Respironics) system to measure and ensure:
optimal ventilation, aiming for 8–10 mL/kg of ideal body weight;
minimal leak;
minimal side effects;
optimal compliance, aiming for >4 hours/night for 70% of nights.
Data from the modems were reviewed by a consultant physiotherapist routinely twice weekly and when patients contacted the service. Participants were invited to a follow-up appointment on average 6 weeks post initial review appointment depending on appointment and patient availability. The purpose of this visit was to:
Provide an appropriate ventilator for participants who required retitration: Philips Respironics A40, A30 or BiPAP ST (Philips Respironics).
Ensure optimal ventilation had been achieved: aiming for VT of 8–10 mL/kg of ideal body weight.
Ensure interface was optimised to minimise both leak and side effects.
Review patient compliance.
Outcome measures
Ventilator data and PaCO2 were collected by clinicians with appropriate skills and knowledge in domiciliary NIV but who had not provided care for the study participants.
NIV data
Data were collected at the initial review appointment to act as the historical control for the cohort and further at the follow-up appointment 3–7 weeks later. Ventilator parameter data were collected via SD cards and subsequently modems to measure the following study outcomes: ventilator prescription, leak, VT (average over last 7 days of the data collection period) and compliance assessed as percentage of days NIV used >4 hours in the previous 28 days and average hours/day of NIV on days NIV was used.
Capillary blood gas
PaCO2 were obtained by trained clinicians via CBGs. CBGs were analysed on a RAPIDPoint 500 blood gas system (Siemens, UK). Where CBGs had been undertaken as part of the participant’s normal care within 1 month, and there had been no clinical change in the participant’s status, CBG data were collected from clinic letters.
Data analysis
Data were analysed using SPSS V.22 by an independent statistician. Descriptive statistics were used to report the demographics of the cohort. Data were analysed as paired data using a t-test. VT, respiratory rate, Ti and PaCO2 levels were analysed using the paired t-test. Compliance, leak and ventilator prescription data were analysed with the Wilcoxon rank sum. The McNemar test was used to determine if there were differences in hypercapnic respiratory failure (defined as PaCO2 >6 kPa). To assess if persistent hypercapnia was associated with leak, compliance or VT, an analysis of variance between participants who remained hypercapnic and participants where hypercapnia had resolved after review was undertaken.
Results
Participants
At the start of the study, there were 78 participants. Data for 52 participants were analysed; data for the remaining 15 were not available (see figure 1). Patients were excluded if they declined to attend a review appointment, as ventilator data for comparison were not available for these patients. Where patients were excluded due to mortality, they had not attended a review appointment nor were issued with a replacement ventilator.
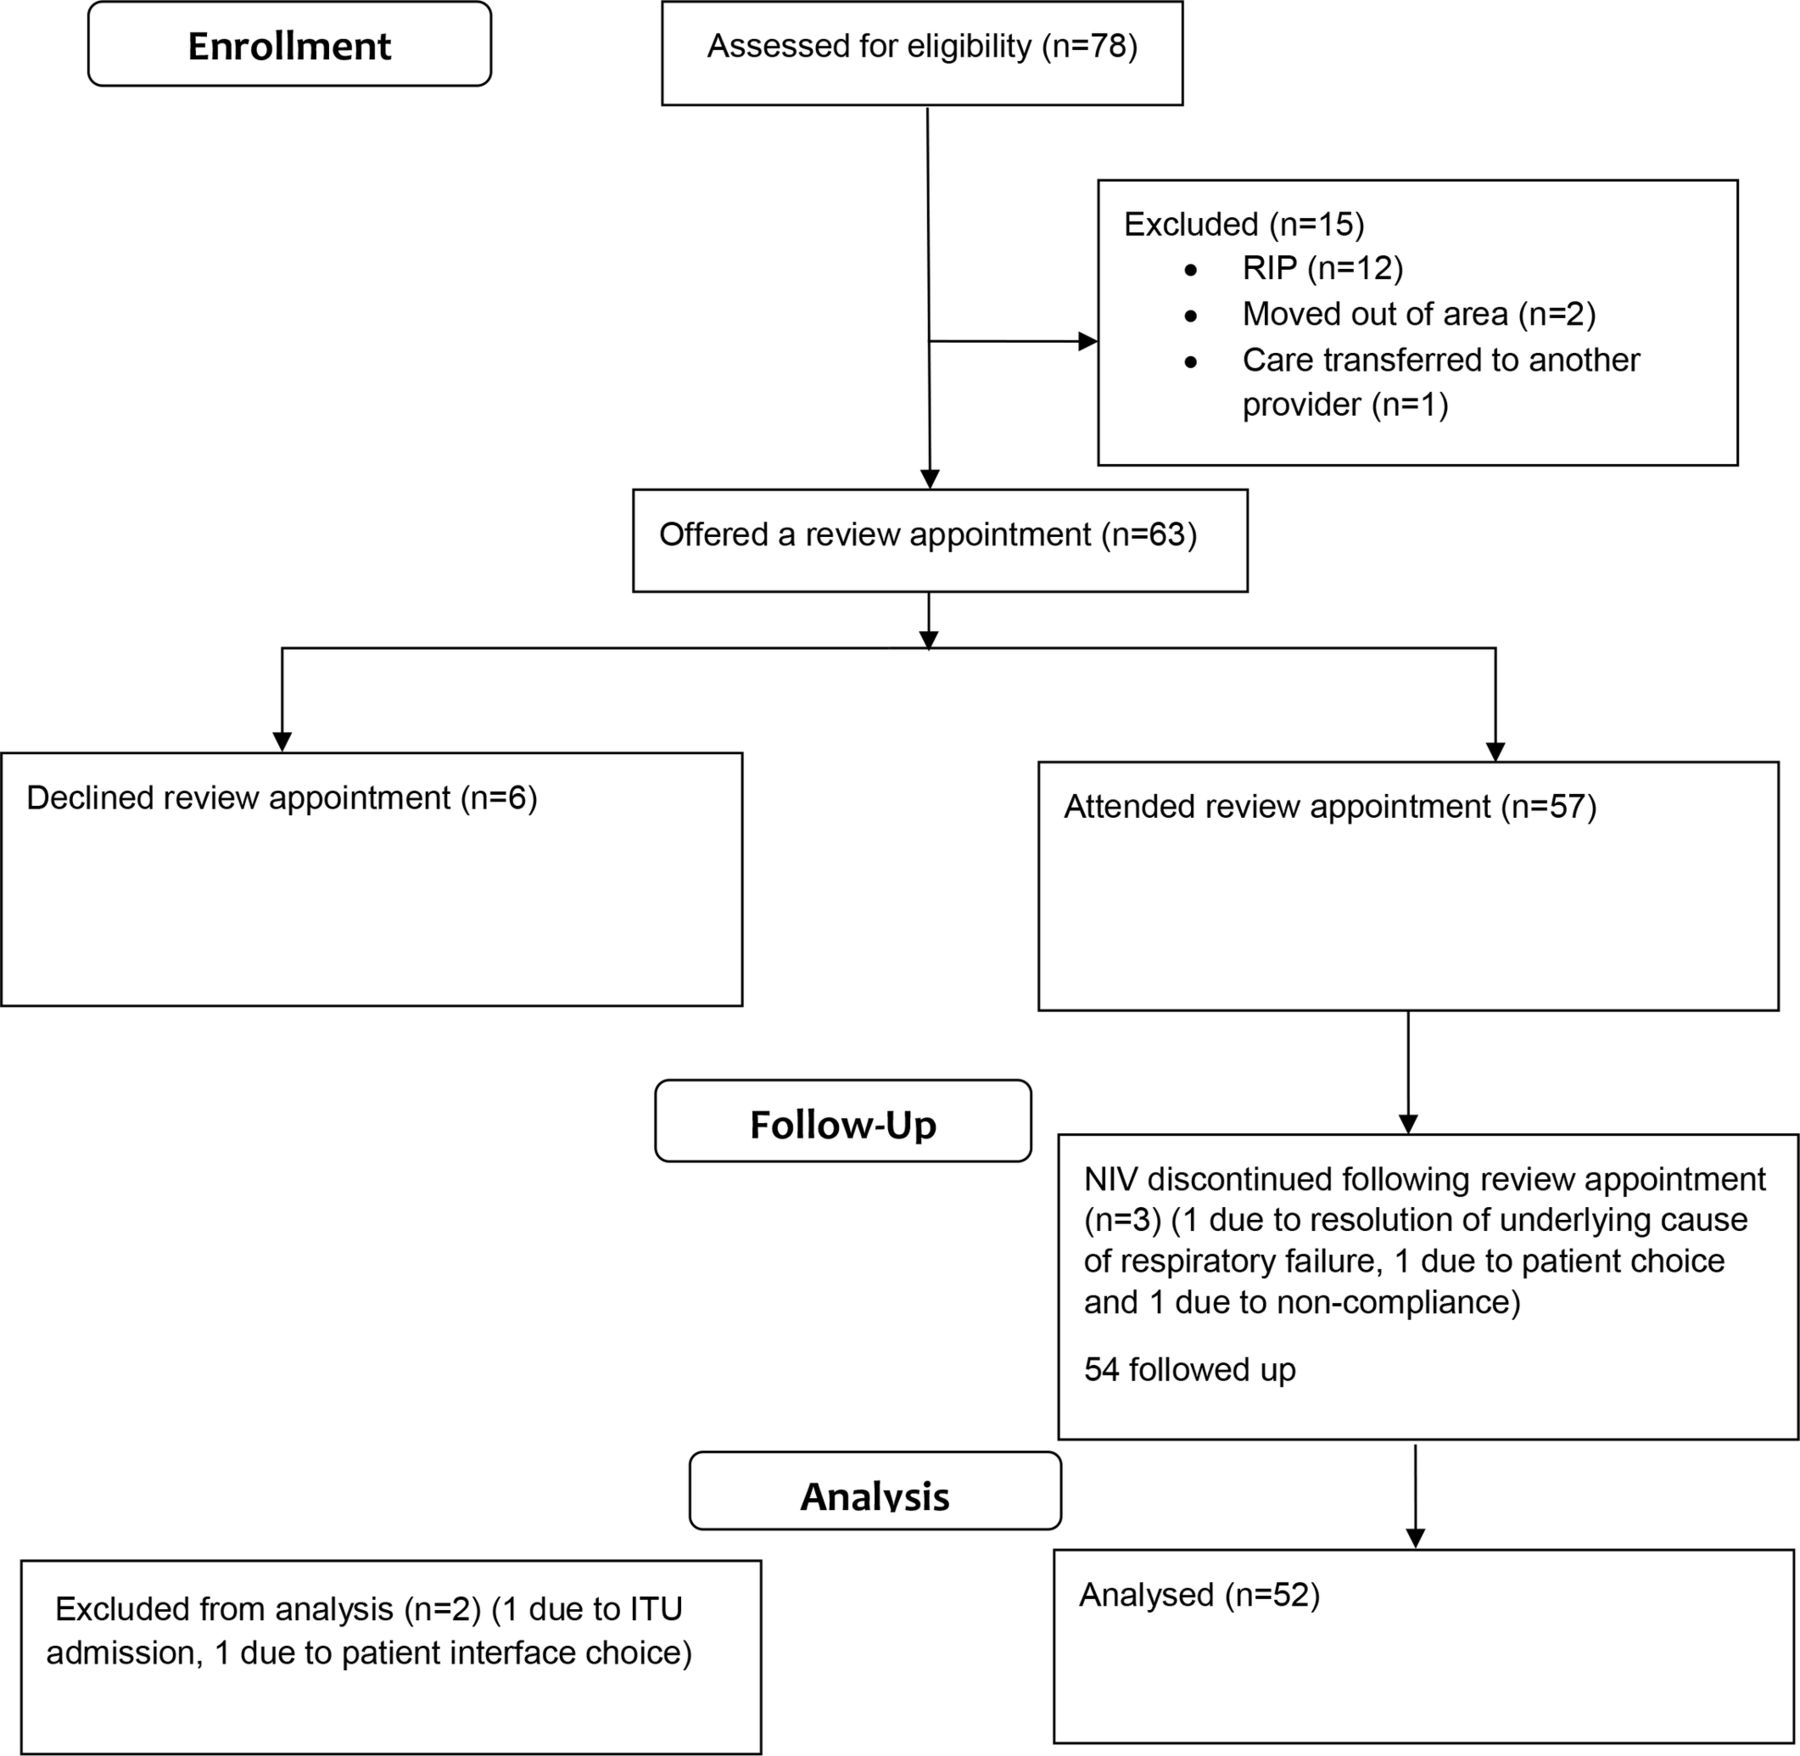
Flow diagram of patient progress through the study. ITU, intensive treatment unit; NIV, non-invasive ventilation.
There were more females in the group (men:women, 21:31) and the mean (SD) age of participants was 62 (18.8) years. The main reason for NIV use was obesity-related respiratory failure (33%), followed by COPD (27%), multiple diagnoses (13%), NMD (12%), chest wall deformity (10%) and other (6%). The median duration participants had been receiving domiciliary NIV prior to their review appointment was 33 months (IQR 15–48 months). The median time between the participants’ review appointment and their last appointment in a respiratory clinic was 5.5 (IQR 1.6–9.7) months. At the first review appointment, the mean nightly use of NIV was 6.53 hours and mean compliance was 90%, where compliance was defined as >4 hours/night NIV use for >70% of nights.20 Prior to review, most participants used nasal (63%) and full face (27%) interfaces; post-review this was 56% and 31%, respectively (table 1).
Type of ventilator before and after review appointment
Seventy-nine per cent (n=41) of patients required a change in their interface prescription, either in mask type or size. Eighty-seven per cent (n=45) of participants required an amendment to their ventilator prescription (table 2).
Domiciliary non-invasive ventilation prescription pre-review and post-review
Prior to changing their prescription, seven individuals were achieving a VT <6 mL/kg/ideal body weight and thus required an increase in the target VT. Twenty-three individuals, although having a VT >10 mL/kg/ideal body weight were thought to have been overventilated, and thus required titration of their ventilator prescription. Mean PaCO2 at the start of the study was 6.59 (1.04) and post intervention was 6.45 (0.72) (mean difference 0.13, 95% CI -0.24 to 0.51, p=0.473).
VT and minute ventilation
VT measurements were available for 49 participants; the remaining participants were non-compliant and thus VT measurements were not available. Results demonstrated a significant change in both actual VT (mL) (mean difference 79.7 mL; 95% CI 12.1 to 147.2, p=0.022) and ideal VT (mL/kg/ideal body weight) (mean difference 1.23; 95% CI 0.21 to 2.25, p=0.01) after prescription review (figure 2). There were two outliers whose VT had been kept intentionally higher than usually expected for clinical reasons. When a reduction in VT was trialled in these patients, they deteriorated and therefore their original prescription of >10 mL/kg ideal body weight was maintained. Following exclusion of the outliers, there remained a statistically significant change in both VT (mL) (mean difference 91.1; 95% CI 27.4 to 154.8, p=0.006) and ideal VT (mean difference 1.38; 95% CI 0.42 to 2.34, p=0.006). As demonstrated in figure 2, there was a reduction in the range of the VT. Where patients had a VT of >10 mL/kg/ideal body weight, there was a trend towards a reduction in their VT (mean pre-review: 13.4 mL/kg/ideal body weight vs mean post-review: 9.7 mL/kg/ideal body weight). Where patients had a VT of <6 mL/kg/ideal body weight, there was a trend towards an increase in their VT (mean pre-review 4.3 mL/kg/ideal body weight vs mean post-review 6.5 mL/kg/ideal body weight). At the initial review appointment, 15% of patients had a VT of 8–10 mL/kg/ideal body weight versus 29% at the 6-week follow-up.

Changes in tidal volume (VT, mL/kg/ideal body weight) following non-invasive ventilation prescription review.
Minute ventilation measurements were available for 49 participants; the remaining participants were non-compliant and so minute volume measurements were not available. Results demonstrated an increase in minute ventilation after prescription review (mean difference 0.11 L/min; 95% CI −0.69 to 0.92, p=0.781).
Leak
Leak measurements were available for 49 participants, where participants were non-compliant, leak measurements were not available. There was no change in leak following review of NIV prescriptions (mean (SD): 43 (23.4) L/min vs 45 (19.9) L/min, P=0.272). Manufacturer’s guidelines state that the ventilators used in this study are able to compensate for a leak of up to 60 L/min. Pre-review 12% (n=6) of participants had a measured leak >60 L/min, post-review only 4% (n=2) continued to have a measured leak >60 L/min.
Compliance
Data were available for 50 participants. Compliance improved following a change in the NIV prescription; there was a significant increase in the percentage of days during which NIV was used for more than 4 hours per night (the recommended minimal use20, pre-prescription change: 90% vs post-prescription change: 96%, p=0.007) (figure 3). There was an increase in the total number of hours used each night; however, this was not statistically significant (pre-prescription change: 6.53 vs post-prescription change: 6.94 hours, p=0.211) (figure 4). Using a definition of compliance of >4 hours use a day for 70% of days, prior to NIV prescription review 58% of participants were compliant and after review this increased to 70% (p=0.180). Pre intervention, 19% (n=10) of participants used their NIV for <4 hours/night; in this subgroup, the mean use was 122 min/night, which increased to 270 min/night (mean difference 148 min; 95% CI 14 to 281, p=0.034) post intervention for these people.

Compliance with non-invasive ventilation percentage of days with >4 hours use.

Compliance with non-invasive ventilation average hours/day before and after non-invasive ventilation prescription review.
Hypercapnic ventilatory failure
PaCO2 data were available for only 21 participants (40%), as pre-review and post-review CBGs were only obtained if clinically indicated. There was a non-significant reduction in the incidence of ongoing hypercapnia (defined by a PaCO2 >6 kPa, pre-prescription change: 31% vs post-prescription change: 11%, p=0.125) and measured PaCO2 (mean difference 0.14; 95% CI −0.24 to 0.51, p=0.473). A multivariance analysis showed no significant difference in leak (p=0.75), compliance (p=0.65) or VT (p=0.65) between participants who had persistent hypercapnia and those who were eucapnic. Individual inspection of the six participants with persistent hypercapnia showed they were either non-compliant (n=4, with average daily NIV use of 129 min) or had ongoing interface issues (n=2).
Discussion
These results demonstrate that the use of data downloaded via modems from domiciliary ventilators can lead to safe and clinically meaningful changes in domiciliary NIV prescription and patient outcomes. The increase seen in VT is likely to be related to observed amendments in NIV prescriptions. The paired data show that there was a trend towards an increased IPAP and EPAP with a reduced rise time. There was also a change in the mean VT post-review of 8.8 mL/kg/ideal body weight compared with a pre-review of 10.0 mL/kg/ideal body weight; this may have been due to an improvement in leak in some individuals resulting in the delivery of more accurate VT. Previous studies have reported VT as mL/kg rather than mL/kg/ideal body weight, making comparison difficult. A target VT of 8–10 mL/kg/ideal body weight has been employed in other studies; therefore, the VT achieved in this study is comparable with other published studies.21
While not statistically significant, there was a reduction in the number of patients who had a leak greater than the manufacturer’s set threshold (reduction in 66% of patients who had a leak greater than 60 L/min) and an observed reduction in the measured leak; this may have been due to changes in the interface prescription; however, the authors acknowledge that it is not possible to definitively attribute the leak reduction to this. In addition, since excessive leak may be identified by clinical features, such as dry mouth or excessive noise, the impact of the ventilator download data is difficult to judge in the absence of a control group. It is essential that leak is minimised to optimise ventilation; where leak is excessive (>60 L/min) VT and efficiency of ventilation will be reduced.15 Additionally, excessive leak can impact on patient comfort which may reduce compliance.22 Furthermore, excessive leak can lead to overtightening of interface straps, which can cause pressure ulcers, a well-known side effect of NIV.22 The patient-centred benefits of reduced mask leak could include reduced side effects such as eye irritation, reduced sleep disturbance from leak noise and potential reduced impact on bed partners sleep comfort. Thus, although a statistically significant reduction in the leak value was not seen, there may have been patient-centred gains, although the authors acknowledge that we cannot specifically infer this from the data collected. Future work specifically investigating the patient-centred benefits in terms of patient comfort, side effects and sleep quality from ventilator download-led prescription changes will help determine if the reduced leak has any clinical significance. Patient re-education on cleaning, caring and replacement of interfaces may have also contributed to the improvement in mask leak. Variation in algorithms used by different ventilator companies makes accurate comparison of interface leak across studies difficult.
Hours of NIV use was similar to that of other studies18 and was greater than the 4 hours often suggested by clinicians. Although not statistically significant, a change in actual hours of daily NIV use was seen, along with an increase in participants’ compliance, with a greater percentage of participants using NIV for more than 4 hours/night (90% vs 96%). In those patients who were considered to have low compliance, defined by less than 4 hours use of NIV on 70% of nights, there was an increase in the number of hours used on average by over 2 hours/night following download of ventilator data to adjust NIV prescription to ensure adequate ventilation, minimisation of leak and increase patient comfort. Suggesting that downloading ventilator data to assist in modifying NIV prescriptions is a useful adjunct to improve patient comfort and achieve a clinically meaningful increase in NIV compliance. Data from Masa et al23 and Borel et al24 suggest greater gains the longer NIV is used; thus a 2-hour increase in NIV use could result in greater patient benefit. Furthermore, the small sample size and heterogeneity of the population in this study may have resulted in a statistical underestimation of the changes observed in NIV compliance.
Overall, there was a reduction in use of pillows and nasal masks and an increase in prescription of full face and diver masks. Which suggests some patients may have been experiencing a significant leak (particularly from the mouth) or comfort issues which could have adversely affected compliance. It is likely that there was no one reason for increase in compliance and the cause is probably specific to each patient. Collecting patient comfort scores in future studies would provide more insight into this important area.
Measurements for PaCO2 levels pre-review and post-review were available for 21 participants. While not statistically significant, there was an observed reduction in PaCO2 and an overall reduction in the percentage of patients with ongoing hypercapnia, with 57% of patients having a reduction of their PaCO2 to less than 6.5 kPa. We acknowledge that these data have been measured in a small number of patients and acknowledge that any conclusion on the effect of ventilator data downloads on PaCO2 requires robust, prospective data.
Limitations, bias and confounding factors
As this was a pragmatic clinically based study, there are a number of areas to be considered about the findings. First, the study design did not include a control group and thus the effect of the intervention is uncertain. Second, it was not feasible to blind the investigators collecting data, which may have resulted in observer bias; however, the objective nature of the data helps mitigate this risk.25 To further minimise observer bias, investigators collecting data were not involved in participants’ reviews. Third, this was a relatively small sample size in a heterogeneous population. Greater changes may have been seen in subgroups according to underlying disease pathology. Due to the novel nature of utilising ventilator data downloads, a sample size could not be calculated due to the paucity of previous literature. Additionally, the reliability of the software (EncoreAnywhere, Philips Respironics) has not been tested in bench studies, and reliability has not been reported. Therefore, the potential for measurement error is acknowledged. In addition, this software is only able to provide trend data for the measurement reported. Finally, we acknowledge the potential for the Hawthorne effect to have occurred as we were monitoring measurements not previously monitored.
Unrelated to the study, 12 participants died before their review appointment. Although attrition due to death is arguably inevitable in a study including domiciliary patients with NIV, it may nonetheless have contributed to study bias.
It was not possible to obtain CBG results pre-review and post-review for all participants; PaCO2 data are therefore at risk of measurement bias and should be interpreted with caution. An independent and blinded statistician completed the data analysis, thus minimising reporting and observer bias. Multiple interventions were conducted at the review appointment, making it difficult to ascertain which intervention had the biggest impact on compliance. Participants signed data protection consent forms for the application of a modem. They were therefore all aware that their NIV usage was being monitored. For some patients knowing that they were being monitored could cause behaviour change, thus, increasing compliance.
This study was designed to assess the clinical implications of utilising ventilator data downloads. The authors acknowledge that the lack of cost-effectiveness data is a limitation, however, a different study design would have been required to assess cost-effectiveness. For this study, assessment of the ventilator data downloads outside of the clinical appointments was undertaken by a consultant physiotherapist, the EncoreAnywhere system (Philips Respironics) has a built in flagging system, allowing clinicians’ to prioritise patients with clinical concerns. Where a patient required a review of their ventilator data download, this was estimated to take approximately 3 min per patient. This may be offset by a reduced need for face-to-face clinical assessment. Future studies in this area should be designed to assess value in terms of cost as well as clinical effectiveness.
Conclusion
Results from this study have demonstrated employing ventilator download functions can inform clinicians’ decision-making to enable the optimal delivery of domiciliary NIV. Using ventilator data downloads in this outpatient setting facilitated an early, objective assessment of leak and ventilator prescriptions. Where outpatient NIV establishment and review are undertaken in lieu of traditional and more expensive inpatient environments, ventilator data downloads can provide clinicians with essential information, and therefore can be a useful interventional adjunct in the clinicians’ toolbox.
Acknowledgments
The authors wish to thank Robert Chase for his support during the study.
References
Footnotes
Twitter @skmansell
Contributors SKM and DDC conceived the idea for the project. SC and IH collected and inputted the data. KH and MW conducted the data analysis. SKM, SC, IH, MJW, KH, CK and SM were involved in the development of the manuscript.
Funding This project was partially funded by Philips Respironics. Funding was provided for data entry and statistical analysis. Third party statisticians (MW and KH) conducted the statistical analysis. Philips Respironics were not involved in the study design.
Competing interests SKM and SC have received sponsorship from Philips Respironics for conference attendance. SKM has provided consultation and speaker services to Philips Respironics.
Provenance and peer review Not commissioned; externally peer reviewed.
Data sharing statement No additional data are available.
Presented at European Respiratory Society Congress 2016