Article Text

Abstract
Background Chronic respiratory failure complicating sleep-disordered breathing in obese patients has important adverse clinical implications in terms of morbidity, mortality and healthcare utilisation. Screening strategies are essential to identify obese patients with chronic respiratory failure.
Method Prospective data were collected from patients with obesity-related sleep-disordered breathing admitted for respiratory assessment at a UK national sleep and ventilation centre. Hypercapnia was defined as an arterial partial pressure of carbon dioxide of >6kPa.
Results 245 obese patients (56±13 years) with a body mass index of 48±12 kg/m2, forced vital capacity (FVC) of 2.1±1.1 L, daytime oximetry (SpO2) of 91±6% and abnormal overnight oximetry were included in the analysis. Receiver operator curve analysis for the whole group showed that an FVC ≤3 L had a sensitivity of 90% and a specificity of 41% in predicting hypercapnia, and an SpO2 ≤95% had a sensitivity of 83% and a specificity of 63% in predicting hypercapnia. Gender differences were observed and receiver operator curve analysis demonstrated ‘cut-offs’ for (1) SpO2 of ≤95% for men and ≤93% for women and (2) FVC of ≤3.5 L for men and ≤2.3 L for women, in predicting hypercapnia.
Conclusions The measurement of FVC and clinic SpO2 in obese patients with abnormal overnight limited respiratory studies predicted hypercapnia. This may have clinical utility in stratifying patients attending sleep clinics.
This is an Open Access article distributed in accordance with the Creative Commons Attribution Non Commercial (CC BY-NC 3.0) license, which permits others to distribute, remix, adapt, build upon this work non-commercially, and license their derivative works on different terms, provided the original work is properly cited and the use is non-commercial. See: http://creativecommons.org/licenses/by-nc/3.0/
Statistics from Altmetric.com
Key messages
-
Simple physiological tools of clinic SpO2 and FVC can be used to predict hypercapnia with high sensitivity, in patients with a BMI>30kg/m2 and evidence of sleep disordered breathing.
-
For men an SpO2 <95% and FVC <3.5L is predictive of hypercapnia, for women these cut-offs are <93% and 2.3L.
-
This may assist in streamlining the clinical assessment of obese patients with sleep disordered breathing.
Background
Increasing trends in obesity are well publicised with a worldwide increase in body mass index (BMI) of 0.4 kg/m2 per annum.1 Within the UK, almost a quarter of all adults are currently classified as obese, with an annual cost to the National Health Service (NHS) of £5.1 billion.2 BMI is strongly associated with all-cause mortality, and this imposes an extra significant burden on the healthcare system.3–5 Over 50% of patients with a BMI greater than 40 kg/m2 have obstructive sleep apnoea (OSA), and up to one-third of morbidly obese patients exhibit obesity hypoventilation syndrome.6–8 As expected, the patients with chronic hypercapnic respiratory failure have a higher morbidity, mortality and healthcare utilisation compared with non-hypercapnic obese patients with OSA.9–11 Given the increasing requirement to provide advanced respiratory technologies, such as continuous positive airway pressure treatment (CPAP) and non-invasive ventilation (NIV) for obesity-related sleep-disordered breathing,12 ,13 it has become a priority for sleep services to develop simple screening tools to predict hypercapnia so that a personalised clinical approach can be applied to the patient.
A common practice in sleep medicine is to use home overnight oximetry monitoring ahead of the first clinic consultation, which aims to streamline the 18-week NHS referral to treatment clinical pathway12 and therefore limiting the financial penalties that are incurred by the healthcare providers when pathway breaches occur. To enhance the clinical pathway, it would be desirable to develop a simple respiratory screening strategy to reliably identify those high-risk obese patients with oximetry confirmed sleep-disordered breathing who have coexistent chronic respiratory failure so that the appropriate treatment can be initiated promptly. We hypothesised that clinic oxygen saturation (SpO2) and forced vital capacity (FVC) would be clinically useful measurements in predicting chronic respiratory failure in obese patients with sleep-disordered breathing.
Patients and methods
Study population
Patients with sleep-disordered breathing admitted to a secondary and tertiary referral sleep and ventilation centre were included in the analysis. All data were gathered prospectively from a bespoke clinical database (CareVue, Philips, USA). All patients were initiated on nocturnal positive airway pressure therapy, including CPAP and NIV, as per the standard unit clinical protocol.
Inclusion and exclusion criteria
Patients with BMI >30 kg/m2 and evidence of sleep-disordered breathing during overnight monitoring were included. Patients with spirometric evidence of obstructive airways disease (forced expiratory volume in 1 s/FVC ratio, FEV1/FVC ratio <70%) or evidence of Cheyne-Stokes respiration during nocturnal monitoring were excluded.
Population demographics and physiological measurements
Arterial blood gas sampling, spirometry and clinic SpO2 measurements were performed with patients in a seated position breathing room air at least 4 h after waking. Analysis of arterial partial pressure of oxygen (PaO2), arterial partial pressure of carbon dioxide (PaCO2), arterial bicarbonate concentration (HCO3−) and pH were performed using a standard analyser (ABL 90, Radiometer, West Sussex, UK). FEV1 and FVC were measured using a handheld spirometer (Micromedical, Carefusion Ltd, Germany) according to a standard protocol.14 SpO2 was measured using pulse oximetry (Massimo UK, Hants, UK). Daytime somnolence was assessed using the Epworth Sleepiness Score (ESS).15 Data from the overnight limited respiratory monitoring (transcutaneous carbon dioxide (TcCO2) and SpO2, TOSCA, Radiometer Ltd, Crawley, London) were interpreted by expert physicians as part of an established multidisciplinary meeting. Demographic, anthropometric measurements and data detailing comorbidities (ischaemic heart disease, cerebrovascular disease, diabetes mellitus and systemic hypertension) were sourced from the medical e-records system.
Statistical analysis
Data analyses were performed using SPSS (V.19, IBM Corporation Ltd, USA). Data are presented as mean±SD for parametric data. Data were tested for normality and parametric analyses conducted. Data were analysed across all patients with eucapnia and hypercapnia using independent t tests. Further analyses were conducted to assess the utility of physiological parameters in predicting PaCO2 level ≥6 kPa. Relationships between spirometric measurements and gas exchange were investigated using regression analyses. The clinical utility of SpO2 and FVC in predicting hypercapnia was assessed using receiver-operator characteristic (ROC) analyses. For all analyses, p value <0.05 was considered statistically significant.
Results
Patient diagnoses
In total, 245 obese patients (130 men, 53%) were studied between January 2006 and March 2012. In total, 91% had a BMI >35 kg/m2, 72% had a BMI >40 kg/m2, 51% had a BMI >45 kg/m2 and 34% had a BMI >50 kg/m2. In total, 164 (67%) were hypercapnic, with PaCO2 above 6 kPa. Patients with eucapnic OSA had a 4% oxygen desaturation index (ODI) of 24.5±19.5 events/h with nocturnal SpO2 of 94.1±3.2%, and the percentage of analysis time with SpO2 below 90% was 13.5±20.4%. In patients with hypercapnia, the 4% ODI was higher at 42.6±35.5 events/h (hypercapnic vs eucapnic group; p=0.003), nocturnal SpO2 was lower at 89.0±7.4% (hypercapnic vs eucapnic group; p=ns) and the percentage of analysis time with SpO2 below 90% was higher at 36.3±32.1% (hypercapnic vs eucapnic group; p<0.001).
Clinical outcome data
There were 12 deaths in the cohort (6.8%) during a mean follow-up period of 2.7 years; of these, 9 (75%) were hypercapnic. Non-survivors, compared with survivors, were older (65±10 years vs 55±13 years; p=0.006), had a longer length of hospital stay during inpatient nocturnal ventilatory support set-up (5.8±3.0 days vs 3.4±3.3 days; p=0.02), higher haematocrit (44.6±7.1% vs 40.0±14.6%; p=0.03), higher admission PaCO2 (7.37±1.15 kPa vs 6.55±1.12 kPa; p=0.02), lower FEV1 (1.13±0.65 L vs 1.90±0.99 L; p=0.008) and lower FVC (1.33±0.69 L vs 2.25±1.13 L; p<0.006). There was a trend for the frequency of diabetes mellitus to be greater in the hypercapnic group compared with the eucapnic group (40% vs 28%; p=0.07). There was also a significant difference in PaCO2 between genders (men 6.3±1.1 kPa vs women 6.9±1.1 kPa; p<0.001). Data for each group are shown in table 1.
Demographic, anthropometric and comorbidity data across the different groups of sleep-disordered breathing
Patients with hypercapnia versus eucapnia
The eucapnic group differed from the hypercapnic group. In particular, the hypercapnic group had significantly lower FEV1 (2.48±0.98 L vs 1.55±0.84 L; p<0.001), FVC (2.92±1.12 L vs 1.84±0.97 L; p<0.001), clinic SpO2 (94.7±2.6% vs 89.8±6.1%; p<0.001) and PaO2 (9.86±1.49 kPa vs 8.2±1.37 kPa; p<0.001) compared with the patients with eucapnia. As expected, PaCO2 and HCO3− levels were higher in the hypercapnic groups (5.43±0.38 kPa vs 7.18±0.91 kPa; p<0.001 and 25.5±1.9 vs31.8±3.6 mmol/L; p<0.001, respectively, table 2).
Spirometric and arterial blood gas measurements
Relationships between gas exchange, body composition and lung volume at different levels of BMI
There were weak correlations observed across the whole cohort between clinic SpO2 and FVC (r=+0.43, p<0.001) and % predicted FVC (r=+0.23, p<0.001). There were also weak correlations between BMI and clinic SpO2 (r=−0.22, p=0.001), and between BMI and PaCO2 (r=+0.25, p<0.001). As expected, there were inverse correlations observed between PaCO2 and SpO2 (r=−0.56, p<0.001), and between PaCO2 and FVC (r=−0.53, p<0.001), but the relationship between PaCO2 and % predicted FVC was again weak (r=−0.32, p<0.001). These weak relationships were maintained when the patients were grouped according to BMI (tables 3 and 4).
Relationships between SpO2 and daytime PaCO2, body composition and lung volume at different levels of BMI
Relationships between daytime PaCO2 and clinic SpO2, body composition and lung volume at different levels of BMI
Clinic SpO2 and FVC to predict hypercapnia
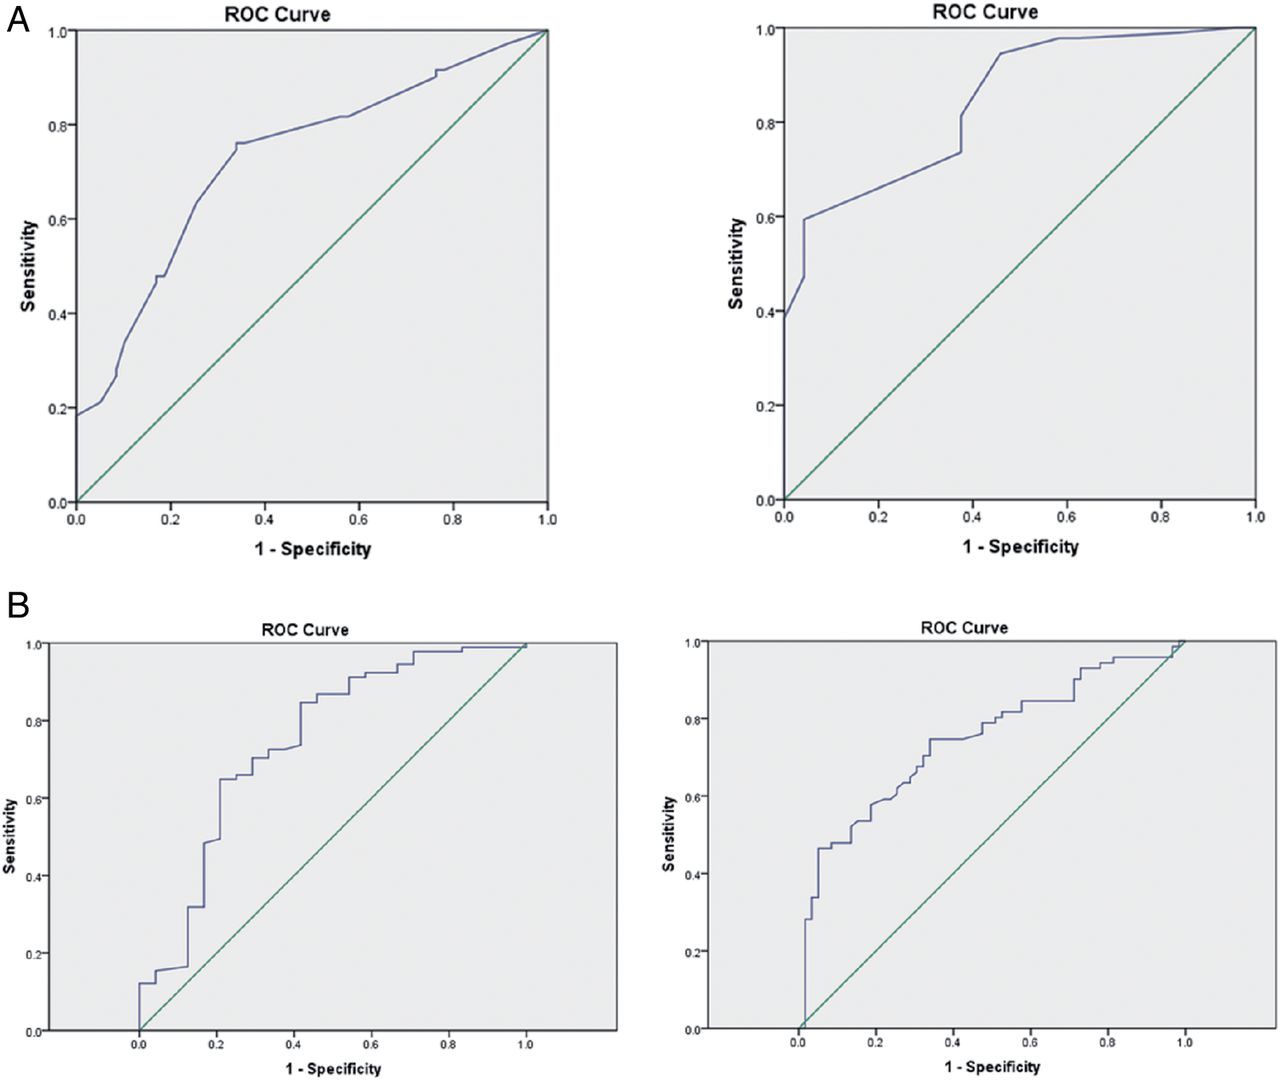
Multiple linear regression was performed using all the variables for which the bivariate correlation with PaCO2 was significant. These variables were used then to identify the physiological variables that predicted PaCO2 >6 kPa. Clinic SpO2 and FVC were retained in the linear model and stepwise logistic regression was subsequently performed. Clinic SpO2 (OR 0.55, 95% CI 0.40 to 0.75) and FVC (OR 0.76, CI 0.67 to 0.85) were retained in the logistic regression model as predictors of hypercapnia. The utility of SpO2 and FVC in predicting hypercapnia was assessed using ROC analyses. For patients with a BMI >30 kg/m2 and a ‘cut-off’ level for clinic SpO2 of <95%, the area under the curve (AUC) was 0.80 with a sensitivity of 83% and a specificity of 63% (p<0.001). A ‘cut-off’ level for FVC of <3 L had an AUC of 0.79 with a sensitivity of 90% and a specificity of 41% in predicting hypercapnia (p<0.001). The positive predictive value (PPV) of FVC <3 L was 65% with a negative predictive value (NPV) of 95%. For SpO2, the PPV was 34% and the NPV 94%. Using lower cut-off levels improved the specificity but with a marked reduction in sensitivity (table 5); however, using sensitivities of above 80% allows for a low false negative rate of less than 20%. Based on the logistic regression model described above, the combination of SpO2 and FVC for patients with a BMI >30 kg/m2 with evidence of sleep-disordered breathing yielded an AUC of 0.83 in predicting hypercapnia (figure 1). Using the bootstrap cross validation method, a combined cut-off level of SpO2 of <93% along with FVC <2.0 L (AUC 0.83, CI 0.78 to 0.88) can be used to predict hypercapnia with a sensitivity of 53% (CI 45% to 60%) and specificity of 92% (CI 83% to 97%, positive likelihood ratio 6 CI 3 to 13, negative likelihood ratio 0.5 CI 0.4 to 0.6). Finally, and most importantly, we observed that from independent male and female ROC analyses, the cut-off levels for SpO2 and FVC were <95% (AUC 0,73, CI 0.64 to 0.82) and <93% (AUC 0.84, CI 0.76 to 0.93) and 3.5L (AUC 0.75, CI 0.66 and 0.83) and <2.3L (AUC 0.75, CI 0.62 to 0.87), respectively (table 6 and figure 2).
Receiver operator curve analyses for predicting hypercapnia: sensitivity and specificity ranges for differing cut-off levels
Receiver operator curve analyses for predicting hypercapnia: sensitivity and specificity ranges for men and women

Receiver operator curves for clinic oxygen saturation and forced vital capacity to predict hypercapnia (men and women combined). AUC, area under the curve.
(A) Receiver operator curves for clinic oxygen saturation to predict hypercapnia separated by gender, men (right) and women (left). (B) Receiver operator curves for forced vital capacity to predict hypercapnia separated by gender, men (right) and women (left). ROC, receiver-operator characteristic.
Discussion
In this prospective observational cohort study, we have demonstrated that simple spirometric measurements of lung volume and clinic SpO2 predict chronic respiratory failure in obese patients with sleep-disordered breathing. We have also shown, as expected, gender differences for predicting hypercapnic respiratory failure. Surprisingly, previous data have only shown weak correlations between body composition, lung volume and chronic respiratory failure.16 ,17 However, these studies have not considered the clinical physiological predictive power of utilising FVC and daytime clinic oxygen levels (SpO2) in obese patients with confirmed evidence of sleep-disordered breathing to enhance screening for chronic respiratory failure. Indeed, we considered that this is a major caveat of the previous studies, and this is the first study to have shown in a large group of obese patients that a clinic SpO2 level below 95% for a man and 93% for a woman and an FVC less than 3.5 L for a man and 2.3 L for a woman has high sensitivity to detect hypercapnia, albeit with low specificity. Such tests with a high NPV will ensure that few patients with hypercapnia are missed, albeit at the expense of arterial blood gas measurements being performed on a few patients with eucapnia.
Critique of the method
These data were collected from a single centre specialising in the management of patients with sleep-disordered breathing and chronic respiratory failure. Although this was a selected cohort of obese patients with sleep-disordered breathing, unlike previous studies,18 the current study has identified that the simple clinical tests of FVC and SpO2 are not only reduced in patients with chronic respiratory failure, but also FVC and SpO2 can predict hypercapnic respiratory failure. From the current study, all the patients had sleep-disordered breathing, and it is the presence of a restricted lung volume that identifies the patients with chronic respiratory failure. Although the important associations that we have observed do not necessarily imply a causal link between anthropometric parameters, spirometric parameters and hypercapnic respiratory failure in obese patients, the results are physiologically coherent. The simplest method to test this as a causal mechanism between gas exchange, body composition, sleep-disordered breathing and lung volumes would be to undertake detailed measurements of respiratory polysomnography, pulmonary mechanics and lung volumes before and after significant weight loss, such as prebariatric and postbariatric surgery.19 ,20
Although it is well-recognised that vasoconstriction, dark skin and body movements influence transcutaneous oxygen and carbon dioxide measurements,21 ,22 all the physiological measurements were taken according to international and local guidelines and repeated in line with these standards.14 ,23 A simple screening tool based on absolute, rather than % predicted FVC values, would maximise the distribution and application of the test, obviating the need for calculating the % predicted FVC. Therefore, % predicted FVC was not included in the multiple linear regression model and absolute FVC measurements were used instead. As expected, gender differences in height would have affected absolute lung volume measurements, but we developed absolute ‘cut-offs’ for SpO2 and FVC that predict hypercapnia in men and women, respectively. This simple approach to screening would facilitate the incorporation of absolute FVC measurement into clinical practice.
Differences between patients with hypercapnia and eucapnia
To our knowledge, this is the largest UK dataset comparing patients with eucapnia and hypercapnia with sleep-disordered breathing. Interestingly, patients with eucapnia and hypercapnia had similar levels of daytime somnolence demonstrating that the standard clinical assessment, using the ESS,15 does not discriminate between those patients with and without chronic respiratory failure. However, as expected, the clinic SpO2 and PaO2 were lower in the hypercapnic group and SpO2 time below 90% higher, and the relationships between these variables were consistent with previous reports.6 ,24 The patients with chronic respiratory failure had a longer length of stay for establishment of nocturnal respiratory support than those with eucapnia, as a consequence of the extended titration of nocturnal NIV compared with CPAP, which is more straightforward and often can be performed on an outpatient basis.25
Relationship between daytime gas exchange, body composition and lung volume
In patients with sleep-disordered breathing, univariate analysis demonstrated that clinic SpO2 was correlated, albeit weakly, with BMI, FVC and PaCO2. In addition, PaCO2 was weakly correlated with BMI and FVC. These data provide support for the evidence of these weak direct and inverse associations between body composition, lung volume and hypercapnia. More importantly, multivariate linear regression analysis demonstrated that FVC and SpO2 were retained in the model predicting hypercapnia, and the ROC analysis demonstrated that FVC and SpO2 had sufficient sensitivity to be clinically useful predictors of chronic respiratory failure, albeit the specificity was low. These data have shown that an abnormal overnight oximetry study combined with a clinic SpO2 and an FVC measurement could be used as part of a sleep screening programme. The rationale for any future study would be to predict hypercapnic respiratory failure by employing a sleep screening strategy of overnight home oximetry to identify patients with sleep-disordered breathing combined with an FVC and a clinic SpO2 cut-off level. A clinically relevant primary event-related outcome in terms of health service research would be time to diagnose and treat hypercapnic respiratory failure with, secondary end-points including cost utility analysis and patient satisfaction.
Clinical implications
With the increasing incidence of obesity, general practitioners, as well as respiratory sleep clinics, have to be fully cognisant of the respiratory effects of obesity, including patients presenting with chronic respiratory failure. Such patients need to be established on NIV and potential delays and clinical pathway breaches will occur unless a streamlined system is in operation. A number of units already dispatch, via a courier and postal service, an oximeter prior to the clinic appointments.12 In those in whom nocturnal oximetry is available, the addition of simple SpO2 and FVC measurements can be performed by ancillary staff; the clinician can stratify those who would require an arterial blood gas to confirm chronic respiratory failure or can be used as additional verification for borderline oximetry results. Although arterial blood gas measurement and analysis is a relatively straightforward physiological test to perform, it is painful for the patient, requires skill of the clinician to perform and access to costly analysis equipment, which may not be available in all clinic settings. By using simple non-invasive screening tests of FVC and clinic SpO2, hypercapnia can be predicted in obese patients with sleep-disordered breathing prior the clinic appointment and arrangements made for arterial blood gas sampling to be performed either prior to or during a clinic attendance. This would not only limit the number of patients undergoing arterial blood gas measurements, which would clinically benefit the patient and financially benefit the service, but also ensure the most appropriate treatment is delivered to the patient in a timely fashion.
Conclusion
In conclusion, these novel data demonstrated that absolute FVC and daytime clinic SpO2 in obese patients with sleep-disordered breathing can be used as a screening strategy to predict chronic hypercapnic respiratory failure. An FVC of less than 3.5 L in a man and 2.3 L in a woman and a daytime SpO2 below 95% for a man and 93% for a woman has a high sensitivity to predict chronic respiratory failure. These tests have the potential to significantly streamline the management of obese patients with oximetry diagnosed sleep-disordered breathing.
Acknowledgments
AD and NH acknowledge the support by the National Institute for Health Research (NIHR) Clinical Research Facility at Guy's and St Thomas’ National Health Service (NHS) Foundation Trust and NIHR Biomedical Research Centre based at Guy's and St Thomas’ NHS Foundation Trust and King's College London.
References
Footnotes
-
Contributors SM, ESS, EB, MK and KL were responsible for data collection, analyses and writing the manuscript. AD assisted with statistical analyses. PBM, JS and NH were involved with manuscript preparation.
-
Funding This research received no specific grant from any funding agency in the public, commercial or not-for-profit sectors.
-
Competing interests None.
-
Provenance and peer review Not commissioned; externally peer reviewed.
-
Data sharing statement No additional data are available.