Article Text

Abstract
Background Asthma is a chronic disease that may affect daily activities and quality of life. Asthmatics have higher incidence of chronic rhinosinusitis (CRS) and asthma is associated with sinonasal inflammation and nasal symptoms, that all impair quality of life. Worsening of asthma has been found associated with levels of nitrogen dioxide as traffic indicator.
Aims The aim of the study was to evaluate the impact of traffic pollution indicated by nitrogen oxides (NO2 and NOx) on quality of life in asthmatic persons, individuals with CRS and controls.
Methods Within the Swedish Ga2len (Global Allergy and Asthma European Network), 605 asthmatics with and without CRS, 110 individuals with CRS only and 226 controls from four cities were surveyed. The mini Asthma Quality of life Questionnaire (mAQLQ) and the Euro Quality of Life (EQ-5D) health questionnaire were used. Air pollution concentrations at the home address were modelled using dispersion models.
Results Levels of NO2 (geometric mean 10.1 μg/m3 (95% CI 9.80 to 10.5) and NOx (12.1 μg/m3, 11.7 to 12.6) were similar among conditions (controls, asthmatics, individuals with CRS and asthmatics with CRS). The mAQLQ overall score was not found associated with levels of NO2 or NOx, with or without adjustments, and neither was scores within each of the four domains of mAQLQ: symptoms, activity limitations, emotional functions and effects of environmental stimuli. The mean EQ-5D index value, based on the five dimensions mobility, self-care, usual activities, pain/discomfort and anxiety depression, was also found unrelated to NO2 and NOx.
Conclusions At moderate exposure levels traffic pollution appears not to affect quality of life.
- Asthma Epidemiology
This is an Open Access article distributed in accordance with the Creative Commons Attribution Non Commercial (CC BY-NC 4.0) license, which permits others to distribute, remix, adapt, build upon this work non-commercially, and license their derivative works on different terms, provided the original work is properly cited and the use is non-commercial. See: http://creativecommons.org/licenses/by-nc/4.0/
Statistics from Altmetric.com
Introduction
Quality of life is a measure of the general well-being, which has previously only been assessed in relation to the concentrations of traffic air pollution on an ecological level. Using a health-related quality of life measure in eight domains, an association was found between vitality and nitrogen oxides (NOx), however, not within the remaining domains.1 On the individual level, a recent study found poorer physical health-related quality of life among women living in areas with high traffic density compared with women living in areas with moderate or low vehicle traffic density.2
Traffic pollutants have been found associated with the development of asthma3–6 and chronic rhinosinusitis (CRS),7 ,8 and asthma and CRS substantially affect quality of life (asthma9 ,10; CRS10–13). Since severity of asthma has been found related to traffic pollutants,14 ,15 it can be suggested that traffic pollutants may also affect quality of life among asthmatics and, due to the comorbidity16–18 and the comorbid clinical presentations19 ,20 between asthma and CRS, also among individuals with CRS.
There are many symptoms of CRS that affect quality of life, including chronic nasal congestion, facial pressure and pain, headache, hyposmia and anosmia,13 and the impairment of quality of life has been found as an important predictor of CRS severity.21 In a recent study on the same individuals as in this study, quality of life among those with asthma and CRS was found to be lower than among those with only asthma.10
There is a considerable variation in air pollution within and between the cities. The ESCAPE study (European Study of Cohorts for Air Pollution Effects) studied variation of nitrogen oxides (NO2 and NOx) at 36 study areas using on average 41 monitoring sites per study area and found that the range of NO2 was on average 54 µg/m3.22 The corresponding average among the study areas in northern Europe was 38.2 µg/m3. The largest part of NO2 variability was found within the study areas (60% of the total variability compared with 40% between study areas). Corresponding fractions for NOx were 70% and 30%, respectively. Due to this interstudy and intrastudy area variability of exposure within the population epidemiological studies can be employed to assess health effects and perceived health.
The aim of the study was to evaluate the impact of traffic pollution (studied as NO2 and NOx) on quality of life in asthmatic subjects, individuals with CRS and controls.
Methods
Study population
The study is based on the Ga2len survey which was conducted in 19 European centres aiming at studying asthma, rhinitis and CRS.23 The Swedish part of Ga2len consists of four centres situated in Gothenburg, Stockholm, Uppsala and Umeå. Within these Swedish centres, a random population-based sample among those aged 16–75 years received the postal survey in the year 2008 and 27 866 individuals responded (about 60%). Upto three remainders were mailed. Among the respondents, randomly selected subgroups consisting of individuals with asthma, CRS, both asthma and CRS and those with neither asthma nor CRS, were invited to a clinical follow-up in 2009–2010. At the follow-up, 1329 individuals participated of which 605 were defined as asthmatics, 240 were defined as having CRS, 226 were defined as having neither asthma nor CRS and 388 were excluded since they did not fulfil the criteria to be included in either of the subgroups.
The study was approved by the Regional Ethical Review Board in Stockholm, Sweden (Dnr 2008/1100-31/4), and the collected personal data were treated according to the Swedish personal data act.
Defining asthma, CRS and controls
The criteria for asthma were to have self-reported asthma and either asthma symptoms (wheezing, and/or attack of shortness of breath and/or awakening at night with breathlessness in the previous 12 months) or taking asthma treatment (taking any asthma medication during the last 12 months).
CRS was defined according to the European position paper on rhinosinusitis and nasal polyps (EP3OS) criteria,24 that is, the presence of at least two of the following symptoms for at least 12 weeks in the last year: (1) nasal blockage, (2) nasal discharge, (3) facial pain or pressure, (4) reduction in sense of smell with at least one of the symptoms being nasal blockage or nasal discharge.
The control group consisted of those who were not classified as having either asthma or CRS at either the first postal survey or the follow-up visit and additionally did not report attacks of shortness of breath, wheezing, use of asthma medicines or CRS symptoms.
Data collection
All individuals completed the Euro Quality of life (EQ-5D) health questionnaire, which assesses quality of life in the five dimensions mobility, self-care, usual activities, pain/discomfort and anxiety/depression. A summary index comprising all dimensions was calculated utilising the UK time trade-off (TTO) value set.25
Individuals who fulfilled the criterion for asthma completed the Juniper Mini Asthma Quality of life Questionnaire (mAQLQ),26 aiming to assess the impact of asthma on quality of life. The mAQLQ is divided to assess the impact of asthma on quality of life in the four domains: symptoms; activity limitations; emotional functions and effects of environmental stimuli. Each of these domains score 1–7, where 1 indicates maximal impairment and 7 no impairment. The overall impact of asthma on quality of life was evaluated as the mean of the scores in each domain.
At the clinical visit the following set of variables were also collected: lung function, skin prick test, exhaled nitric oxide, odour identification and peak nasal inspiratory flow.
Lung function assessment was performed using the EasyOne Spirometer (ndd Medizintechnik AG) according to the American Thoracic Society (ATS) spirometry standards.26 Forced vital capacity (FVC) and forced expiratory volume in 1 s (FEV1) were registered before and at least 15 min after bronchodilation (inhalation of 200 µg salbutamol). The European Community for Steel and Coal equations were used as reference values.27
Skin prick test (SPT) was performed on the inside of the forearm using the following set of allergens: timothy grass, mixed grass, Dermatophagoides pteronyssinus, cat, birch, blattella, olive, Alternaria, dog, Artemisia, Parietaria, Dermatophagoides farinae, histamine (positive control) and diluent (histamine control). A positive SPT was defined as a weal at least 3 mm at the widest diameter. Atopy was defined as at least one positive SPT finding.
Fraction of exhaled NO (FeNO) was assessed using NIOX MINO (NIOX MINO; Aerocrine, Stockholm, Sweden) according to recommendations from the ATS and European Respiratory Society .28
Smell was assessed using Sniffin'Sticks test kit (Bughart Messtechnik, Wedel, Germany) includes 12 pens. During the test each pen was placed 2 cm in front of both nostrils, thereafter the participant was asked to sniff for 3–4 s. The outcome was registered on a four-alternative card, and the result was finally presented as the number of correct identifications.
Peak Nasal Inspiratory Flow (PNIF) was carried out using the PNIF meter (Clement Clarke International, Essex, UK). The highest of three maximal inspiration flows was recorded.
Measurements of air pollution
The concentrations of nitric oxides NO2 and NOx were modelled within 50 m2 grids, using validated meteorological dispersion models and local emission data, in particular traffic flow data for streets and emission factors for different types of vehicles. The Airviro dispersion model (http://www.airviro.smhi.se) was used within the study cites Umeå, Uppsala, and Stockholm, and the dispersion model Enviman (http://www.environmental-expert.com/software/enviman-software-8140) within Gothenburg. A modelled yearly average for each participant was obtained using the coordinates of the participant's home address.
Statistical methods
Quality-of-life scores were presented as quartiles and results of remaining variables as mean or geometric mean with 95% CI. Kruskal-Wallis rank sum test was used to test if mAQLQ scores differed between conditions (asthma, CRS, both asthma and CRS and neither CRS nor asthma) and pairwise comparisons were conducted using Wilcoxon signed-rank test. To test if NO2 and NOx levels differed between conditions analysis of variance (ANOVA) was used. χ2 tests or ANOVA were used to test if potential confounders differed between conditions. The association between quality-of-life outcomes and concentrations of nitrogen oxides (NO2 or NOx) was evaluated using Spearman's correlation coefficient (rs). Adjustment for covariates was obtained by calculating partial correlation coefficients. Analyses of mAQLQ include only asthmatics whereas analyses of EQ-5D include all study participants. All analyses were carried out using R V.2.14.0,29 and p-values less than 0.05 were considered statistically significant.
Results
In total 941 individuals were included in the study population: 123 from Gothenburg, 263 from Stockholm, 268 from Umeå, 287 from Uppsala. The mean age in the study population was 45 years ranging between 17 and 76, and 56% were women (table 1).
Characteristics of the 941 study participants
The geometric mean of NO2 was 10.1 μg/m3 with (95% CI 9.80 to 10.5) and range 1.04–41.3, and NOx 12.1 μg/m3 with (95% CI 11.7 to 12.6) and range 3.48–64.0. NO2 and NOx were related to the city of residence (p<0.001). City-specific concentrations (geometric mean and 95% CI) of NOx within Gothenburg, Stockholm, Umeå and Uppsala were 18.9 (17.4 to 20.5), 14.7 (13.9 to 15.5), 14.8 (13.9 to 15.6) and 7.1 (6.8 to 7.5) μg/m3, respectively. The exposure to traffic pollution (levels of NO2 and NOx) did not differ between conditions (controls, asthmatics, individuals with CRS and asthmatics with CRS) (table 1). Differences between conditions were, however, found for gender, body mass index (BMI), skin prick test, FeNO, PNIF, allergic rhinitis, use of inhaled asthma medicine and odour identification, but not for age and smoking habits (table 1).
Considering the individuals with asthma, the median overall mAQLQ was 6.1 with 1st and 3rd quartiles 5.3 and 6.6, respectively (figure 1). The score was lower among those who also had CRS, median 5.6 (with 1st and 3rd quartiles 4.4 and 6.5, respectively) compared with 6.2 (5.5 –6.7), indicating a lower quality of life among individuals with asthma and CRS. Asthmatics with CRS also had a lower score among the four different domains of symptoms, activity limitations, emotional functions and effects of environmental stimuli (data not shown).
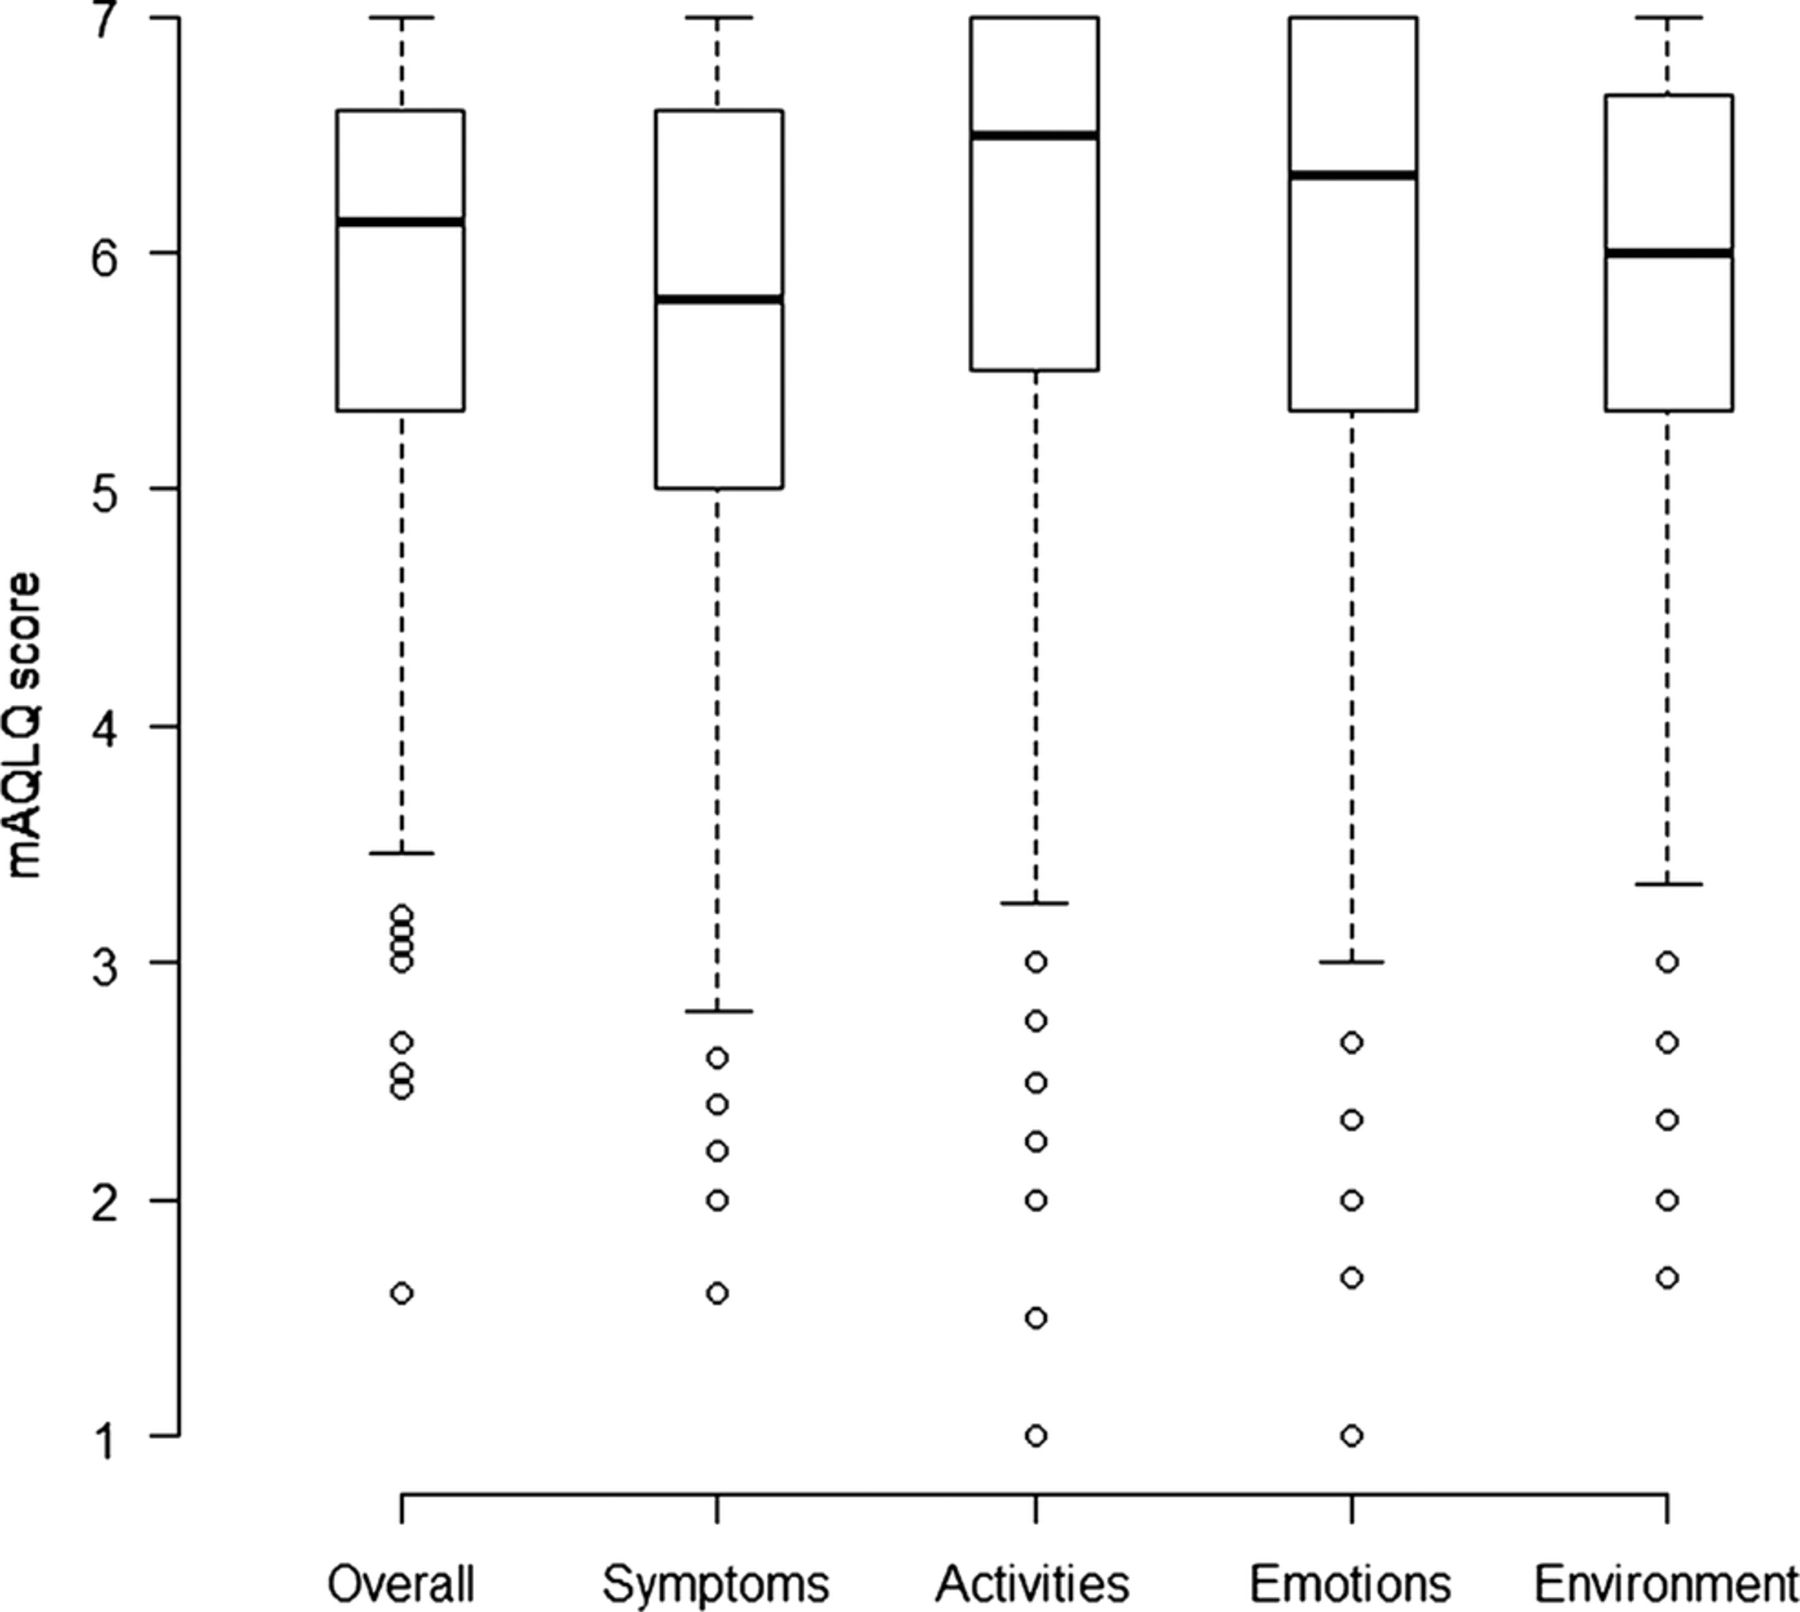
Box plot of mAQLQ scores (among asthmatics with and without chronic rhinosinusitis (CRS)).
Among all individuals in the study population the mean EQ-5D index value differed between conditions except for the two groups with either asthma or CRS who had similar values. Quartiles of EQ-5D index values among controls, asthmatics, individuals with CRS and asthmatics with CRS were 1.0 (0.85–1.0), 0.85 (0.80–1.0), 0.85 (0.80–1.0) and 0.80 (0.73–1.0), respectively. A value of one corresponds to the best possible quality of life. Within the different dimensions of EQ-5D 90%, 98%, 92%, 59% and 76% of respondents reported no impairment of mobility, self-care, usual activities (unable to perform usual activities compared with no or some problems), pain/discomfort and anxiety/depression, respectively.
The mAQLQ overall score was found associated with age, BMI, FEV1, PNIF, smell and smoking, with Spearman's correlation coefficients (rs) −0.22, −0.17, 0.20, 0.12, 0.11 and −0.13, respectively, but not with FeNO (rs=0.08). The mean EQ-5D index value was found associated with age, BMI, PNIF and smoking, with rs=−0.17, −0.20, 0.08 and −0.17, respectively, but not with FEV1, FeNO and smell (rs=0.010, 0.11 and 0.08, respectively).
The mAQLQ overall score was not found associated with levels of NO2 or NOx, with or without adjustments, and neither were the scores within each of the four domains of mAQLQ: symptoms, activity limitations, emotional functions and effects of environmental stimuli (figures 2 and 3, data not shown for NO2). Additionally, including controls, the mean EQ-5D index value, based on the five dimensions mobility, self-care, usual activities, pain/discomfort and anxiety/depression, was also found unrelated to NO2 and NOx (figure 4, data not shown for NO2). Stratification by dimension or condition did not reveal any differences in NO2 or NOx related effects (data not shown separately for conditions).

Overall mAQLQ score (among asthmatics with and without chronic rhinosinusitis (CRS)) in relation to NOx concentrations. The distribution of NOx was indicated using a box plot.
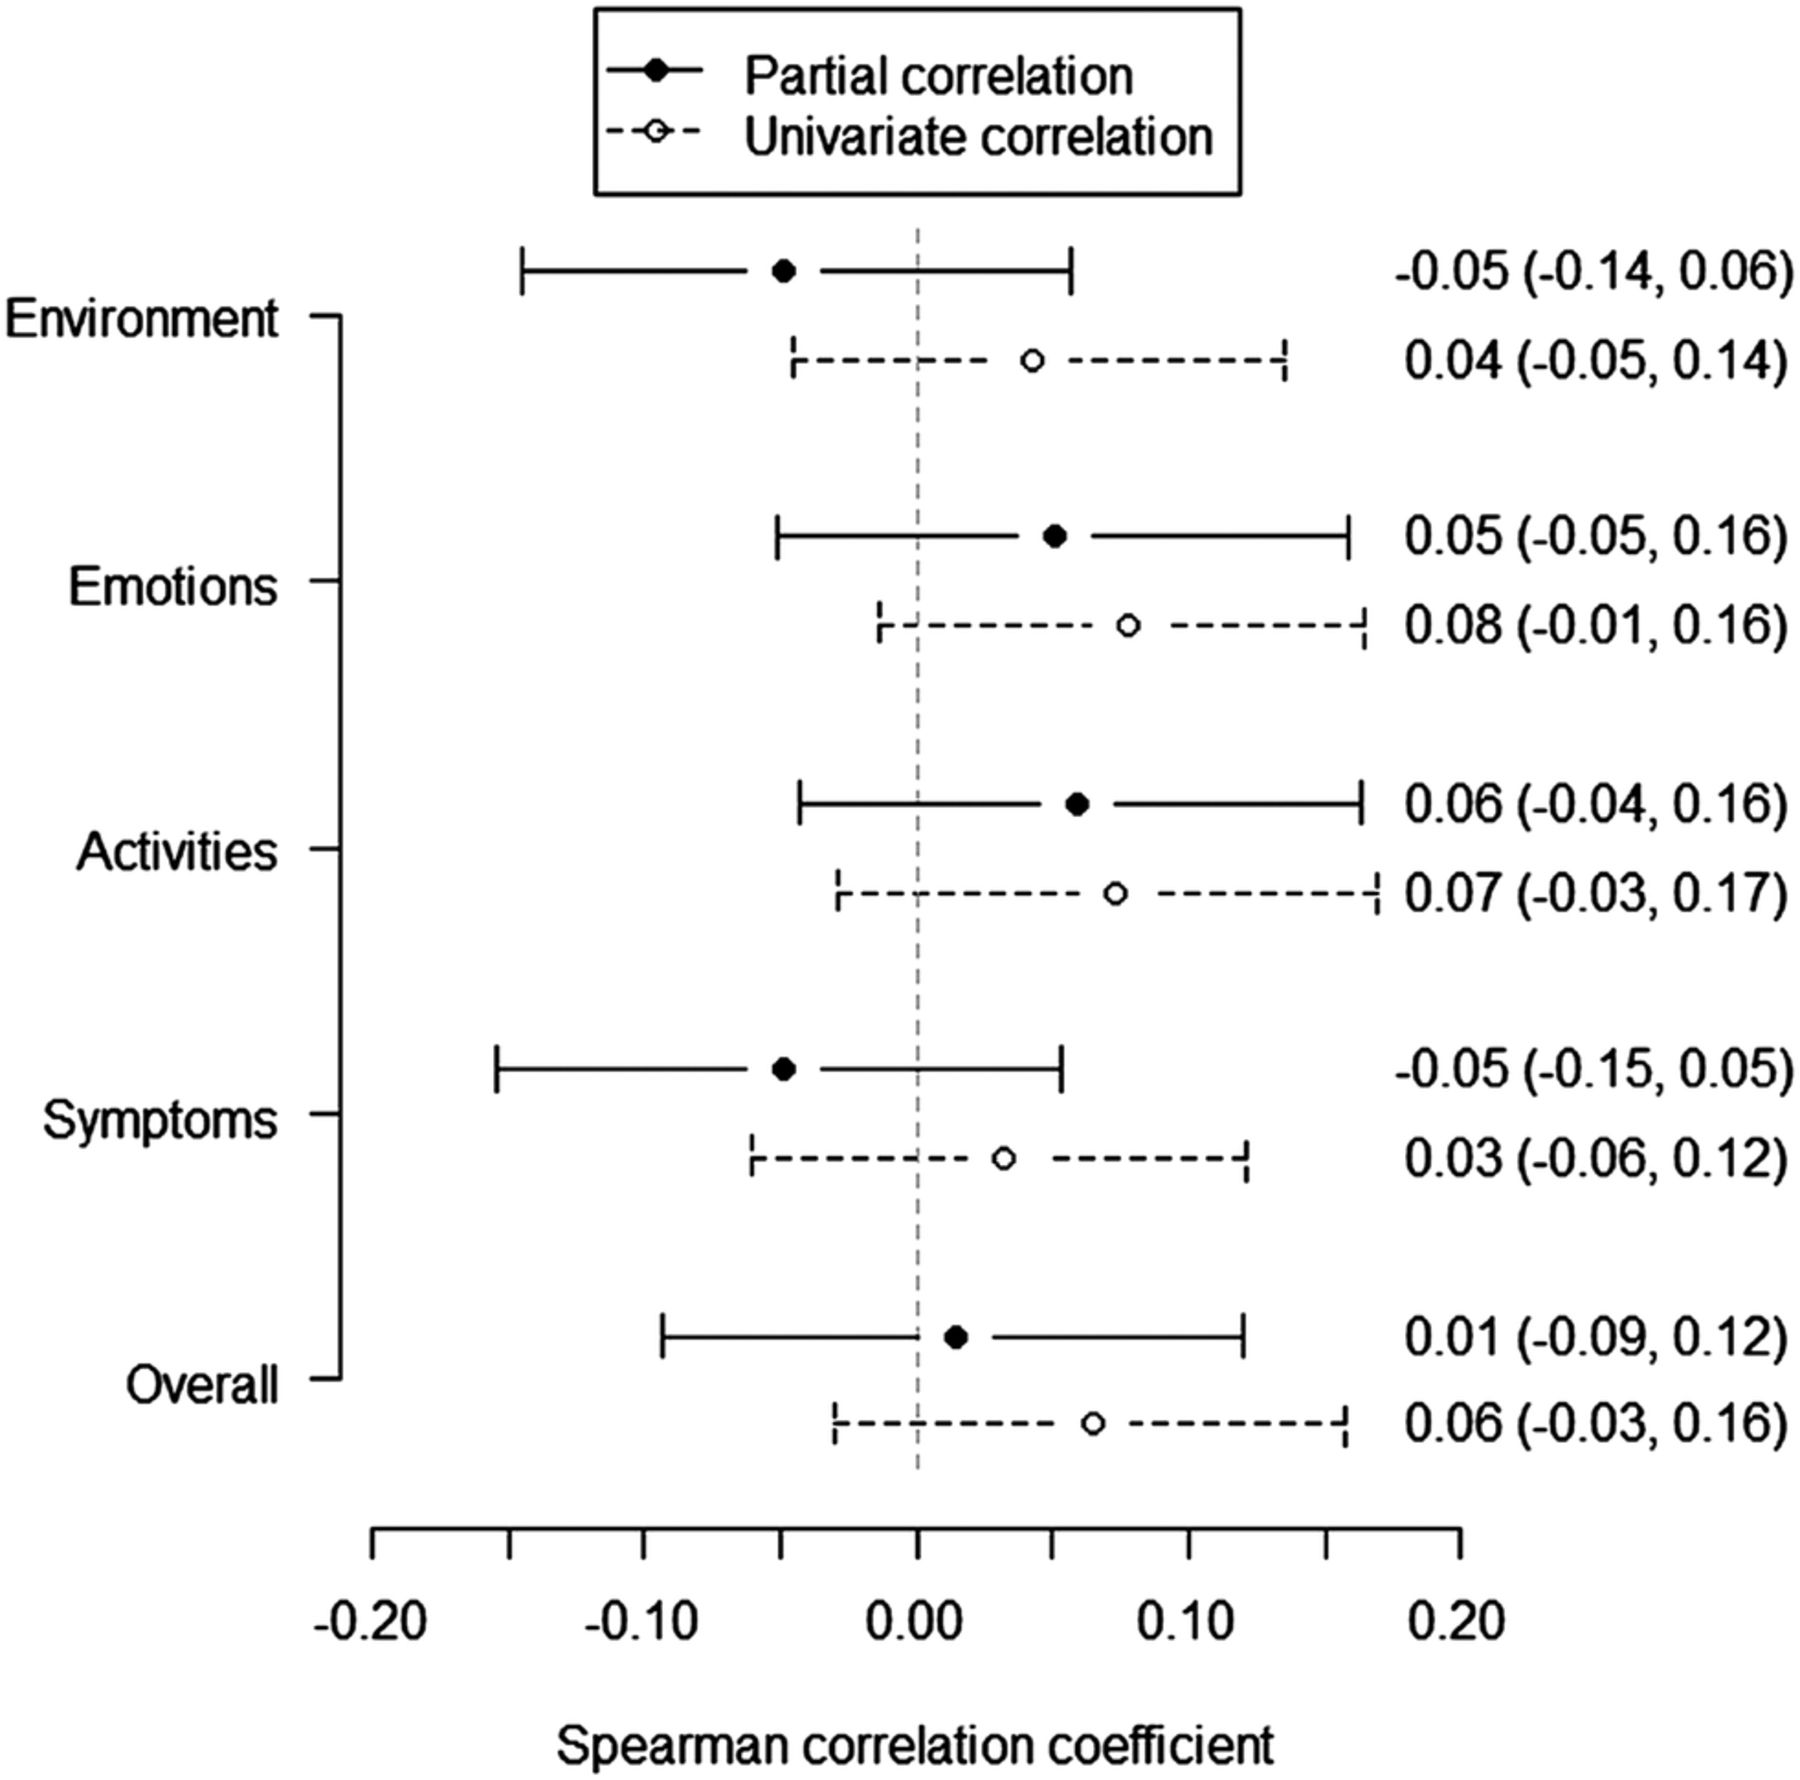
Univariate and partial correlations between mAQLQ and NOx. The partial correlation coefficient was estimated when taking into consideration centre (Gothenburg, Stockholm, Umeå and Uppsala), chronic rhinosinusitis (CRS) and the covariates in table 1. Estimates were given by Spearman's correlation coefficients with 95% CIs.

Univariate and partial correlations between EQ-5D and NOx. The partial correlation coefficient was estimated when taking into consideration condition (controls, asthmatics, individuals with chronic rhinosinusitis (CRS) and asthmatics with CRS), centre (Gothenburg, Stockholm, Umeå and Uppsala) and the covariates in table 1. Estimates were given by Spearman's correlation coefficients with 95% CIs.
Discussion
This is the first study that on an individual level assesses a possible association between exposure to traffic pollution at home (as indicated by NO2 and NOx) and quality-of-life measurements (within the general population and also specifically capturing quality of life among asthmatics and individuals with CRS). The findings suggest no association between levels of traffic pollution and quality of life at these levels of exposure.
A strength of the study is that concentrations of NO2 and NOx were modelled using a high spatial resolution (50×50 m grids) in dispersion models considering geocoded emission data and local meteorology. Owing to the spatial variability of NO2 within urban areas, there could be significant misclassification of personal exposure for individuals who spend much time in places much different than their neighbourhood.30–32 We did not, however, use personal carry on diffusive samplers, however exposure levels of NO2 and NOx at the home address have been shown to correlate closely with these assessments of cumulative daily exposure.33 Another benefit with the design of the study is that we have, apart from assessing the association between traffic pollution and quality of life among controls, specifically targeted asthmatics and individuals with CSR who may be more susceptible to traffic pollution than individuals in the general population. Additionally, when estimating the association between traffic pollution and quality of life no distributional assumption was made and no parametric assumption was made with regard to the shape of the association. Our power analyses, however, assuming a linear relation between quality of life and nitric oxides concentrations, showed that partial correlations above 0.15 and 0.10 were expected to be found statistically significant for mAQLQ and EQ-5D, respectively, when requiring 80% power of each statistical test. A benefit with regards to representativeness is the random sampling of individuals from the population, obtaining individuals from 17 to 76 years of age, however, no information was available for non-respondents and therefore a difference, in terms of the quality-of-life measures, exposure and confounders, between source population and participants cannot be excluded. A recent study of the selection bias in a population survey within partly the same population as in the current study showed that participants were more likely to be women, have university education, high income, be married and of Nordic origin compared with non-participants.34 Compared with the entire Swedish Ga2LEN Survey,35 participants (controls and asthmatics) in the current clinical follow-up study were about the same age, had the same gender distribution and had the same prevalence of smoking. There is also a possibility of unmeasured confounding related to the type of residential area, where the most important could be confounding due to susceptibility. Individuals who are more susceptible to air pollution or noise, for instance, suffer more symptoms or are more easily annoyed, may choose to live in an area with lower exposure. A variation in noise sensitivity may, of course, exist also among the controls and result in similar avoidance patterns, creating bias.
Among controls, air pollution may affect quality of life due to, for example, its association with annoyance,36 cancer37 and cardiovascular and respiratory morbidity,38 ,39 however, these effects may be greater among individuals with pre-existing respiratory diseases.
‘How controllable an individual's asthma is’ has been found correlated with the quality of life.9 According to clinical guidelines the controllability of asthma reflects the chronic and acute effects, and includes daytime and nighttime symptoms, the need for rescue treatment, exacerbations in the last year and lung function.40 ,41 Predictors of asthma control have been found to be different among corticosteroids users and non-corticosteroids users, where the predictors among corticosteroids users were chronic cough, phlegm, and female sex, and among non-corticosteroids users were high total immunoglobulin E (IgE) and sensitisation to moulds.42 ,43 Another study in addition found overweight as a predictor among corticosteroids users.44
Studies have also investigated long-term exposure to air pollution as a predictor of asthma control.15 ,45–47 In a study including five cities in France an association was found between controlled/uncontrolled asthma and concentrations of ozone and particulate matter with diameter of 10 µm or less (PM10), OR=1.69 (95% CI 1.22 to 2.34) and 1.35 (95% CI 1.13 to 1.64) for a 10 µg/m3 increase, respectively.15 No association was, however, found for NO2, OR 0.99 (95% CI 0.71 to 1.40), which agrees with current findings of no change in quality of life with NO2. Levels of NO2 were, however, considerably higher compared with the current study; mean concentration was 32.1 µg/m3 compared with geometric mean 10.1 µg/m3. According to human exposure studies, the effects of NO2 occur only at rather high concentrations, but the evidence among asthmatics is more limited (WHO Revihaap technical report 2013). The literature does not, however, support a threshold of exposure for which no adverse health effects occur, and short-term and long-term epidemiological studies have found associations with adverse health effects at concentrations at or below the current European Union limit value (40 µg/m3 of NO2). These findings are also in agreement with another French study reporting an association with ozone (OR 2.22 (95% CI 1.61 to 3.07) for a 36-day increase, equivalent to the interquartile range, in ozone-days with 8 h mean ozone above 110 µg/m3), whereas no association was found for NO2.45 A study in California observed a two-fold increase in poorly controlled asthma among asthmatic adults when comparing the highest with the lowest quintile of traffic density.46 In another study in California the odds of experiencing daily or weekly asthma symptoms increased with increasing ozone, PM10 and PM2.5 (OR 1.23 (95% CI 0.94 to 1.60), 1.29 (95% CI 1.05 to 1.57), and 1.82 (95% CI 1.11 to 2.98), per 10 µg/m3, respectively).47 Exhaust particles, including black carbon, may be of greater importance for aggravation of asthma. No study on the severity of CRS in relation to traffic pollution was found. Besides the non-adequately controlled symptomatic effects on quality of life there may also be important restrictions on social life among individuals with severe asthma. Further studies may also consider acute associations between traffic pollution and quality of life, where, for instance, associations have been found with lung function among asthmatics.48 ,49
A Norwegian study of health-related quality of life classified electoral districts into three categories according to traffic density.2 Using this rough grouping, high vehicle traffic density was reported to be associated with reduced physical health-related quality of life among women, but not among men. The association in women remained after adjustment for respiratory symptoms. A study from Japan used a 1-month mean value for NOx from the closest monitoring station to group participants into four exposure categories.1 With this crude indicator there was a significant trend with lower health-related quality of life in the domain of vitality within cities with higher exposure but not within the domains of physical functioning, role-physical, bodily pain, general health perception, social functioning, role-emotion, or mental health.
Conclusions
Within these exposure levels, traffic pollution appears not to affect quality of life among controls, asthmatics, individuals with CRS or asthmatics with CRS. This could perhaps be explained by selection bias related to susceptibility (avoidance), moderate exposure levels or confounders related to the type of residential area.
References
Footnotes
-
Preliminary results from this study has been presented at the Environmental Health Conference of ISEE, ISES and ISIAQ in Basel, Switzerland 19–23 August 2013 and at the ERS 2013 Annual Congress in Barcelona 7–11 September 2013. 50
-
Contributors S-ED, AE, BF, CJ, RM, AB were involved in design of health study and data acquisition. BF and JNS were responsible for air pollution exposure assessment. JNS was involved in statistical analysis and drafting the manuscript. All authors were involved in revision and final approval of the manuscript.
-
Funding The study was founded by the Swedish heart and lung foundation and the Västerbotten County Council (ALF).
-
Competing interests None.
-
Ethics approval The study was approved by the Regional Ethical Review Board in Stockholm, Sweden (Dnr 2008/1100-31/4).
-
Provenance and peer review Not commissioned; externally peer reviewed.
-
Data sharing statement No additional data are available.