Article Text

Abstract
Background Assessment of lung function is essential for the early screening chronic airway diseases (CADs). Nevertheless, it is still not widely used for early diagnosing CADs in epidemiological or primary care settings. Thus, we used data from the US National Health and Nutrition Examination Survey (NHANES) to discuss the relationship between the serum uric acid/serum creatinine (SUA/SCr) ratio and lung function in general adults to gain the role of SUA/SCr in early assessment of lung function abnormalities.
Methods From 2007 to 2012 NHANES, a total of 9569 people were included in our study. Using the regression model, XGBoost algorithm model, generalised linear model and two-piecewise linear regression model, the link between the SUA/SCr ratio and lung function was investigated.
Results After correcting for confounding variables, the data revealed that forced vital capacity (FVC) declined by 47.630 and forced expiratory volume in one second (FEV1) decreased by 36.956 for each additional unit of SUA/SCr ratio. However, there was no association between SUA/SCr and FEV1/FVC. In the XGBoost model of FVC, the top five most important were glycohaemoglobin, total bilirubin, SUA/SCr, total cholesterol and aspartate aminotransferase, whereas in FEV1, were glycohaemoglobin, total bilirubin, total cholesterol, SUA/SCr and serum calcium. In addition, we determined the linear and inverse association between SUA/SCr ratio and FVC or FEV1 by constructing a smooth curve.
Conclusions In the general American population, the SUA/SCr ratio is inversely linked with FVC and FEV1, but not with FEV1/FVC, according to our research. Future studies should investigate the impact of SUA/SCr on lung function and identify possible mechanisms of action.
- clinical epidemiology
- COPD epidemiology
- asthma epidemiology
- asthma in primary care
- exhaled airway markers
- oxidative stress
- respiratory measurement
Data availability statement
Data are available upon reasonable request. Data may be obtained from a third party and are not publicly available.
This is an open access article distributed in accordance with the Creative Commons Attribution Non Commercial (CC BY-NC 4.0) license, which permits others to distribute, remix, adapt, build upon this work non-commercially, and license their derivative works on different terms, provided the original work is properly cited, appropriate credit is given, any changes made indicated, and the use is non-commercial. See: http://creativecommons.org/licenses/by-nc/4.0/.
Statistics from Altmetric.com
- clinical epidemiology
- COPD epidemiology
- asthma epidemiology
- asthma in primary care
- exhaled airway markers
- oxidative stress
- respiratory measurement
WHAT IS ALREADY KNOWN ON THIS TOPIC
The outcomes of the published studies suggest that the association between serum uric acid (SUA) and lung function is still controversial. At present, there are no studies on the association between the SUA/serum creatinine (SCr) ratio and lung function parameters in general adults.
WHAT THIS STUDY ADDS
This is the first study focusing on the association between SUA/SCr ratios and lung function in the general American population and conducting the stratified analysis by race. SUA/SCr ratio is inversely associated with lung function parameters (forced vital capacity (FVC) and forced expiratory volume in one second (FEV1)).
HOW THIS STUDY MIGHT AFFECT RESEARCH, PRACTICE OR POLICY
In the general American population, the SUA/SCr ratio is inversely linked with FVC and FEV1, but not with FEV1/FVC. Future studies should investigate the impact of SUA/SCr on lung function and identify possible mechanisms of action.
Introduction
Chronic obstructive pulmonary disease (COPD) and asthma are the two major categories of chronic airway diseases (CADs) that mainly manifests as airflow limitation (AL) with high prevalence worldwide and an increasing trend year by year.1 2 According to surveys, in Japan, the prevalence of COPD and asthma with AL among patients aged more than 40 years are about 8.9% and 2.0%, respectively.3 4 And another epidemiological investigation by the Japanese Ministry of Health, Labour and Welfare reported that more than 5 million and 9 million Japanese were estimated to have COPD and asthma, respectively. Nevertheless, the actual number of reported cases of COPD and asthma is 0.2 million and 1.2 million, respectively.5 This discrepancy indicates that the CADs of reported prevalence may be much lower than the actual prevalence, and its actual morbidity has been greatly underestimated. Thus, the early screening of CADs is essential before they manifest symptoms and progression. However, patients with early-stage CADs may be either unaware of their condition or reluctant to consult their physician for respiratory symptoms.6 Assessment for lung function in medical health check-ups or general medical practice is one of the best ways to screen CADs early.7–9 Nevertheless, in general, only individuals suffering from respiratory symptoms further detect lung function. Besides, lung function assessment is not yet sufficiently widespread within medical health check-ups or primary care settings.10 11 According to a Chinese study, the rate of lung function assessment in China is low at present. Adults’ lung function assessment rate is 9.7%, and that of patients with COPD is only 12%.12 A simple biomarker used to screen for poor lung function in an epidemiological setting will be very useful for the early assessment, management and treatment of CADs.
Serum uric acid (SUA), the final product of purine degradation, can not only be used to evaluate renal function, but also be considered as a marker reflecting hypoxia status.13 14 Serum creatinine (SCr) is one of the most common biomarkers to evaluate renal dysfunction.15 And the SUA/SCr ratio is a standardised SUA index of renal function, which can better reflect the endogenous SUA level.16–18 Many studies have reported that the SUA/SCr ratio is related to the progression and prognosis of COPD, obstructive sleep apnoea, pulmonary hypertension, chronic respiratory failure and other CADs.13 19–24 From the perspective of screening, early identification of individuals with the possible risk of abnormal lung function may enable appropriate stratification of prevention and treatment.
According to reported studies, researchers attached more importance to the significance of the SUA/SCr ratio in the progression and prognosis of CADs.19–24 However, they paid less attention to early screening and identification of CADs. Currently, there are no studies on the relationship between SUA/SCr ratio and lung function parameters in the general adult population. Therefore, this study aimed to use data from the US National Health and Nutrition Examination Survey (NHANES) to discuss the relationship between SUA/SCr ratio and lung function parameters in ordinary adults, and to gain insight into the role of SUA/SCr in early assessment of lung function abnormalities.
Materials and methods
Data source
The NHANES, which was conducted by the Centers for Disease Control and Prevention of America, collected information regarding the health and nutritional status of the US population every 2 years. NHANES used a complex, stratified sampling design, which can select representative samples of non-institutionalised civilians. Participants underwent a detailed in-home interview, physical examination and blood specimen collection at specially equipped mobile examination centres.25 The Declaration of Helsinki was followed when conducting the study.26 Written informed consent was obtained from all participants prior to completing the NHANES, and all data were deidentified by the National Center for Health Statistics before being made publicly available.
Study population
Three 2-year cycle data of the NHANES survey from 2007 to 2012 were integrated into our study. These data included demographic data, medical examination–personal life history, dietary, comorbidities data and laboratory data for the second analysis. When we initially screened in the NHANES database, we found that only lung function data from 2007 to 2012 were available, so we included all participants (n=30 638) in the NHANES from 2007 to 2012. We excluded individuals: (1) aged<18 years old (n=11 823), (2) with at least one of the following factors affecting lung function testing: current chest pain; a physical problem with forceful expiration; use of supplemental oxygen; recent surgery of the eye, chest or abdomen; recent heart attack; stroke; tuberculosis exposure; coughing up of blood (n=743), (3) missing lung function test results data (forced expiratory volume in 1 second (FEV1) or forced vital capacity (FVC)) or have low data quality (data with the quality of C, D and F) (n=5663), (4) missing SUA or SCr (n=662), (5) with failing kidneys (n=229), (6) using any drugs that might affect SUA levels, including allopurinol, febuxostat, probenecid, losartan, fenofibrate, pyrazinamide, ethambutol, cyclosporine and thiazide diuretics (n=1251) and missing data about covariates at least one of the following (n=698): body mass index (BMI); physical activity; foods eaten during past 30 days; hypertension history; diabetes history; respiratory diseases history; phosphorus; total bilirubin; total protein; aspartate aminotransferase; glycohaemoglobin. Eventually, a large national representative sample (n=9569) among general American adults was included in this study. The flow chart of the screening process is shown in figure 1.

Flowchart for selecting analysed participants. FEV1, forced expiratory volume in one second; FVC, forced vital capacity; NHANES, National Health and Nutrition Examination Survey; SCr, serum creatinine; SUA, serum uric acid.
Lung function parameters assessment
Lung function was performed using Ohio 822/827 dry-roll volume spirometer and followed the recommendations from the American Thoracic Society (ATS)/European Respiratory Society (ERS).27 Variables obtained from spirometry and used in this study included FEV1, FVC and the FEV1/FVC ratio. ATS/ERS criteria regarding acceptability and reproducibility of measurements were used to grade spirometry from A to F. Grading A–B fulfilled/exceeded ATS criteria, grading C could be of use while grading D–F was less likely to be useful.28 It was worth explaining that during the test of FEV1 and FVC, to ensure the accuracy of measurement data, we only used the data with FEV1 and FVC quality grades A and B, not including the data with the quality of C, D and F.
SCr and SUA measurement
SCr and SUA were analysed on a Beckman UniCel DxC800 Synchron by Collaborative Laboratory Services, LLC. SCr was analysed using the Jaffe rate method. SUA was assessed using a timed endpoint method.
Other covariates
Other covariates were chosen a priori based on previous studies. Demographic data included gender, age (year), poverty to income ratio, race/ethnicity (Mexican American, other Hispanic, non-Hispanic white, non-Hispanic black, others), an educational level (less than high school, high school, more than high school), marital status (married, single, living with a partner). Second, we also included examination data and personal life history data involving BMI (kg/m2); physical activity (low, moderate, high); drinking (had at least 12 alcohol drinks/1 year); smoking (smoked at least 100 cigarettes in life); foods eaten during past 30 days (have you eaten shellfish, crab, fish, shrimp or other foods that affect significantly SUA levels during past 30 days); hypertension history, diabetes history and respiratory diseases history. Finally, variables of laboratory data included serum calcium (mmol/L), phosphorus (mmol/L), total bilirubin (µmol/L), total protein (g/L), aspartate aminotransferase (U/L), alkaline phosphatase (U/L), total cholesterol (mmol/L) and glycohaemoglobin (%). More details of variables could be publicly obtained on the NHANES official website (https://www.cdc.gov/nchs/nhanes/).
Statistical analysis
According to the criteria of the CDC guidelines, we conducted a statistical analysis between the SUA/SCr ratio and lung function parameters (https://wwwn.cdc.gov/nchs/nhanes/tutorials/default.aspx). SUA/SCr ratio, lung function parameters and other continuous variables were expressed as the mean±SD (normal distribution). The categorical variables were expressed in frequency or percentage. We aimed to discuss the potential correlation of selected participants between the SUA/SCr ratio and lung function parameters. First, we divided the continuous variables of SUA/SCr ratio into four quartile ratios. The weighted χ2 was used to calculate the categorical variable, and the weighted linear regression model was used to calculate the continuous variable between the quartile arrays. Second, we constructed three weighted univariate and multivariate linear regression models, including a non-adjusted model, a minimally adjusted model and a fully adjusted model, to figure out the relationship between the SUA/SCr and lung function parameters. Next, based on the fully adjusted model, subgroup analyses were performed to identify the stratified associations between SUA/SCr and lung function parameters using stratified multivariate logistic regression. Furthermore, we constructed the machine learning of the XGBoost algorithm model to predict the relative importance of selected blood biomarkers on the affection of lung function parameters. We performed the XGBoost model to analyse each variable’s contribution (gain) to lung function parameters.29 30 Finally, based on the penalty spline method, we further applied a generalised additive model (GAM) to construct a fully adjusted model with a smooth curve fit to discuss the potential linear relationship between the SUA/SCr and lung function parameters, using the SUA/SCr ratio as a continuous variable in the fully adjusted model. A two-piecewise linear regression model was applied if a non-linear correlation was detected to determine the threshold effect of SUA/SCr on lung function. When the ratio between SUA/SCr and lung function appeared obvious in a smoothed curve, the recursive method automatically calculates the inflection point, where the maximum model likelihood will be used. To prevent the bias caused by missing data, we curated the NHANES database to improve the accuracy of the analysis by using the MICE package for accounting for missing data.31 We used multiple imputation, based on five replications and the Markov-chain Monte Carlo method in the Multiple imputation of R procedure, to account for missing data on BMI, physical activity, foods eaten during past 30 days, hypertension history, diabetes history, respiratory diseases history, phosphorus, total bilirubin, total protein, aspartate aminotransferase and glycohaemoglobin. Main results of complete data were basically consistent with those of data containing missing covariates and multiple imputation data (online supplemental table 3). All in all, univariate and multivariate analysis results were based on the calculated dataset as well as Rubin’s rules. All kinds of statistical analyses of analysis were performed by R software (V.4.0.2) using the R package. The software EmpowerStats offered significant help in the analysis process, too (http://www.empowerstats.com, X&Y Solutions, Boston, Massachusetts, USA). In our study, a p value<0.05 was considered statistically significant.
Supplemental material
Patient and public involvement
Patients did not take part in the development, conduct, reporting or dissemination of this study.
Results
Characteristics of the participants
The baseline characteristics, which were weighted distribution, were shown in online supplemental table 1, including demographic data, medical examination–personal life history, dietary data, comorbidities data and laboratory data of participants selected from the NHANES (2007–2012) survey. Finally, a total of 9569 participants aged 18–79 years were included in this study. In our study, the average age of the chosen participants was 42.53 years (±16.17), and non-Hispanic whites were the main participants. Then, we divided different SUA/SCr ratios into four quartiles (Q1–Q4). We found the distribution of smoking situation, food of affecting SUA intake during past 30 days, and serum calcium in four quartiles indicated no statistical difference (p values>0.05), but other variates showed statistical difference (p values<0.05). Compared with participants with a lower SUA/SCr ratio, the participants with higher SUA/SCr were more likely to be females, young, non-Hispanic whites, married, less physical activity, with hypertension history, patients with diabetes history and without respiratory disease. Besides, participants with higher SUA/SCr had lower poverty to income ratio, higher BMI, higher education and more alcohol.
The correlation between SUA/SCr ratio and lung function parameters
We applied three weighted univariate and multivariate linear regression models to assess the correlation of SUA/SCr with lung function parameters. As shown in table 1, we found in the non-adjusted model, which adjusted for none, the SUA/SCr showed a positive association with FEV1/FVC, and FEV1/FVC increased by 0.003 for each additional unit of SUA/SCr with p for trend less than 0.05. However, the SUA/SCr showed a negative association with FVC, and FVC decreased by 39.972 for each additional unit of SUA/SCr with p for trend less than 0.05. In the fully adjusted model, which adjusted for gender, age, race/ethnicity, education level, poverty income ratio, marital status, physical activity, BMI, hypertension history, diabetes history, respiratory disease history, had at least 12 alcohol drinks/1 year, smoked at least 100 cigarettes in life, foods of affecting SUA eaten during past 30 days, serum calcium, phosphorus, total bilirubin, total protein, aspartate aminotransferase, alkaline phosphatase, total cholesterol and glycohaemoglobin, there was a positive association between SUA/SCr and FEV1/FVC without statistical significance. On the other hand, the SUA/SCr showed a negative association with FVC and FEV1 with statistical significance, FVC decreased by 47.630, and FEV1 decreased by 36.956 for each additional unit of SUA/SCr with p for trend less than 0.05.
Multivariate weighted regression model analysis reveals the associations between SUA/SCr and lung function parameters
Stratified associations between SUA/SCr ratio with lung function parameters
As shown in online supplemental table 2, based on the fully adjusted model, we further analysed stratified associations between SUA/SCr and lung function parameters in a specific subgroup by gender, age, race, education level, poverty income ratio, marital status, physical activity, BMI, respiratory disease history, smoking status, drinking status and foods of affecting SUA eaten during past 30 days. On all selected subgroup analyses, SUA/SCr had a negative relationship with FVC among the remaining subgroups, except for the subgroup of age<40, other Hispanic, non-Hispanic black, other race, single or living with a partner status, high physical activity and with hypertension history. And, SUA/SCr had a negative relationship with FEV1 among the remaining subgroups, except for the subgroup of age<40 or ≥60, Mexican American, other Hispanic, non-Hispanic black, other race, living with a partner, high physical activity and with hypertension history. However, the correlations between SUA/SCr and FEV1/FVC were not statistically significant among all subgroups. Moreover, we detected a significant difference by p for the interaction analyses. Variables of age and SUA/SCr may have an interaction effect associated with FVC (p for interaction<0.0001).
Using machine learning of the XGBoost algorithm model to explore the selected blood biomarkers’ relative importance
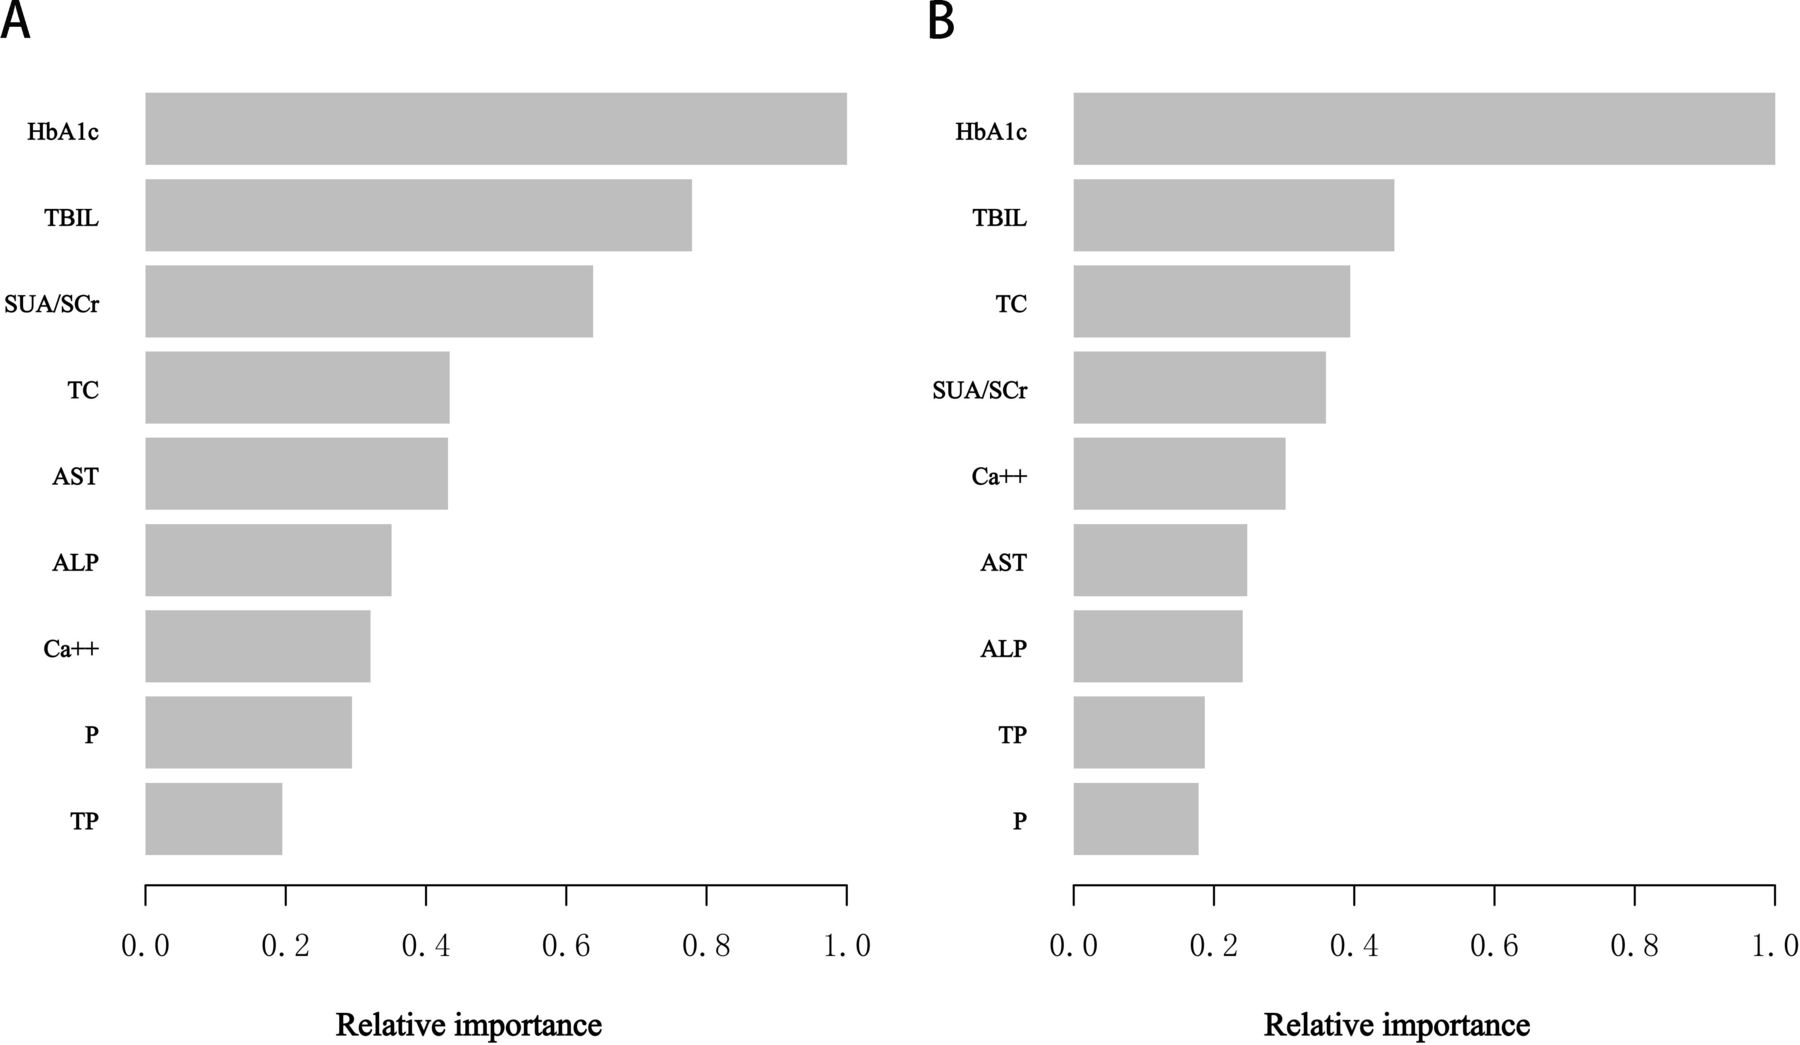
To identify which blood markers affected lung function parameters more, we constructed the XGBoost Algorithm model machine learning to determine the relative importance among all selected blood markers. According to the results of each variable’s contribution by the XGBoost model of FVC, glycohaemoglobin, total bilirubin, SUA/SCr, total cholesterol and aspartate aminotransferase were the top five most important variables of selected variables (figure 2A). But in the XGBoost model of FEV1, it could be seen that the top five important variables were glycohaemoglobin, total bilirubin, total cholesterol, SUA/SCr and serum calcium, respectively (figure 2B). Ultimately, SUA/SCr, as the relatively significant variable, was applied to constructing smooth curve models in our study.

XGBoost model revealed the relative importance of selected blood markers on the lung function parameters ((A) forced vital capacity, (B) forced expiratory volume in one second)) and the corresponding variable importance score. The x-axis showed the importance score, the relative number of a variable used to distribute the data; the y-axis indicated the selected blood markers. ALP, alkaline phosphatase; AST, aspartate aminotransferase; Ca++, Serum calcium; HbA1c, glycohaemoglobin; P, phosphorus; SUA/SCr, serum uric acid/creatinine; TBIL, total bilirubin; TC, total cholesterol; TP, total protein.
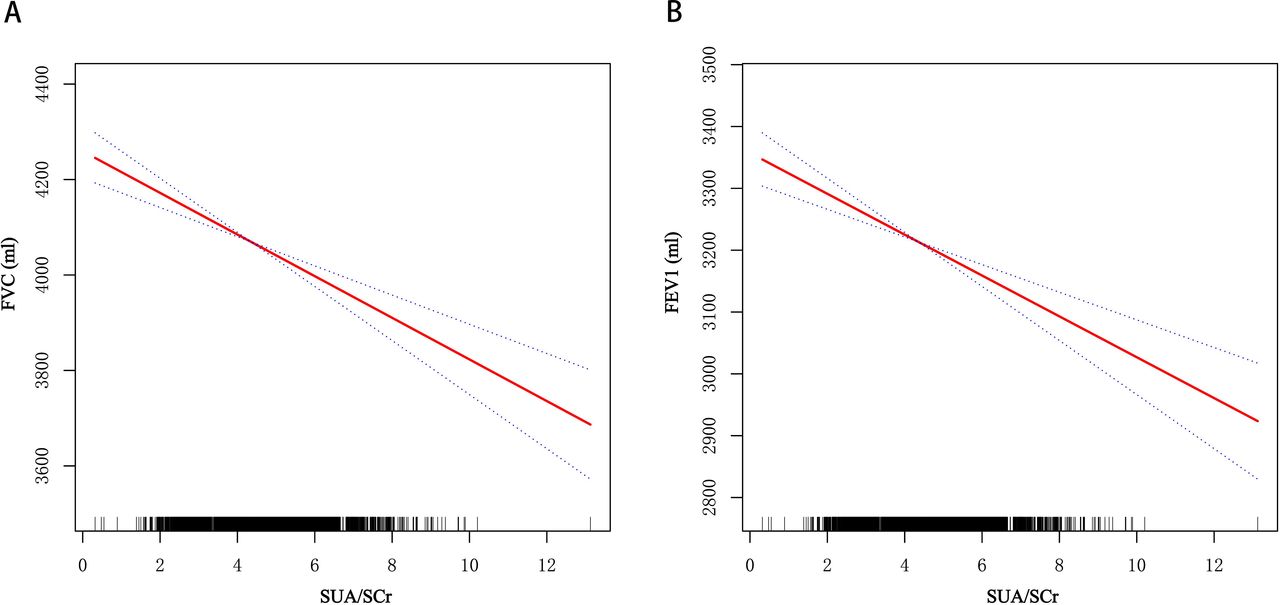
Using GAM to explore the possible linear relationship between SUA/SCr ratio and lung function parameters
To verify the reliability and stability of multivariate regression analysis results, based on the fully adjusted model, we used GAM to explore the possible linear relationship between SUA/SCr and lung function parameters. The relationship between SUA/SCr and FVE or FEV1 was approximately linear and inversely (figure 3A,B). In addition, we used the two-piecewise linear regression model to further confirm the linear relationship of SUA/SCr with lung function parameters (table 2). The log likelihood ratio test showed that p was more than 0.05, indicating no significant difference between model 1 (one-line model) and model 2 (segmented regression model). Therefore, it was more suitable to use the one-line model, and the inflection point was not statistically significant. All previous results indicated a negative and linear correlation between SUA/SCr ratio and FVC or FEV1.
Based on the fully adjusted model, the relationship between serum uric acid/serum creatinine (SUA/SCr) ratio and lung function parameters ((A) forced vital capacity (FVC), (B) forced expiratory volume in one second (FEV1)). The solid red line represented the smooth fitting curve between variables, and the blue band represented the 95% CI of the fitting.
Threshold effect analysis of between SUA/SCr and lung function parameters using the two-piecewise linear regression model
Discussion
As far as we know, our study is the first study to explore the relationship between SUA/SCr and lung function parameters among general American adults and is also one of the most extensive cross-sectional studies to explore this relationship. Based on NHANES data from 2007 to 2012, we found that the SUA/SCr was inversely associated with lung function parameters (FVC, β=−47.630; FEV1, β=−36.956) after adjusting for the demographic data, examination data, personal life history data, comorbidities data and laboratory data. To verify the accuracy and stability of this association, we conducted stratified analyses. The results indicated, among all selected subgroup analyses, SUA/SCr had a negative relationship with FVC among the remaining subgroups, except for the subgroup of age<40, other Hispanic, non-Hispanic black, other race, single or living with a partner status, high physical activity and with hypertension history; SUA/SCr had a negative relationship with FEV1 among the remaining subgroups, except for the subgroup of age<40 or ≥60, Mexican American, other Hispanic, non-Hispanic black, other race, living with a partner, high physical activity and with hypertension history. However, the correlations between SUA/SCr and FEV1/FVC were not statistically significant. In addition, we also constructed the machine learning of the XGBoost Algorithm model to determine the relative importance of selected blood biomarkers associated with lung function parameters, and SUA/SCr was the relatively more significant biomarker. SUA/SCr, as the relatively significant biomarker, was used to construct smooth curve models to further verify the robustness of the result. Finally, our study showed that based on the fully adjusted model, FVC decreased by 47.630 mL and FEV1 decreased by 36.956 mL for each additional unit of SUA/SCr, with statistical significance, but the correlation between SUA/SCr and FEV1/FVC was not statistically significant.
SUA is the final product of the metabolic conversion of both exogenous purines and endogenous purines.32 Diet (intake of purines), drugs (allopurinol, probenecid, thiazide diuretics and so on), drinking, smoking, exercise, BMI, renal dysfunction, hypertension history and diabetes history also affect SUA levels.32–38 Thus, we should take these factors into careful consideration when assessing the correlation between SUA/SCr and pulmonary function. Since UA elimination mainly occurred in urine,39 and various systemic diseases might affect SUA levels, we analysed the data by correcting the SUA for the SUA level. Interestingly, this study found that SUA/SCr ratio was inversely associated with lung function parameters (FVC and FEV1).
The results of our study are similar to those of one Japanese study and two Korean studies. The Japanese study was the community-based annual health check for the general population aged more than 40 years in Japan, which reported that lung function parameters (FEV1% predicted and FVC% predicted) were inversely associated with SUA in females.40 And two other Korean studies indicated that SUA levels were inversely correlated with FVC or FEV1 among the female general population, and there was no significant correlation between SUA and FEV1/FVC ratio.41 42 In addition, another retrospective cohort study involving 19 237 participants reported that accelerated FVC and FEV1/FVC ratio declines were observed in non-smoking individuals with increased SUA levels using linear mixed models.43 Nevertheless, our study was inconsistent with another Korean study, which demonstrated there was a significant positive relationship between SUA and lung function parameters, among 69 928 participants recruited from Kangbuk Samsung Hospital Health Screening Center, Seoul, Korea.44 The Korean study excluded the participants with a self-reported history of underlying diseases, including hypertension history, diabetes history, respiratory diseases history and so on. However, our study included a population with underlying diseases of hypertension history, diabetes history and respiratory diseases history. On account of the heterogeneity of reported researches, such as in terms of demographic data, examination data, personal life history data, comorbidities data and statistical analysis and so on, it was hard to determine the correlation between SUA and lung function, which might explain the difference in reported epidemiological researches. And we conducted relatively comprehensive stratified analysis (including demographic data, examination data, personal life history data and comorbidities data) to confirm the accuracy and stability of the results. Correspondingly, our study demonstrated the corrected SUA (SUA/SCr) was inversely associated with FVC and FEV1 in the general American population, but not associated with FEV1/FVC. Therefore, we suggested that our study results are more credible than those of previous studies.
According to previous studies, there is still controversy regarding UA’s role in inflammation.45 As an essential upper airway antioxidant, UA can eliminate reactive oxygen species (ROS) and get rid of peroxynitrite.46 UA, existing at high concentrations in the epithelial fluid of the human respiratory tract, is a significant first-line defence against ROS.47 48 On the other hand, UA serves as a proinflammatory molecule in endothelial.49 50 Some reported studies demonstrated that SUA had been suggested to serve as a biomarker of respiratory diseases such as asthma,22 51 COPD,23 24 52 53 lung cancer,54 obstructive sleep apnoea,55 pulmonary hypertension56 and chronic respiratory failure.13
The uric acid level reflects the degrees of systemic inflammation and tissue hypoxia. Several possible explanations exist for the negative association between SUA levels and lung function. First, the production of UA is induced by hypoxia in participants with impaired lung function. Elsayed et al demonstrated that experimentally induced hypoxia resulted in substantially higher UA concentrations in lung perfusate and lung tissues of animals, as compared with either normoxia or hyperoxia.57 Second, prolonged hypoxaemia may induce pulmonary hypertension, which further results in the elevation of SUA levels. Loss of pulmonary vasculature and hypoxic vascular contraction may result in pulmonary hypertension among patients with COPD. Previous studies demonstrated the correlation between pulmonary arterial pressure and SUA levels.58 59 The alteration of haemodynamics may result in an elevation of SUA. Next, systemic UA levels are related to inflammation and oxidative stress in vivo, which induces lung function damage. Bartziokas et al demonstrated that SUA levels might rise due to lung tissue damage among patients with COPD with high levels of lung oxidative stress and inflammation.24 Fourth, elevated levels of UA contribute to systemic inflammation, which eventually impairs lung function. A large number of reported studies indicated that SUA was positively associated with inflammatory markers such as leukocytes, C reactive protein and interleukin 6.60 61 Subsequently, activated inflammatory markers lead to damage to vascular endothelial cells. Alveolar septal cell apoptosis and emphysema are linked to pulmonary endothelial dysfunction. Thus, pulmonary endothelial dysfunction associated with hyperuricaemia may be related to the impairment of pulmonary function in the general population.62
As is known to us, the assessment of lung function is essential for the early screening of CADs. Even though lung function has become more accessible in recent years, it is still not widely used for diagnosing CADs in the epidemiological or primary care settings.10 11 Further campaigns are required to promote the expansion of the assessment of lung function. If a simple marker is used for screening abnormal lung function, it will be of great significance for the early identification, management, and treatment of CADs. Our study indicated that SUA/SCr was inversely associated with FVC and FEV1, but not associated with FEV1/FVC in the general population. In the future, more prospective researches should be conducted to explore the role of SUA/SCr in lung function.
Compared with previously published articles, our study has several advantages. First, our study included a large sample with a total of 9569 participants. Second, considering that other covariates may impact the results, we conducted roundly stratified analysis, which may help to find possible susceptible populations and verify the stability of the results. Next, we used the machine learning of the XGBoost Algorithm model to assess selected blood biomarkers' contribution to lung function. Finally, we constructed a smooth curve based on the fully adjusted model to explore the possible linear relationship between SUA/SCr ratio and lung function parameters.
Nevertheless, some limitations in interpreting our results need to be taken into account. First, since the NHANES database is a cross-sectional survey, we are unable to distinguish causality in our study. Thus, more prospective cohort studies are still required to verify the causality. Second, our study did not exclude participants with respiratory diseases and other comorbidities (such as hypertension and diabetes mellitus). Third, similar to other cross-sectional studies, there are still other potentially confounding factors that are not considered, though we have adjusted for many confounding factors. At last, our investigation is based on the NHANES database, which applies to the American population so generalisability is geographically restricted. More comprehensive investigations are required to determine the relationship between SUA and lung function parameter (specially FEV1/FVC) in the future.
Conclusions
In conclusion, our study indicates SUA/SCr ratio is inversely associated with FVC and FEV1 in the general American population, but not associated with FEV1/FVC. In the future, more prospective researches should be conducted to explore the role of SUA/SCr in lung function and to determine potential mechanisms of action.
Data availability statement
Data are available upon reasonable request. Data may be obtained from a third party and are not publicly available.
Ethics statements
Patient consent for publication
References
Supplementary materials
Supplementary Data
This web only file has been produced by the BMJ Publishing Group from an electronic file supplied by the author(s) and has not been edited for content.
Footnotes
JW, CW and MG contributed equally.
Contributors JW carried out the study design, data extraction and statistical analysis and drafted the manuscript. CW conducted data extraction and statistical analysis and drafted the manuscript. MG carried out the study design and revision of the paper. RZ carried out the study design. GS participated in the study design and revision of the paper. GS is the guarantor of this study. All authors read and approved the final manuscript.
Funding The authors have not declared a specific grant for this research from any funding agency in the public, commercial or not-for-profit sectors.
Competing interests None declared.
Patient and public involvement Patients and/or the public were not involved in the design, or conduct, or reporting, or dissemination plans of this research.
Provenance and peer review Not commissioned; externally peer reviewed.
Supplemental material This content has been supplied by the author(s). It has not been vetted by BMJ Publishing Group Limited (BMJ) and may not have been peer-reviewed. Any opinions or recommendations discussed are solely those of the author(s) and are not endorsed by BMJ. BMJ disclaims all liability and responsibility arising from any reliance placed on the content. Where the content includes any translated material, BMJ does not warrant the accuracy and reliability of the translations (including but not limited to local regulations, clinical guidelines, terminology, drug names and drug dosages), and is not responsible for any error and/or omissions arising from translation and adaptation or otherwise.