Article Text

Abstract
Introduction We compared the population rate of COVID-19 and influenza hospitalisations by age, COVID-19 vaccine status and pandemic phase, which was lacking in other studies.
Method We conducted a population-based study using hospital data from the province of British Columbia (population 5.3 million) in Canada with universal healthcare coverage. We created two cohorts of COVID-19 hospitalisations based on date of admission: annual cohort (March 2020 to February 2021) and peak cohort (Omicron era; first 10 weeks of 2022). For comparison, we created influenza annual and peak cohorts using three historical periods years to capture varying severity and circulating strains: 2009/2010, 2015/2016 and 2016/2017. We estimated hospitalisation rates per 100 000 population.
Results COVID-19 and influenza hospitalisation rates by age group were ‘J’ shaped. The population rate of COVID-19 hospital admissions in the annual cohort (mostly unvaccinated; public health restrictions in place) was significantly higher than influenza among individuals aged 30–69 years, and comparable to the severe influenza year (2016/2017) among 70+. In the peak COVID-19 cohort (mostly vaccinated; few restrictions in place), the hospitalisation rate was comparable with influenza 2016/2017 in all age groups, although rates among the unvaccinated population were still higher than influenza among 18+. Among people aged 5–17 years, COVID-19 hospitalisation rates were lower than/comparable to influenza years in both cohorts. The COVID-19 hospitalisation rate among 0–4 years old, during Omicron, was higher than influenza 2015/2016 and 2016/2017 and lower than 2009/2010 pandemic.
Conclusions During first Omicron wave, COVID-19 hospitalisation rates were significantly higher than historical influenza hospitalisation rates for unvaccinated adults but were comparable to influenza for vaccinated adults. For children, in the context of high infection levels, hospitalisation rates for COVID-19 were lower than 2009/2010 H1N1 influenza and comparable (higher for 0–4) to non-pandemic years, regardless of the vaccine status.
- COVID-19
- respiratory infection
Data availability statement
No data are available. All databases used for this study were made available through British Columbia COVID-19 Cohort (BCC19C), a public health surveillance platform integrating COVID-19 datasets (testing, cases, hospitalisations, vaccinations) with administrative data holdings for the BC population (eg, medical visits, hospitalisations, emergency room visits, prescription drugs, chronic conditions, vital statistics). The BCC19C was established and is maintained through operational support from Data Analytics, Reporting and Evaluation (DARE), and BC Centre for Disease Control (BCCDC) at the Provincial Health Services Authority. We are not permitted to share these data. BCC19C data are only available to researchers who request and meet the criteria for access.
This is an open access article distributed in accordance with the Creative Commons Attribution Non Commercial (CC BY-NC 4.0) license, which permits others to distribute, remix, adapt, build upon this work non-commercially, and license their derivative works on different terms, provided the original work is properly cited, appropriate credit is given, any changes made indicated, and the use is non-commercial. See: http://creativecommons.org/licenses/by-nc/4.0/.
Statistics from Altmetric.com
WHAT IS ALREADY KNOWN ON THIS TOPIC
During early periods of the COVID-19 pandemic, studies demonstrated that individuals hospitalised with COVID-19 generally experienced more severe outcomes compared with historical cohorts of patients with influenza.
WHAT THIS STUDY ADDS
This study captures population and health system level burden of influenza and COVID-19 hospitalisations, filling an important gap in the literature comparing the two diseases, which is mostly focused on in-hospital outcomes.
Our study shows a ‘J’ shaped hospitalisation rates by age groups for both COVID-19 and seasonal influenza.
Among adults, at the time of more restriction in place and mostly unvaccinated population, COVID-19 hospitalisation rates were much higher than influenza, but during Omicron era, in mostly vaccinated population and with fewer public health measures, hospitalisation rates were comparable.
In the paediatric population, COVID-19 hospitalisation rate was similar to or lower than influenza.
HOW THIS STUDY MIGHT AFFECT RESEARCH, PRACTICE OR POLICY
Results of this study puts COVID-19 in the context of seasonal influenza, a familiar pathogen for which there is past experience and existing protocols.
Findings can be used to inform assumptions that go into various planning scenarios and projections, and allocation of resources in order to reduce morbidity and mortality.
Introduction
On 11 March 2020, the WHO declared COVID-19 a global pandemic. Characteristics of this new respiratory disease were inevitably compared with seasonal influenza given both are respiratory diseases with similar symptom profiles although different mutation rates (although SARS-CoV-2 is being hypersequenced). However, studies suggested COVID-19 was associated with higher mortality, infectivity, along with a number of clinical differences.1 2 Each year in Canada (population 38.7 million) in the context of partially vaccinated population, it is estimated that influenza leads to approximately 12 000 hospitalisations.3 In contrast, there have been close to 150 000 COVID-19 related hospitalisations in Canada during the course of 2 years of the pandemic.
There is a paucity of comparative studies on the respective morbidity and population burdens of COVID-19 and influenza epidemics, in particular by age and vaccination status.1 2 Instead, most comparative analyses have focused on severe outcomes among people who are already in hospital.2 4–7 Although data have shown higher disease severity for COVID-19 compared with seasonal influenza among in-hospital populations,2 8 it is still unclear to what extent this is reflected at the population level or how rate of hospitalisation for COVID-19 differs from influenza seasons with differing severities.
The epidemiology of COVID-19 is continually evolving as new variants emerge, new treatments are approved and population immunity changes. The most recent variant (Omicron) in particular exhibits a different clinical and epidemiological profile.9–12 Before Omicron emerged, all homologous or heterologous mRNA and/or ChAdOx1 two-dose schedules were associated with ≥90% reduction in SARS-CoV-2 hospitalisation risk for up to 5–7 months13–15 while vaccine effectiveness against hospital admission due to the Omicron variant at 3 months or longer fell to 54%–55%.16 17 However, vaccine effectiveness against influenza hospitalisation has historically varied by age and ranged from negative values (when vaccine components were antigenically distinct from the epidemic strain) to ~80% (in case of high match).18–21 During the course of the COVID-19 pandemic, vaccination status of the Canadian population dramatically shifted from 100% unvaccinated in 2020 to over 90% of those vaccinated with at least one dose (aged 12 years and over) by the end of 2021. In contrast, pre-pandemic historical coverage (2015–2019) for influenza vaccination in British Columbia has been ~30% (aged 12 and over), ranging from ~20% in 18–34 year olds to ~60% in 65+ year olds.22
As jurisdictions transition to COVID-19 endemicity and co-circulation with influenza, comparing population burden of hospitalisations primarily due to COVID-19 to historical influenza seasons is vital for informing healthcare planning. Going forward, understanding the potential burden of COVID-19 on the healthcare system relative to more familiar respiratory pathogens will be important to policymakers contemplating a sustainable approach that balances public health measures with their unintended consequences. In this study, we compared the population rate of hospital admissions primarily due to COVID-19 and influenza by age, COVID-19 vaccine status and pandemic phase among residents of British Columbia, Canada.
Method
Data source
This study used data from the British Columbia COVID-19 Cohort (BCC19C), a public health surveillance platform integrating COVID-19 datasets (testing, cases, hospitalisations, vaccinations) with other administrative data and registry holdings for the BC population (see online supplemental table S1 for list of linked datasets for the current study).
Supplemental material
Influenza and COVID-19 hospitalisations were identified from the Discharge Abstract Database (DAD) integrated within the BCC19C platform.23 DAD data capture admissions, discharges, transfers and deaths occurring in acute care hospitals in BC. International Classification of Diseases 10th revision (ICD-10) codes are used for diagnostic coding. Other linked datasets were used to measure covariates, as described below.
Study design, setting and participants
BC is the westernmost province of Canada, with a population of 5.26 million individuals and universal healthcare coverage. We created retrospective cohorts of patients admitted to hospital due to COVID-19 or influenza. Each cohort was divided into annual (12 months) and peak (10 weeks) cohorts based on date of hospitalisation. In the annual cohort analysis, we compared hospitalisation rates (COVID-19 vs influenza) when the majority of the BC population were unvaccinated for COVID-19. In the peak cohort comparison, we included the peak of the first Omicron wave in BC and stratified COVID-19 rates by vaccination status. Data on influenza vaccination were not available in order to stratify influenza hospitalisations by vaccination status. For both influenza and COVID-19, we selected the first hospitalisation episode per each individual for each peak/annual period. If transferred, we captured the final discharge date for length of stay (LOS) in hospital or intensive care unit (ICU) calculation. Non-residents of BC were excluded (online supplemental figure S1).
COVID-19 hospitalisation
We used the ‘U07’ diagnostic code to identify COVID-19 hospitalisations in the DAD dataset, but excluded those with ‘U07.2’ (virus not identified), consistent with previous research.24 To avoid counting so-called ‘incidental’ hospitalisations (patients who are hospitalised for non-COVID-19 reasons but test COVID-19 positive during routine screening), we focused on hospitalisations with the ‘U07’ code in the most responsible diagnosis field.
To capture a period when most of the BC population was unvaccinated and public health restrictions were in place, the annual cohort included all patients hospitalised for COVID-19 between March 2020 and February 2021, by the end of which less than 10% in each age group had received at least one dose vaccine. For the peak cohort, we included individuals admitted to hospital during a period when the rate of COVID-19 hospitalisations was the highest and when fewer restrictions were in place (the first 10 epidemiologic weeks of 2022 when Omicron was dominant, 2 January 2022 to 12 March 2022).
Influenza hospitalisations
In the absence of harmonised laboratory testing information for the whole province to confirm presence of influenza virus, we applied a validated algorithm (FLU2) to the DAD dataset.25 The FLU2 ICD-10 codes included J09, J10.0, J10.1, J10.8, J11.0, J11.1 and J11.8. We further validated the algorithm using data from one region in BC for which influenza test results were available (see Sensitivity Analysis).
Since influenza seasons from 2020 to 2022 were atypical, we selected three different historical seasons of varying severity and circulating strains to ensure a more balanced comparison to COVID-19. We chose influenza seasons with a single peak in order to be consistent with our Omicron period (single peak) and to capture a continuous 10 epidemiologic week period of highest levels of hospitalisation activity. Influenza 2009/2010 was characterised by the H1N1 pandemic, which caused severe disease in younger people, but was less potent in the elderly. Influenza 2015/2016 was characterised by mild influenza A (H1N1) and B (Victoria) activity and mainly affected children, whereas the circulating strain in 2016/2017 was severe influenza A (H3N2) and mainly affected older adults. The peak cohorts included a data-driven 10-week peak of hospital admissions: 27 September 2009 to 5 December 2009 (influenza 2009/2010); 24 January 2016 to 2 April 2016 (influenza 2015/2016) and 11 December 2016 to 18 February 2017 (influenza 2016/2017). Annual (12 months) cohorts included hospitalisations between September and August comprising the above influenza peaks (2009/2010, 2015/2016, 2016/2017).
Variables
Definitions for variables of interest are presented in online supplemental table S2. Baseline characteristics of admitted patients included age, sex, health authority of residence, number of comorbidities and COVID-19 vaccination status where available. Missing information was categorised as ‘Unknown’. Patients’ clinical outcomes were measured, including median LOS in hospital, proportion admitted to ICU and median LOS in ICU.
Statistical analysis
Descriptive
We summarised baseline characteristics and outcome by frequencies (%) and by median (Q1–Q3) for categorical and continuous variables, respectively. We analysed the statistical differences between COVID-19 and influenza cohorts using χ2 test or Mann-Whitney U test.
We compared influenza and COVID-19-related hospitalisation rates per 100 000 population for both the annual and peak cohorts. Rates were calculated by dividing the total number of hospitalisations by population denominators obtained from census-based BC Stats Population Estimates and Projections (PEOPLE)26 or from Provincial Immunization Registry data for COVID-19 vaccinated denominators. Unvaccinated denominators were calculated by subtracting the vaccinated population from the total PEOPLE population. For vaccinated denominators, we selected the population size on 5 February 2022, which is the middle date for the 10-week peak.
Sensitivity analysis and validation
In a sensitivity analysis, we identified influenza hospitalisations using a different approach and compared with our primary analysis. Influenza testing data was linked to DAD to identify all hospitalisations (regardless of ICD-10 codes) within 3 days of a laboratory-confirmed influenza diagnosis. We limited this sensitivity analysis to one of the most populous regional health authorities, Vancouver Coastal Health (VCH population 1.26 million, 24% of BC population), for which influenza testing data were complete (data for other regions were not complete—precluding the use of this approach for the primary analysis). Using hospitalisations with a confirmed positive influenza test as the gold standard, we calculated sensitivity, specificity, positive predictive value and negative predictive value of the ICD-10 FLU2 approach used in our primary analysis. We also compared hospitalisation rates using the two approaches.
In a separate sensitivity analysis, to control for the possible impact of death on LOS, we measured clinical outcomes after excluding in-hospital deaths.
Analyses were conduced using SAS V.9.4, and graphs were produced using R Studio V.3.6.2.
Results
Study participants
Our peak analysis during Omicron era and in the context of mostly vaccinated population (>90%) included 2561 COVID-19 hospitalisations. Numbers of influenza hospitalisations were lower: 1395 (2009/2010), 655 (2015/2016) and 1443 (2016/2017) (table 1, online supplemental figure S1). Similarly, the annual analysis during first year of the pandemic in the context of mostly unvaccinated population included 3097 COVID-19 hospitalisations and the number of influenza hospitalisations for 2009/2010, 2015/2016 and 2016/2017 were 1560, 1057 and 2025, respectively (online supplemental table S3, online supplemental figure S1).
Baseline characteristics of patients hospitalised for COVID-19 during the first 10 weeks of 2022 (Omicron era) and for seasonal influenza, the 10-week peak of 2009/2010 (H1N1 pandemic), 2015/2016 (higher severity in children) and 2016/2017 (higher severity in adults), British Columbia, Canada
Patient baseline characteristics
Baseline characteristics of hospitalised patients are presented in table 1 (peak analysis) and online supplemental table S3 (annual analysis). In both cohorts, a higher proportion of COVID-19 hospitalisations were male relative to influenza. The age distribution differed by influenza seasons. Similar to COVID-19 with median age 71 (Q1, Q3: 58, 82), influenza 2016/2017 mostly affected older adults, with a median age of 77 years (62, 87). In contrast, influenza 2015/2016 (median: 56, Q1, Q3: 26, 72) and particularly influenza 2009/2010 (H1N1; median: 39, Q1, Q3: 15, 55) affected younger individuals (table 1). Similar findings were observed for the annual analysis (online supplemental table S3). Among children <18, the highest proportion of hospitalisations were among 0–4 year olds for both COVID-19 and influenza. Among adults >50, the proportion of patients increased by age for COVID-19 and all influenza seasons except for 2009/2010, likely due to previous exposure to H1N1 among older adults. The majority of individuals hospitalised for COVID-19, influenza 2015/2016 and influenza 2016/2017 had four or more comorbidities, whereas the majority of hospitalised patients for influenza 2009/2010 had 0–1 comorbidities.
Patient outcomes
In the peak analysis, the overall median (Q1, Q3) for LOS in the hospital due to COVID-19 was 6 days (3, 13), which was same as the severe influenza year (2016/2017) but higher than other influenza years (table 2). In the annual analysis, LOS for COVID-19 was significantly higher than all influenza years (online supplemental table S4). In age-stratified analyses, median LOS was higher for COVID-19 patients (vs influenza) among 40+ and 12+ years of age for peak and annual analysis, respectively, and comparable/lower for other ages. In both cohorts, children 0–4 years of age with COVID-19 had shortest LOS compared with influenza. A higher proportion of patients with COVID-19 went to ICU (33%) with longer median of stay (8 days (Q1, Q3 4, 16)) compared with influenza in the annual analysis (median between 5 and 6). In the peak analysis patients with influenza 2015/2016 had the highest proportion admitted to ICU (23%) and median LOS in ICU (7 (3, 13)) with the notable spike among 50–59-year-old patients. ICU proportion and stay was not significantly different between COVID-19 and influenza 2009/2010.
Outcome of patients hospitalised for COVID-19 during the first 10 weeks of 2022 (Omicron era) and for influenza, the 10-week peak of 2009/2010 (H1N1 pandemic), 2015/2016 (higher severity in children) and 2016/2017 (higher severity in adults) by age group, British Columbia, Canada
Hospitalisation rates
Annual analysis
In the annual analysis (first year of the pandemic; largely unvaccinated population; restrictions in place), the COVID-19 hospitalisation rate by age group was ‘J’ shaped, similar to influenza 2016/2017 (partly vaccinated population; no restrictions in place) (figure 1). Among individuals 0–17 years of age, COVID-19 hospitalisations rate was significantly lower than all annual cohorts of influenza. However, the COVID-19 hospitalisation rates were significantly higher than influenza 2015/2016 and 2016/2017 among individuals 18+ years of age, and comparable to the severe influenza year (2016/2017) among 70+ (figure 1). Compared to influenza 2009/2010, the rate for COVID-19 was significantly lower among 18–29 years, and very similar among 30–39.
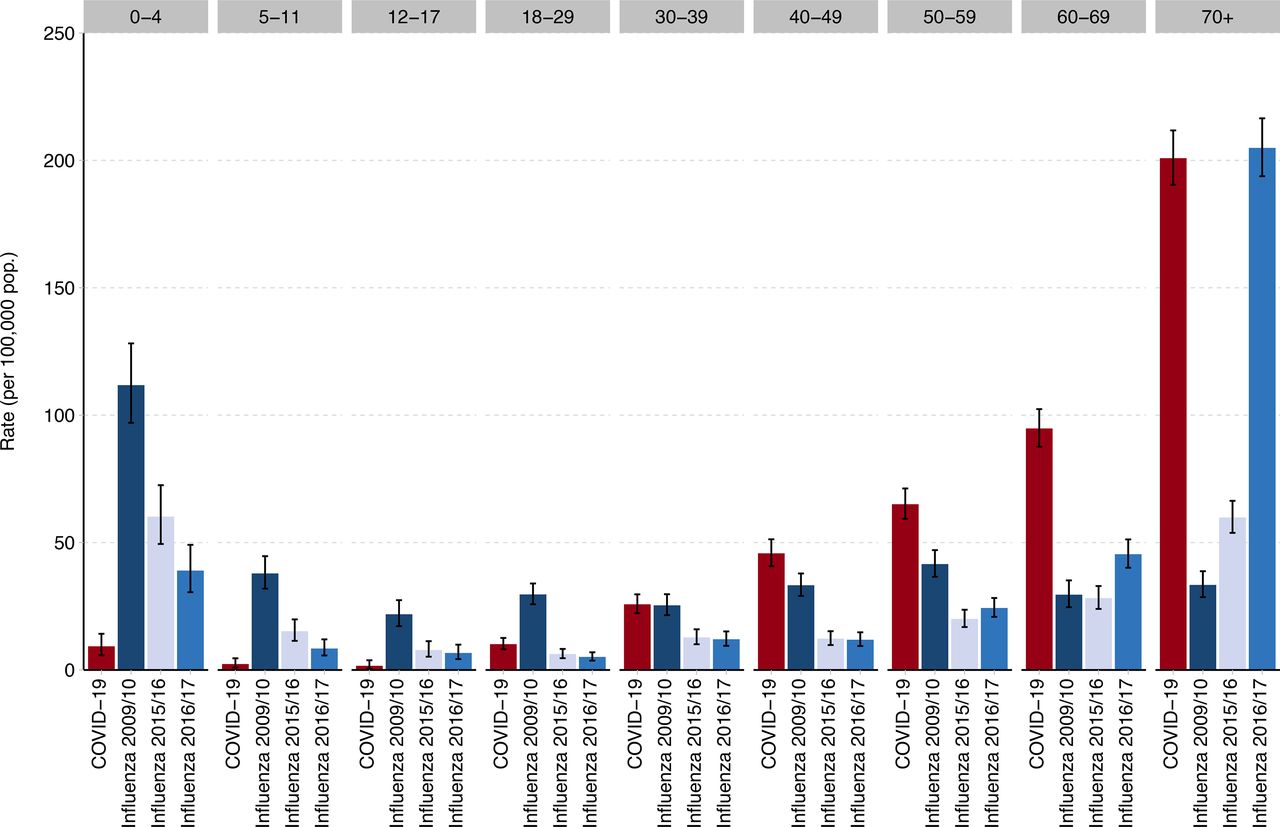
Annual hospitalisation rates for patients hospitalised for COVID-19 (2020/2021) compared with annual hospitalisation for influenza in 2009/2010 (H1N1 pandemic), 2015/2016 (higher severity in children) and 2016/2017 (higher severity in adults), by age group, British Columbia, Canada. For annual COVID-19 cohort, we included all patients hospitalised for COVID-19 from March 2020 to February 2021. For influenza, we selected three 12-month periods from September to August of each year.
Peak analysis
The peak analysis (Omicron era; largely vaccinated population; fewer restrictions) revealed similar trends. COVID-19 hospitalisations again displayed a ‘J’ shaped trend, with the rate of hospitalisation for COVID-19 increasing by age in adults (figure 2). The estimated rate of hospitalisation for COVID-19 per 100 000 population (57 (95% CI 48 to 68)) in unvaccinated 0–4 year olds was about 5–6 times higher compared with unvaccinated older children 5–11 (12 (7 to 18)) and 12–17 year olds (10 (2 to 28)).

Population rate of patients hospitalised for COVID-19 (excluding unvaccinated 18+) during the first 10 weeks of 2022 (Omicron era) and for influenza, the 10-week peak of 2009/2010 (H1N1 pandemic), 2015/2016 (higher severity in children) and 2016/2017 (higher severity in adults), by age group and COVID-19 vaccine status, British Columbia, Canada. For the peak COVID-19 cohort, we included all patients hospitalised for COVID-19 during the first 10 weeks of 2022 when Omicron was dominant and >90% of adults in British Columbia were vaccinated with at least two doses. For influenza peak analysis, we selected data-driven 10-week peak from each season during which the majority of all hospitalised cases of the year were admitted.
Similar to annual analysis, hospitalisation rates among those unvaccinated for COVID-19 were significantly higher than influenza years for individuals aged 18+ years (online supplemental figure S2). The same was not true for unvaccinated individuals 5–17 years old, for whom hospitalisation rates for COVID-19 remained lower or comparable to influenza. Kids 0–4 year olds were all unvaccinated during study period. These kids had higher hospitalisation rates compared with influenza 2015/2016 and 2016/2017 and lower than 2009/2010.
The rates significantly dropped among vaccinated adults. Rates among vaccinated adults 18+ were comparable with influenza 2016/2017 for all age groups except those 70+ (higher for influenza). Rates for 12–49 year olds were comparable to a milder influenza year (2015/2016). Hospitalisations rates for pandemic influenza 2009/2010 were higher than COVID-19 among 0–59 years of age and lower among 60+, again likely attributable to prior exposure (figure 2).
Sensitivity analysis and method validation
When comparing case ascertainment using lab-based data to the primary analysis whereby we relied on administrative health data, we demonstrated overall good sensitivity across all influenza seasons with 88% (95% CI: 82 to 93), 70% (64 to 76), 75% (71 to 78) for 2009/2010, 2015/2016 and 2016/2017, respectively (online supplemental table S5). Further, overall population level rate estimates were comparable using ICD codes versus positive lab-confirmed influenza tests in all influenza years, with overlapping CIs (online supplemental figure S3). We explored patient outcomes when excluding in-hospital death and we did not observe any significant differences (data now shown).
Discussion
We created retrospective, population-based cohorts of COVID-19 and influenza hospitalisations in order to compare population burden of hospitalisations. Our comparisons varied by phase of the COVID-19 pandemic (pre-Omicron, Omicron) and historical influenza season (2009/2010, 2015/2016, and 2016/2017). Pre-Omicron in the context of a largely unvaccinated population and strong public health measures, COVID-19 hospitalisation rates among adults were generally higher than non-pandemic influenza rates (2015/2016, 2016/2017), with the exception among individuals age 70+ during the severe influenza year of 2016/2017. In contrast, at the peak of Omicron and in the context of a largely vaccinated population and fewer restrictions, hospitalisation rates among adults for COVID-19 were similar to non-pandemic historical influenza rates. Findings among children (0–17 years of age) were different from adults, with COVID-19 hospitalisation rates generally comparable or lower than influenza regardless of vaccination status or COVID-19 pandemic phase.
Compared to 2009/2010 influenza pandemic, the rates were lower among 0–49-year-old COVID-19 patients during Omicron-dominant period, similar among 50–69 year olds, and higher among 70+ year olds. Rates among vaccinated adults 18+ were comparable with influenza 2016/2017 for all age groups except those 70+ (higher for influenza). Unvaccinated adults (18+) remained at risk with significantly higher COVID-19 hospitalisation rates. In contrast, among 0–17-year-old children, COVID-19 hospitalisation rates in the first 2 years of the pandemic were comparable or lower than influenza regardless of vaccination status or circulating variant. The exception was among 0–4-year-old kids during Omicron, who had higher rates compared with non-pandemic influenza years. This may be due to higher incidence rate in this age category during Omicron. Canadian National Advisory Committee on Immunization reported that increased COVID-19 associated hospitalisation rates across paediatric populations are consistent with increased seroprevalence rates across all age groups since Omicron became the predominant variant.27 Specifically, seroprevalence study in BC showed that at least 63% of children under the age of 5 were infected by March 2022, at time when few were vaccinated.28
To the best of our knowledge, we could only compare our annual analysis findings with published literature due to unavailability of population-level studies since Omicron emerged. Our findings are similar to other studies reporting higher rates of hospitalisation for COVID-19 compared with influenza in unvaccinated populations in the early phases of the pandemic.2 7 In a French study, there were about two times the number of COVID-19 hospitalisations in a 2-month period (89 530; 1 March to 30 April 2020) compared with a 3-month period for seasonal influenza (n=45 819; 1 December 2018 to 28 February 2019).2 In an analysis comparing COVID-19 in a 2-month period in 2020 to the previous five influenza seasons (8 months each) at a large hospital in Boston, there were 582 COVID-19 hospitalisations compared with an average of 210 influenza admissions.7 Both COVID-19 and influenza 2016/2017 had ‘J’ shaped age-specific hospitalisation rate curves, with higher rates at the extremes of age. Similar to the French study,2 the rate of hospitalisations in our annual analysis was >4 times higher for influenza than COVID-19 among children <18 years, while the rates were significantly lower for influenza 2015/2016 and 2016/2017 among 18–69 and comparable among 70+ years. In a US-based surveillance study focused on children, the COVID-19 hospitalisation rate from October 2020 to September 2021 was similar/lower to historical influenza seasons among children 0–11, but higher among adolescents aged 12–17.4 Importantly, the relative difference between COVID-19 and influenza is likely underestimated in these comparisons due to strong public health measures implemented during COVID-19 (and thus reduced population contact rates), widespread influenza vaccination coverage, and prior influenza infection conferring protection from severe disease.
Moreover, we found that COVID-19 hospitalisation rates in individuals vaccinated with two or more doses (≥1 doses among 5–11 years), dropped significantly compared with unvaccinated individuals. The rates became generally comparable to influenza rates in individuals aged 12–69. This should be interpreted in the context of influenza vaccination coverage in BC population being ~30% for individuals aged 12–64 and ~60% for individuals aged 65 and over22 as well as some cross-protection from previous influenza seasons.
Our results need to be interpreted in the context of public health measures in place in BC throughout the first 2 years of the pandemic, diminishing the potential impact of COVID-19. These included testing within 24 hours for those who qualified, isolation and contact tracing for every case and contact, limits and restrictions on public and private gatherings, and mask wearing during periods of higher transmission. Businesses and schools adopted safety plans, and long-term care facilities were required to take preventive and outbreak measures at the order of Medical Health Officers. With the exception of a 9-week closure in March 2020, schools remained open for the entire duration of the pandemic. Nonetheless, extracurricular activities and gatherings were limited, reducing the contact rate among children and youth. In contrast, influenza hospitalisations represent pre-pandemic time periods without public health measures in place.
Median age of 67 for hospitalised patients in the annual analysis was comparable with prior estimates, which ranged from 62 to 68.2 6 7 Similar to other studies, we found that COVID-19 hospitalised patients were slightly more likely to be male.1 2 5 6 The majority of patients admitted for COVID-19 and non-pandemic influenza years had ≥4 comorbidities, suggesting that a majority of admitted patients for COVID-19 or influenza were already at risk for complicated progression. Other studies also found that ~60% of COVID-19 and influenza-related hospitalised cases were previously diagnosed with hypertension.6 7 Similarly about 70% of hospitalised patients for COVID-19 or influenza in France had Elixhauser comorbidity score greater than zero.2 6 In our study, patients with COVID-19 had an overall longer hospital stay in the annual analysis while the length was not significantly different from influenza 2016/2017 during the Omicron peak. Overall median LOS ranged from 6 (peak analysis) to 8 days (annual analysis) for COVID-19 and ranged from 3 to 6 for influenza seasons, with differences more noticeable in patients >50 years of age. LOSs for the annual analysis were close to other studies for COVID-19 in 2020 (median: 7,5 86 29 and 930) and influenza during different season (median=3,5 729 and 530). Similar to other studies,2 5 7 ICU admission rates and LOS in ICU for COVID-19 was significantly higher than influenza in the annual analysis. During Omicron, relative differences in ICU admission rates and LOS for patients hospitalised for COVID-19 decreased, but important age-specific patterns remained.
Our work has several strengths and fills an important gap in the literature comparing the population-level burden of COVID-19 to influenza in terms of hospitalisation, as other publications generally focus on difference in severity of influenza versus COVID-19 in hospitalised patients, while our study focuses on the difference in population-level burden of the two conditions pre-Omicron and during Omicron. Other notable strengths include the population-based capture of both influenza and COVID-19 hospitalisations and the ability to link to individual-level COVID-19 immunisation data and chronic disease registry data for comorbidity findings. In addition, our comparative analysis alleviated potential biases by accounting for important factors, namely using ICD codes for both conditions, COVID-19 vaccination status, including two time periods for COVID-19 with different features, and three different influenza comparison seasons with varying severity and different influenza strains.
Our study also had limitations. The present analysis was hindered by the unavailability of individual-level influenza immunisation status; there is currently no provincial level dataset that captures influenza vaccination status for all BC residents. We were thus unable to stratify influenza hospitalisations by vaccination status. While the use of ICD codes to identify influenza hospitalisations is widely adopted in literature, some misclassification and underreporting is expected. Yet, relying on positive influenza tests alone is not an ideal approach either: it underestimates the true number of influenza hospitalisations since testing practices differ by facility and not every patient with respiratory symptoms gets swabbed. In our validation analysis, the overall influenza estimates of hospitalisation rates using ICD codes and test results were comparable with overlapping confidence intervals. For COVID-19 hospitalisations, due to variations in coding practices and widespread testing in hospitals, residual misclassification and overestimation is possible. Our study period for annual analysis includes a short time period in February 2021 when the first variant of concern, Alpha, started to grow in BC; therefore some hospitalisations may not have been due to the original strain, although we expect this number to be small. Finally, our analysis captures a time period with varying degrees of public health measures being in place, and thus direct comparisons with historical influenza results, when no restrictions were in place, should be made with caution.
In conclusion, In the context of Omicron and few public health measures, hospitalisation rates for COVID-19 among children and vaccinated younger adults were comparable to historical influenza seasons and lower than that observed during 2009/2010 H1N1 pandemic. The hospitalisation rate among infants and toddlers was higher than non-pandemic influenza years but lower than 2009/2010 H1N1 pandemic. For older vaccinated adults, COVID-19 hospitalisation rates were closer to more severe influenza seasons for that demographic. For unvaccinated adults all ages, COVID-19 hospitalisation rates were significantly worse than severe influenza seasons.
These may have important implications for planning and preparation for future periods of influenza and SARS-CoV-2 co-circulation. Specifically, they provide population-level epidemiological observations by age and vaccination status that can be used to inform assumptions that underlie various planning scenarios. Comparison to influenza provides an important reference point because it is a familiar pathogen for which there is past experience and existing protocols and policies. Future studies are warranted to better understand the impact of COVID-19 relative to influenza in the context of no or little restrictions and/or co-circulation.
Data availability statement
No data are available. All databases used for this study were made available through British Columbia COVID-19 Cohort (BCC19C), a public health surveillance platform integrating COVID-19 datasets (testing, cases, hospitalisations, vaccinations) with administrative data holdings for the BC population (eg, medical visits, hospitalisations, emergency room visits, prescription drugs, chronic conditions, vital statistics). The BCC19C was established and is maintained through operational support from Data Analytics, Reporting and Evaluation (DARE), and BC Centre for Disease Control (BCCDC) at the Provincial Health Services Authority. We are not permitted to share these data. BCC19C data are only available to researchers who request and meet the criteria for access.
Ethics statements
Patient consent for publication
Ethics approval
Not applicable.
Acknowledgments
We acknowledge the assistance of the Provincial Health Services Authority, BC Ministry of Health and Regional Health Authority staff involved in data access, procurement and management. We acknowledge BC Public Health Leadership table for their support and guidance. We acknowledge Dr Mel Krajden, the medical director of the British Columbia Centre for Disease Control Public Health Laboratory, for his support in providing lab data for influenza. We gratefully acknowledge the residents of British Columbia whose data are integrated in the British Columbia COVID-19 Cohort (BCC19C).
Supplementary materials
Supplementary Data
This web only file has been produced by the BMJ Publishing Group from an electronic file supplied by the author(s) and has not been edited for content.
Footnotes
Contributors KS, SS and MZ were involved in the conception and design of the study. SS and JW accessed and verified the data. SS was in charge of the study analysis. SS wrote the first draft. All authors were involved in the interpretation, critically reviewed one or multiple drafts of the manuscript and approved the final version. KS and SS are the guarantors. The corresponding author attests that all listed authors meet authorship criteria and that no others meeting the criteria have been omitted.
Funding The authors have not declared a specific grant for this research from any funding agency in the public, commercial or not-for-profit sectors.
Competing interests NJ reports having received grants from Canadian Institutes of Health Research, Michael Smith Foundation for Health Research, and Public Health Agency of Canada, unrelated to this work. He also declares receiving payment/honoraria from AbbVie, unrelated to this work.
Patient and public involvement Patients and/or the public were not involved in the design, or conduct, or reporting, or dissemination plans of this research.
Provenance and peer review Not commissioned; externally peer reviewed.
Supplemental material This content has been supplied by the author(s). It has not been vetted by BMJ Publishing Group Limited (BMJ) and may not have been peer-reviewed. Any opinions or recommendations discussed are solely those of the author(s) and are not endorsed by BMJ. BMJ disclaims all liability and responsibility arising from any reliance placed on the content. Where the content includes any translated material, BMJ does not warrant the accuracy and reliability of the translations (including but not limited to local regulations, clinical guidelines, terminology, drug names and drug dosages), and is not responsible for any error and/or omissions arising from translation and adaptation or otherwise.