Article Text

Abstract
Objective Particulate matter with a diameter below 10 µ (PM10) has been a major concern in the Tamar Valley, Launceston, where wood heaters are extensively used. We examined the relationship between PM10 levels, meteorological variables, respiratory medications and hospital admissions for respiratory disease over the decade 1992–2002.
Methods PM10 levels were provided by the Department of Primary Industry Water, Parks and Environment, and meteorological variables from the Bureau of Meteorology. We obtained hospital discharge codes for the Launceston General Hospital. Poisson regression was used for statistical analyses.
Results Mean daily PM10 levels declined from 50.7 to 16.5 μg/m3. Hospitalisations for asthma decreased from 29 to 21 per month, whereas chronic obstructive pulmonary disease (COPD) increased and bronchitis/bronchiolitis remained unchanged. We found a 10 μg/m3 increase in PM10 to be associated with a 4% increase in admissions for acute bronchitis/bronchiolitis (p0.05), but no association with asthma or COPD was found. All respiratory diseases showed seasonal patterns of hospitalisation.
Conclusions This is the first long-term study in Australia to demonstrate an association between PM10 levels and respiratory diseases. Reducing exposure to PM10 may decrease hospital admissions for respiratory diseases.
Implication Better preventive measures, including sustained public health initiatives to combat air pollution, are required to reduce respiratory morbidity.
- Asthma
- COPD epidemiology
- COPD Exacerbations
This is an Open Access article distributed in accordance with the Creative Commons Attribution Non Commercial (CC BY-NC 4.0) license, which permits others to distribute, remix, adapt, build upon this work non-commercially, and license their derivative works on different terms, provided the original work is properly cited and the use is non-commercial. See: http://creativecommons.org/licenses/by-nc/4.0/
Statistics from Altmetric.com
Key messages
-
This retrospective study looked at associations between PM10 and hospital admissions for respiratory disease in an area of high particulate air pollution.
-
There was a significant association between hospital admissions for bronchitis/bronchiolitis and PM10 concentrations.
-
Lowering of PM10 levels may reduce hospital admissions for these diseases.
Introduction
Exposure to airborne small particles, such as particulate matter with a diameter below 10 µ (PM10), have been shown to be related to adverse health effects, especially in the cardiovascular and respiratory systems.1–3 Previous studies have demonstrated that exposure to particles 10 µ or less in size are associated with acute exacerbations of asthma, bronchitis and chronic obstructive pulmonary disease (COPD).4 ,5 This occurred across all ages, including the paediatric and elderly population.6 ,7
Wood-heaters that are used for home heating are a known major source of PM10.5 Few, if any, published studies in Australia have evaluated the effects of particulate matter on respiratory hospital admissions in regions where domestic wood heating is extensively used. A Launceston study8 reported a decrease in mortality due to public health interventions, but was unable to associate this with a specific disease. Instead, recent Australian research has predominately focused on cardiorespiratory admissions and exposure to biomass smoke resulting from vegetation fires.9 Results from earlier studies in Australia and New Zealand demonstrate a strong and consistent association between ambient outdoor air pollution (including PM10) and short-term increases in hospitalisations, but it is not clear whether the regions were dominated by solid fuel domestic heating in winter.6 The focus of most of these studies has been acute exacerbations of asthma and bronchitis in the paediatric population,6 ,10 whereas an association between exposure to ambient PM10 and acute exacerbations of COPD in adults has received less research attention. It has been demonstrated that a link exists between exposure to PM10 and COPD4 and therefore, comprehensive studies examining exposure to particulates in a region should include not only children but adults as well.
Previous studies of how exposures to PM10 contribute to chronic respiratory disease have been mainly short-term case-crossover studies6 or time-series studies with a time frame of between 1 and 6 years.9 Short-term studies such as these do not necessarily show subtle changes over time such as improvements in the treatment and management of respiratory diseases, changes in clinical coding practices and air quality guidelines, and natural changes in the patterns of the disease. Therefore, there is a need for longer term studies to fully evaluate a range of factors that may influence respiratory admissions. There is also increasing evidence that associations between air pollution and hospital admissions for respiratory disease should be examined while controlling for potential confounders, especially climate, which is known to influence respiratory admissions.11 In assessing air pollution effects, temperature is usually considered a confounder; however, only a few recent studies have considered air pollution and temperature effects simultaneously.11
To address these issues, we used the Tamar Valley region to assess associations between exposure to ambient PM10 and admissions for respiratory disease. The Tamar Valley, in northern Tasmania, is unique in Australia because there are still significant winter smogs due to the valley's climate, physical geography and continued use of wood-heaters for domestic home heating. Measurements of particle levels in the Tamar Valley, between 1991 and 1993, showed daily PM10 levels as high as 200 µg/m3 and average annual levels of 50 µg/m3, which at that time represented the highest levels ever recorded in Australia. These levels were well in excess of the Australian air quality standard daily limit of 50 µg/m3 introduced in 1998. The 10 years of comprehensive air pollution data available allowed for an assessment of the relationship between daily PM10, meteorological variables, use of respiratory medications and hospital admissions for acute exacerbations of chronic respiratory disease from January 1992 through December 2002.
Materials and methods
We utilised data on air pollution and health outcomes over a decade to study any association between changes in particulate concentrations and respiratory health outcomes.
Site selection
Situated in northern Tasmania, Australia, about 100 000 people live mainly in the city of Launceston on the upper reaches of the Tamar River (figure 1). The Tamar Valley region is aligned in a north-west to south-east orientation and flanked by hills which reach heights of up to 400 m. Minimum daily temperatures are below 5°C on approximately 120 days of the year and calm conditions occur about 34% of the time in winter, 20% in autumn and 12% in spring. The calm atmospheric conditions and low overnight temperatures cause thermal inversions resulting in pollutants being trapped close to the ground. Overnight there is a southerly flow of air from the upper sections of the valley down to Launceston, sweeping air pollutants to the more densely populated suburbs around Launceston's central business district.

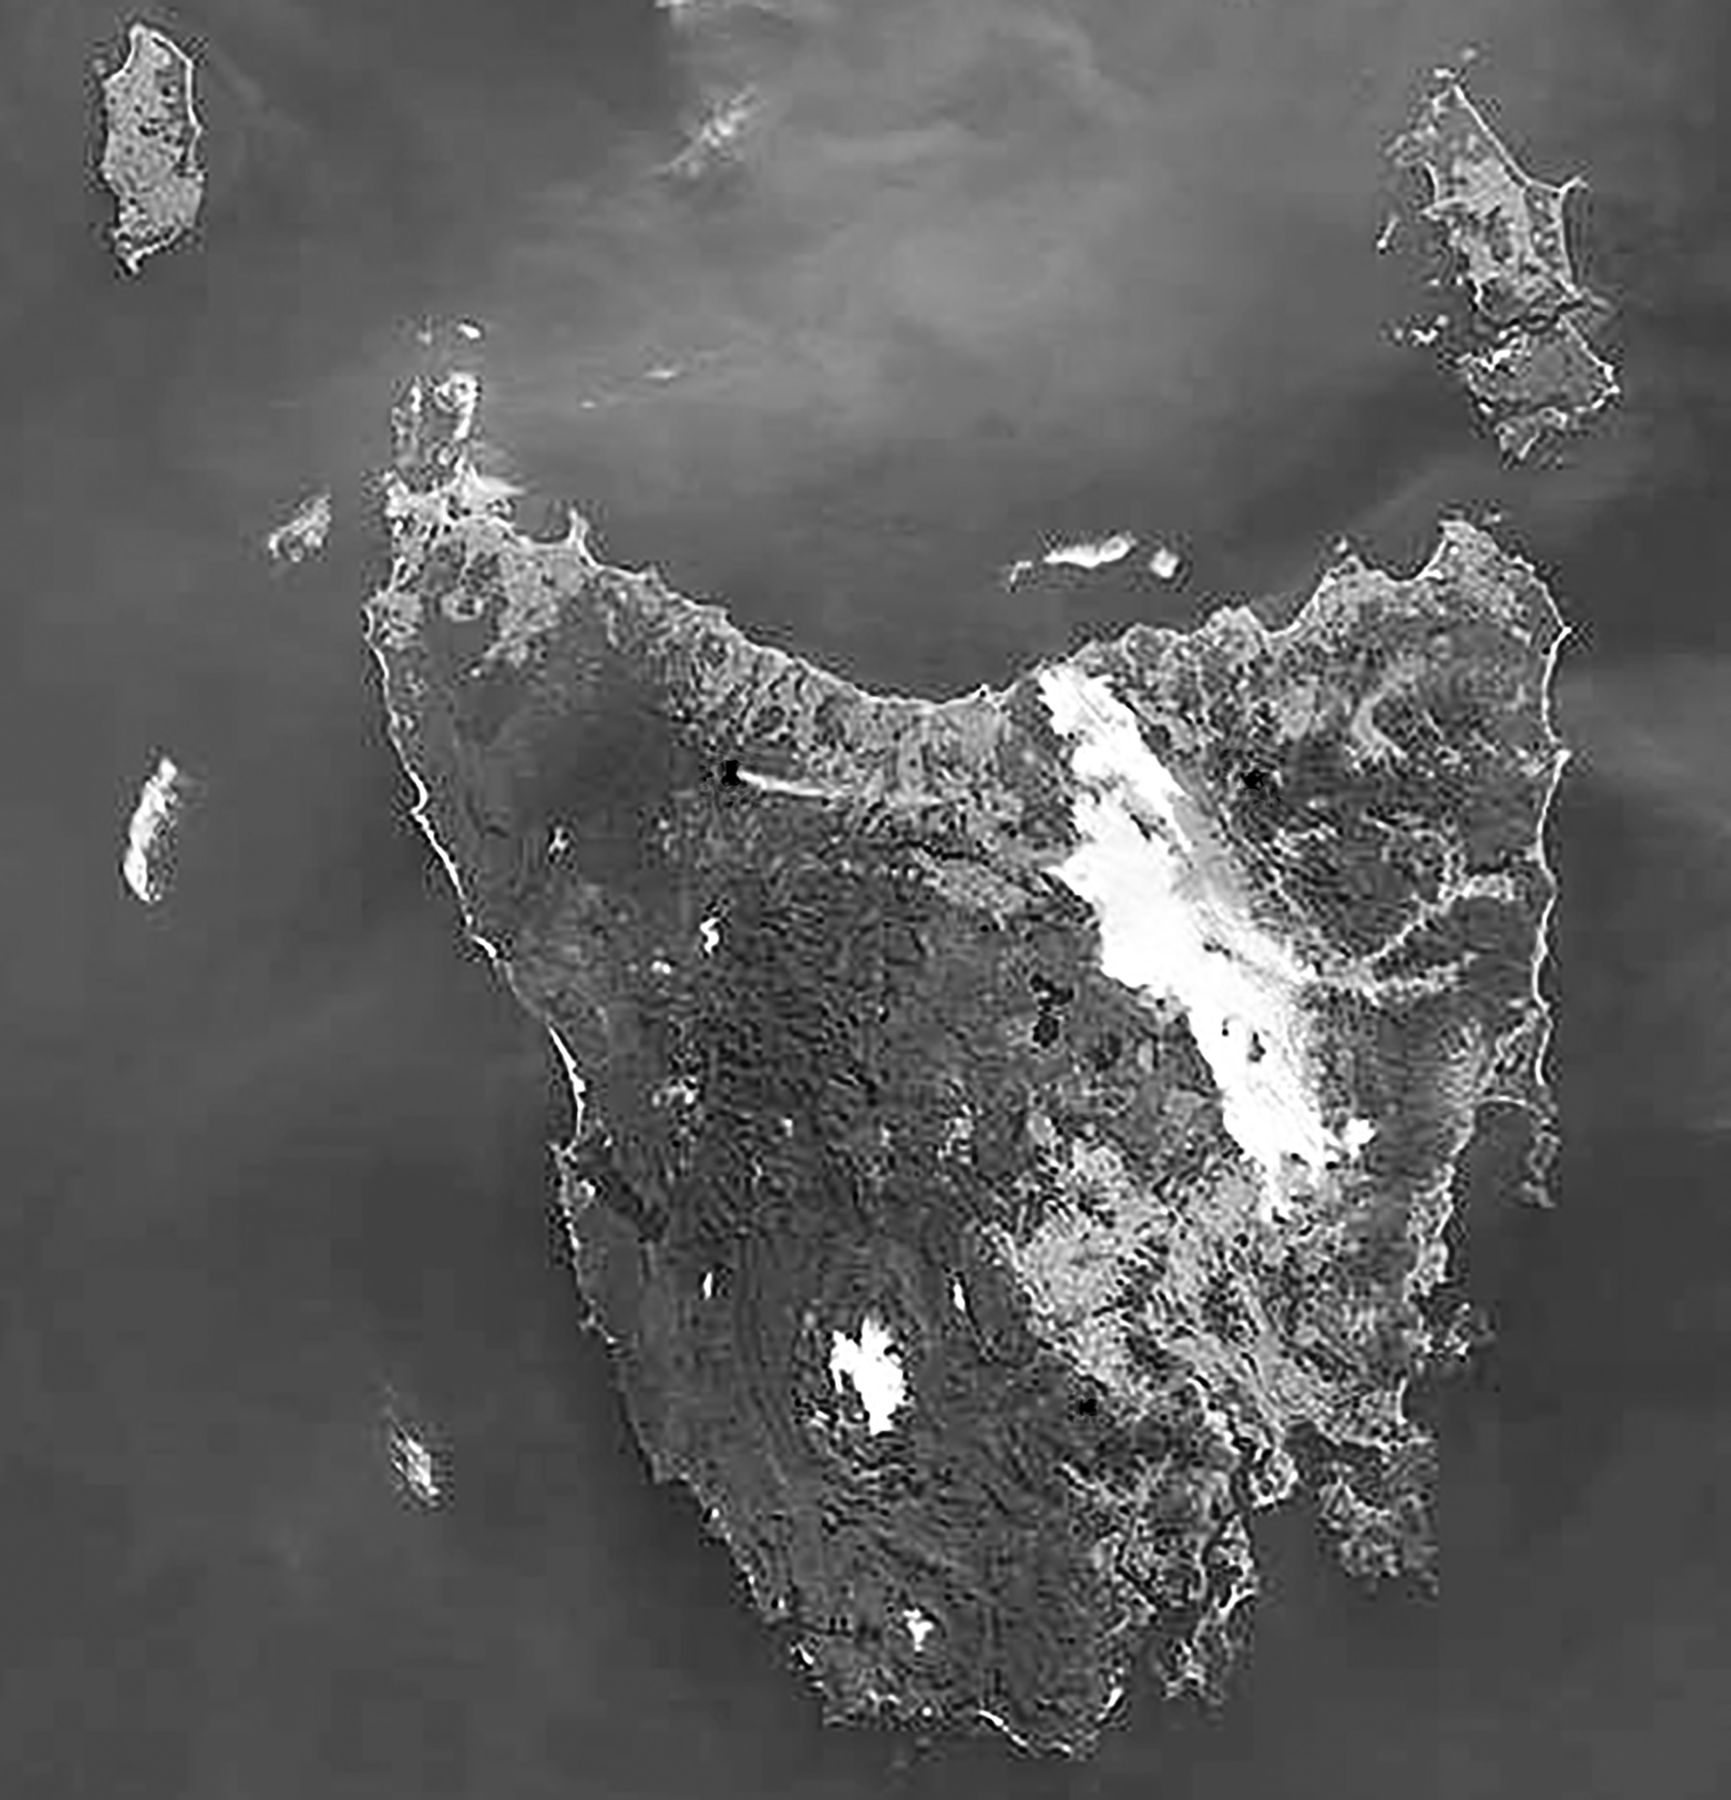
A temperature inversion causing cold air drainage to accumulate as fog in the low-lying areas of the Tamar Valley and Midlands (Source: National Aeronautics and Space Administration (NASA) Earth Observatory Image, 2002).
PM10 concentrations
Information on PM10 levels was provided by the Department of Primary Industry, Parks, Water and Environment (DPIPWE). DPIPWE has two colocated high-volume air samplers (HVAS) at the Ti Tree Bend air monitoring site. Ti Tree Bend is just 2 km north-west of Launceston city centre. These HVAS provided the daily averages from May 1992 until the present day. Prior to May 1992, measurements had been taken every second day in winter and every sixth day in summer. Ti Tree Bend was chosen as an air National Environment Protection Measure (NEPM) performance monitoring station because it is considered to be representative of pollution levels in the entire Launceston region.
Meteorological variables
Daily meteorological variables were collected by the Bureau of Meteorology at Ti Tree Bend and Launceston Airport. For our analyses, the average daily temperature was calculated by averaging the maximum and minimum hourly measurements in °C. Relative humidity in per cent and sea-level pressure in kPa were provided three hourly and the average over each 24 h period was used for analysis. Wind run, a measurement of the amount of wind passing through the station, was calculated above 3 m for each 24 h period before 9:00 local time and used in the analyses.
Hospital admissions for respiratory disease
We identified daily respiratory admissions from hospital records using the International Classification of Diseases (ICD). ICD, Ninth Revision, Clinical Modification (ICD9-CM) coding 460–519.9 was used up to 1999 and ICD, Tenth Revision, Australian Modification (ICD10-AM) codes J00-J99 thereafter. Only the principal discharge diagnosis was included in the analysis and we included all age groups.
We limited our analysis only to those respiratory diagnoses which we felt were likely to be influenced acutely by exposure to air pollutants. We grouped these respiratory admissions according to the following categories (table 1) acute asthma, acute bronchitis and acute bronchiolitis, and acute exacerbation of COPD.
Grouping of respiratory admissions into acute asthma, acute bronchitis/acute bronchiolitis and acute exacerbation of COPD categories according to ICD codes
We obtained data from both the Launceston General Hospital and the Royal Hobart Hospital over the same period. The latter provided, in effect, a control for changes in disease prevalence and management over the study period unrelated to PM10 knowing that Hobart, in Southern Tasmania, has spatially more heterogeneous and rather lower average particle pollution in winter. Hobart is approximately 200 km from Launceston, and shares many similarities in population and weather characteristics.
Prescribed medications dispensed for respiratory disease
Data on the daily dispensing of respiratory medications were obtained from the Pharmaceutical Benefits Scheme (PBS) prescriptions at the Launceston General Hospital. We reasoned that if there was greater respiratory illness in the community requiring hospital management, this would be reflected in greater dispensing of medications specific to treatment of the respiratory disease. Both inpatient and outpatient prescriptions were included in the analyses. Respiratory medications from the PBS Schedule included all bronchodilators (long-acting and short-acting β2-agonists and anticholinergics) and preventive (mainly corticosteroids) aerosols. Data on the daily dispensing of respiratory medications from the Royal Hobart Hospital were not used in the analyses.
Statistical analyses
Standard Poisson regression with a logarithmic link function was used for the analyses. Evidence for an effect due to air pollution must be sought from a comparison of two regression models, one with and one without a term for air pollution. The model excluding air pollution is referred to as the core model. There is strong evidence to suggest that air pollution studies have inherent difficulties with confounders,10 such as climate, which influence particulate levels and health outcomes. Because of the potential for confounding variables to disturb the magnitude of the apparent air pollution effect, it is of key importance to set up a correct core model, that is, one which contains the set of potential confounders (ie, variables apart from air pollution) which are known to influence disease admissions in the study area. Yet there is danger in using the same data to choose this set of variables and then to also estimate the effect of air pollution. It is a considerable strength of the present study that this danger is averted by using independent data to select the core model (table 2). Launceston and Hobart share major climatic, seasonal and demographic details; so it is reasonable and advantageous to develop the core model using Hobart data. Moreover, during the time interval of this study, PM10 was not recorded in Hobart. This core model was then tested against the Launceston admission data after inclusion of particulate pollution and a statistically significant coefficient for the particulates variable at a 5% level was accepted as evidence of an effect on health outcomes.
Selection of factors contributing to the core statistical model
The Launceston meteorological data sets from Ti Tree Bend and the Airport monitoring stations were incomplete, as not all variables were being measured on all days. However, there was a close correlation between the sites (average temperature r=0.99, average relative humidity r=0.87, and wind run r=0.76) and hence the available data set for any time period was used for the analyses. Missing data resulting from the sixth daily measurements of PM10 and other gaps were filled by linear interpolation. There was no recording of PM10 between September 1993 and May 1994, and this gap was left as missing data.
Ethical considerations
After discussion with the Human Research Ethics Committee at the University of Tasmania, approval was not sought as the study used only de-identified hospital data or information available from the public domain, for example, climatic data.
Results
PM10 significantly decreased between 1992 and 2002. The maximum daily PM10 levels fell from 186 to 77 µg/m3 and the mean PM10 levels from 50.7 to 16.5 µg/m3 (figure 2). PM10 concentrations in the Tamar Valley showed seasonal variation, with highest concentrations seen in the winter months. In Hobart, most of the meteorological variables (ie, relative humidity, wind speed, wind direction, minimum, maximum and average air temperature and air pressure) had no association with the three disease categories (p>0.20); therefore, no meteorological variables were included in the regression model for Launceston. The exception was relative humidity that had an association with asthma, but this was not statistically significant (p=0.08).

Weekly bronchitis cases (circles, left hand axis) and particulate matter with a diameter below 10 µ (PM10) (crosses, right hand axis), with smoothed curves showing the trends through the decade of study data. Some higher PM10 values are off the scale.
Hospitalisations for acute asthma showed there was a gradual decrease in asthma admissions during the decade studied, from a mean of 29 to 21 admissions per month (table 3). There was a seasonal effect in asthma admissions (p<0.001 for the month effect), with the highest admission rates in winter and a drop in admissions in summer. After adjustment for temporal trends, weekly and seasonal variation, there was no relationship (p=0.6) between average daily PM10 levels and hospital admissions for acute asthma (table 4).
Descriptive statistics of key outcome variables—hospitalisation rates, weather variables and particulate pollution, for the two study sites
Regression statistics for hospital admissions
In contrast to asthma, there was no significant change in hospital admissions for acute bronchitis and bronchiolitis over the decade studied. Acute bronchitis/bronchiolitis also showed a strong seasonal pattern (p<0.001 for the month effect) with winter peaks. Average daily PM10 levels were positively associated with admissions for acute bronchitis/bronchiolitis (p=0.04). For each 10 µg/m3 increase in PM10 levels there was an estimated 4% increase in hospital admissions for acute bronchitis and bronchiolitis.
Over the decade studied, hospitalisations for acute exacerbations of COPD showed an increase by a factor of 3–4 from stable pre-1999 levels. This increase coincided with the change from ICD9 to ICD10. Hospitalisations for COPD also showed a marked seasonal pattern (p<0.001 for the month effect) with admissions peaking in winter. There was no evidence of a relationship between average daily PM10 levels and hospital admissions for acute exacerbations of COPD (p=0.30).
The weekly prescriptions of bronchodilators and preventive aerosols showed some association with PM10, but this was not statistically significant (p=0.20), and so this was not investigated further as an indicator of overall respiratory disease within the community.
Discussion
This is the first Australian study of substantial duration which examines associations between PM10 levels and acute respiratory disease causing hospitalisation. There was a notable decline in daily PM10 concentrations over the study period, with a significant association between daily PM10 concentrations and hospital admissions for acute bronchitis and bronchiolitis. Acute asthma and exacerbations of COPD showed no relationship to PM10 concentrations. As our results were surprising, we undertook a number of checks to ensure the validity of the responses. Overdispersion is a known threat to validity in Poisson regression; this was not the case for our planned analysis, as shown by a scale factor near to unity. Several variations on the regression modelling are possible and were tested as a check on the robustness of our conclusions to the inherent assumptions. First, it is possible to impute the missing values of PM10 in slightly different ways; this did not disturb our conclusions. Second, we used a year effect to adjust for long-term trends in risk and treatment, as well as for the discussed public health interventions.8 An alternative is to use a linear term for the long-term trend, but this made no difference to the conclusions. Third, instead of using daily records as the units of analysis, one might use weekly records (retaining trend and seasonal effects, but omitting day-of-the-week effects). Again this confirmed the effect of air pollution as described above; however, some overdispersion was now evident. Fourth, one might ignore the core-model approach using the Hobart data and simply conduct a standard stepwise regression of the Launceston data. A problem which arises in this latter analysis confirms the value of our core-model methodology: in the stepwise approach, a term for air pressure cannot convincingly be eliminated on statistical grounds, although its inclusion appears far-fetched. The explanation lies in the fact that air pressure has a moderately strong positive linear relationship with PM10, presumably resulting from the known meteorological association between blocking high-pressure systems in winter, and the clear skies and temperature inversions that trap air pollution in Launceston's river valley. We take these checks to support the choice of our planned model as the best and to confirm the robustness of our conclusion.
The improvements seen in the Tamar Valley particulate levels are largely due to intensive air quality programmes being initiated in the Launceston region. These include compulsory compliance for wood-heaters with Australian Standards and highly successful community education campaigns.12 In spite of these improvements, ambient PM10 frequently exceeded the mean daily Australian standard of 50 µg/m3 even in the latter part of the decade studied.
A 10 µg/m3 relative rise in PM10 levels was shown to correspond with a 4% rise in hospital admissions for acute bronchitis and bronchiolitis in this study. Difficulties arise in comparing these results to other published studies because respiratory diseases are usually reported collectively and focus on specific age groups. However, McGowan et al5 reported similar results and found that when all age groups were combined there was a 3.37% increase in respiratory admissions (including bronchitis) for each interquartile rise in PM10 (interquartile value 14.8 µg/m3). The SAPALDIA cohort of adults also found that annual mean PM10 levels of 10–33 mg/m3 affected symptoms and lung function in chronic bronchitis.13 The precise pathophysiological mechanism for why the bronchitis/bronchiolitis group may be more susceptible remains unanswered, but it is possible that air pollution particles, which modulate airway macrophage host defences, may increase the severity of inflammatory and infectious disease in these individuals.14 In contrast, acute exacerbations of asthma and COPD showed no relationship with daily PM10. This may reflect that acute exacerbations of COPD are mainly attributable to respiratory tract infections, viral or bacterial, or to other components of air pollution, such as CO and SO2,which could not be studied with our data.15 ,16 Indeed, we found a reduction in asthma admissions over the course of the study period, which may be the result of increased inhaled corticosteroid usage, with the same trend seen in both regions, and typical of the reduction of asthma admissions documented in other states of Australia.
All meterological variables showed no association with hospital admissions; the exception being relative humidity and asthma. Even though changes in weather has been known to impact on respiratory hospitalisations,11 the lack of association between climate and hospitalisations has been reported previously where hospital admissions for respiratory disease was independent of potential confounding effects of temperature, air pressure and humidity.17 The association between asthma and humidity is difficult to assess. It is not known if it was the direct effect of humidity alone that caused acute exacerbations of asthma or whether humidity prolonged the periods of air pollution or affected the biological and chemical components of PM10 causing acute exacerbations of asthma. In a study by Prifitis et al,18 relative humidity alone were predictors of up to 56.7% of monthly hospital admissions among younger children. Relative humidity has also been shown to have the opposite effect in certain respiratory diseases. For example, Leitte et al19 found that the adverse effect of total suspended particulates (including PM10) on chronic bronchitis was reduced by higher relative humidity. High relative humidity levels in the Tamar Valley are commonly observed in the cool mornings of winter, when it is not unusual to see levels of relative humidity reaching 100%. Therefore, the association between bronchitis/bronchiolitis and PM10 in this study cannot be explained by the influence of relative humidity.
There were distinct patterns in the daily hospital admissions for each disease category over the decade. The overall drop in admissions for acute asthma may be due to improvements in treatment, although this has previously been attributed to reduced industrial pollution, improved smoking cessation rates and better medical management.20 In contrast, COPD showed an increase in hospitalisations over the decade in keeping with global trends reporting an increase in the prevalence of hospital admissions for COPD,15 ,16 perhaps reflecting the ageing Australian population. COPD hospitalisations also appear to be affected by the change from ICD9 to ICD10 coding, which has been noted in other studies.21 All our respiratory disease categories showed similar patterns of hospitalisation for seasons of the year and are consistent with other studies where a regular winter peak and summer trough is observed.22
We found a weak association between exposure to PM10 and prescribed medications. The relationship between the use of bronchodilators and elevated levels of PM10 pollution have been noted in other studies,23 ,24 especially in the paediatric population. Brunekreef et al25 reported effects on respiratory symptoms and medication at 24 h average PM10 levels not exceeding 115 µg/m3. It is feasible that the weak association seen in our study is due to use of hospital prescriptions data only which had lower weekend means and a stronger association may exist if we had access to community prescriptions data.
Limitations to this study include using only PM10 data. It was not possible to examine other fractions of ambient particulates because air quality standards only required the measurement of PM10 in Launceston during the period studied. PM2.5 or less, which is considered to be a better indicator of exposure to lower airways, has only been recently introduced into data collection practices in Australia. However, we believe PM10 has been shown to be a reliable and valid method of assessing exposure to particulate matter as studies globally use PM10 as an indicator for studying respiratory illnesses.26 PM10 also has enforceable standards and the consistent data sets can be compared easily, whereas there is no enforceable NEPM standard for PM2.5 and as a consequence, it is only measured in a limited number of sites across Australia. We also did not use personal monitors to measure exposure to PM10. Recent data suggests that independent pollutant associations with lung function might be missed using ambient data alone.27 It was not feasible to use personal monitoring in this study because of the large population group studied and the retrospective design. Likewise, it was not possible to adjust for lifestyle factors (smoking, etc) at the level of the individual, as we did not have access to individual data. An earlier pilot study of airborne particulates in Launceston performed in 1991 measured other airborne pollutants, including polycyclic aromatic hydrocarbons (PAH), ozone and lead. There were high levels of PAH which showed a close correlation with PM10 levels, including syringaldehyde, a chemical marker of hardwood combustion. This made it reasonably clear that woodsmoke was at the least a major contributor to all particulates above a background (non-woodsmoke) level of about 30 μg/m3 in winter and also was abundant relative to other air pollutants.
In conclusion, exposure to PM10 was associated with hospital admissions for acute bronchitis and bronchiolitis in a region of Australia characterised by moderate to high concentrations of woodsmoke. Our findings suggest that this is an important public health problem and that the lowering of PM10 levels may reduce hospital admissions for these diseases. Further studies, that measure all fractions of particulate matter and the broad range of toxic substances it contains, are needed to determine what causes the most numerous and serious effects on human health.
Acknowledgments
The authors would like to thank the Department of Health and Human Services (Hospital Records Division), Clinical Coding Unit at the Royal Hobart and Launceston General Hospitals, the Department of Pharmacy at the Launceston General Hospital and Mr Michael Power from the Department of Primary Industry Water & Environment. The analysis described here benefited from the methodological recommendations of the MSc thesis (Univ. of Tasmania 2005) of Ms Robyn Reaburn, to whom the authors tender their thanks. The present study was funded by the Clifford Craig Medical Research Trust.
References
Footnotes
-
Contributors The authors all contributed to the design of the study, writing and editing of the manuscript; DM obtained data from the relevant organisations; DGF performed the statistical analyses.
-
Competing interests None.
-
Provenance and peer review Not commissioned; externally peer reviewed.
-
Data sharing statement Data will be available on request from the authors after publication.