Article Text

Abstract
Introduction Our knowledge of acute respiratory distress syndrome (ARDS) pathogenesis is incomplete. The goal of this pilot study is to investigate the feasibility of measuring lower airways inflammation in patients with ARDS using repeated endotracheal aspirates (ETAs).
Methods ETAs were obtained within 24 hours by intensive care unit admission from 25 mechanically ventilated patients with ARDS and 10 of them underwent a second ETA within 96 hours after the first sampling. In each sample, cell viability was assessed using trypan blue exclusion method and the total and differential cell counts were measured using Neubauer-improved cell counting chamber and cytospins stained with Diff-Quik.
Results The median cell viability was 89 (IQR 80–93)%, with a median total cell count of 305 (IQR 130–1270)×103/mL and a median macrophage, neutrophil, lymphocyte and eosinophil count, respectively, of 19.8 (IQR 5.4–71.6)×103/mL; 279 (IQR 109–1213)×103/mL; 0 (IQR 0–0.188)×103/mL; 0 (IQR 0–1.050)×103/mL. Eosinophil count in the ETA correlated with the number of blood eosinophils (r=0.4840, p=0.0142). Cell viability and total and differential cell counts were neither significantly different in the second ETA compared with the first ETA nor were unaffected by the presence or absence of bacteria in the blood and/or ETA, or by the ARDS aetiology, apart from the macrophage count which was significantly increased in patients with ARDS associated with acute pancreatitis compared with those associated with pneumonia (p=0.0143).
Conclusions ETA can be used to investigate the cellularity of the lower airways in patients with ARDS and it is an easy-to-perform and non-invasive procedure. Eosinophil counts in ETA and blood are significantly correlated. The number of macrophages in ETA may be affected by the aetiology of the ARDS.
- ARDS
- lower airways inflammation
- endotracheal aspirate
- macrophages
- eosinophils
This is an Open Access article distributed in accordance with the Creative Commons Attribution Non Commercial (CC BY-NC 4.0) license, which permits others to distribute, remix, adapt, build upon this work non-commercially, and license their derivative works on different terms, provided the original work is properly cited and the use is non-commercial. See: http://creativecommons.org/licenses/by-nc/4.0/
Statistics from Altmetric.com
Key messages
Endotracheal aspirates can be used to investigate the cellularity of the lower airways in patients with ARDS.
The macrophages in endotracheal aspirates may be affected by the aetiology of the ARDS3.
Eosinophil counts in endotracheal aspirates may be affected by the aetiology of ARDS.
Introduction
The acute respiratory distress syndrome (ARDS) is still a major cause of death in the critical care units worldwide, with mortality rates around 40% and little progress in its treatment.1 2 The ARDS is characterised by an acute inflammatory response in the lung parenchyma that is associated with severe injury to the epithelial and endothelial barriers.3 4 ARDS involves a complex interaction between different inflammatory and anti-inflammatory mediators released by inflammatory cells.5 Lower airways can be source of proinflammatory production since mechanical ventilation can be associated with a histological evidence of peripheral airway injury, attributed to shear stresses caused by cyclic opening and closing of peripheral airways. As consequence, both human and experimental studies described structural changes in the small airways of patients with ARDS, characterised by epithelial denudation, inflammation and airway wall thickening with extracellular matrix remodelling.6 7 The damaged epithelial cell may in turn upregulate inflammatory pathways and/or alter surfactant secretion via toll-like receptor-involved mediators, reactive oxygen species-involved reactions and an imbalance between protease and antiprotease activation.
Lower airways inflammation has often been investigated using bronchoalveolar lavage (BAL) performed with the fibreoptic bronchoscope but this procedure may be poorly tolerated in some critically ill patients with ARDS because it can worsen hypoxaemia and hypercapnia and may cause haemodynamic instability, temporary loss of recruited lung areas and development of positive end-expiratory pressure (PEEP) of unknown magnitude.8–10 For these reasons, a less invasive technique, such as the endotracheal aspirate (ETA) performed using a simple suction catheter, may represent a useful alternative.11
The aim of this pilot study was to investigate the feasibility of measuring lower airways inflammation in patients with ARDS of different causes using repeated ETAs.
Methods
Design of the study and inclusion and exclusion criteria
All the patients admitted to the intensive care unit (ICU) of the Sant’Anna Academic Hospital of Ferrara, Italy (www.ospfe.it) between January and July 2015 were screened for eligibility.
Patients intubated and mechanically ventilated for more than 24 hours were considered eligible for inclusion if they met all the criteria of ARDS Berlin definition.12
All patients below 18 years of age, those with ARDS after thoracic surgery and patients with established primary or secondary immunosuppression before the development of ARDS were excluded from the study.
Ventilatory support of the patients with ARDS was carried out in accordance with the ARDS Network criteria for a protective lung strategy.13
The study was carried out in compliance with the relevant laws and institutional guidelines and was approved by the Ethics Committee of the University Hospital of Ferrara, Italy (www.ospfe.it; protocol number 150897) and written informed consent was obtained from each participant postextubation and/or by the relatives after the death of the patients in accordance with the principles outlined in the Declaration of Helsinki.
ETA collection and processing
All the patients were already intubated and ventilated invasively during the procedure. All the ETAs were collected by trained ICU nurses using aseptic techniques according to a standardised procedure. According to the American Association for Respiratory Care guidelines, the 50 cm suction catheter (Argyle TM, Covidien, Turkey) was introduced into the endotracheal tube and driven forward until a resistance occurred. Then it was pulled back for 1 cm and a negative pressure was applied for a maximum duration of 3 s.11 Hence, aspirates should have been performed approximately at 1 cm from carina or from the right bronchus. The undiluted sample was aspirated by gentle suction into a plastic 15 mL falcon tube and labelled.
Each ETA was then filtered using a clean funnel and a sterilised nylon gauze (4×4 cm2, pores 52 µM), transferred to a 1.5 mL Eppendorf and centrifuged for 10 min (at 4°C, 1800 rpm/min). Two cytospin slides were prepared for each sample, air-dried for 30 min and stained with Diff-Quik (American Scientific Products, McGraw Park, IL, USA).
Cell viability was assessed using the trypan blue exclusion method. The total cell counts/mL were determined in a Neubauer-improved cell counting chamber.14 The total cell count was standardised according to the sample size (mL) as previously described for the sputum.15
The differential cell count was performed on two cytospins stained with Diff-Quik. For every slide, we have counted 400 cells of the spot with the aid of an electronic cell counter (Crison Leucoform, Crison, Spain), distinguishing the different cell types (macrophages, neutrophils, eosinophils, lymphocytes, epithelial cells; figure 1). For each sample, average values were calculated between two cytospins.

Example of cytospin stained with Diff-Quik stain, (×400) showing the presence of macrophages (open arrow), neutrophils (closed arrow), lymphocytes (closed arrowhead) and eosinophils (open arrowhead).
Peripheral venous blood collection and analysis
On the same day of the first ETA, 10 mL of peripheral venous blood was collected using standard techniques.16 A complete blood cell count together with serum C-reactive protein (CRP) and procalcitonin (PCT) levels was obtained. The CRP levels in human serum were measured by immunoturbidimetric assay using an AU Beckman Coulter Analyser, OSR6147, California, USA. The upper limit of the reference range in healthy adults is 5 mg/L. The PCT was measured using the Procalcitonin test kit (Liaison Brahms PCT, Ref 318101, DiaSorin, Saluggia, Italy) which uses chemiluminescence immunoassay technology for the in vitro quantitative determination of PCT in human serum and plasma specimens. The manufacturer’s reference scale categorises three PCT level intervals, that is, <0.5 ng/mL, ≥0.5 ng/mL and <2 ng/mL, ≥2 ng/mL.
Statistical analysis
The data are presented as the mean±SD or median and IQR for continuous variables, and as absolute or relative frequencies (%) for categorical variables. The Kolmogorov-Smirnov test has been used to identify variables with a normal distribution. Simple correlation was investigated using Spearman correlations. Mann-Whitney U test was used to compare continuous variables. The Kruskal-Wallis test for non-parametric data followed by Mann–Whitney U test was used to detect differences between the three groups of subjects and the post-test Dunn’s comparison. For all these statistical analyses, two-tailed tests were performed and p values equal to or less than 0.05 were considered statistically significant. The statistical analyses were performed using GraphPad Prism software V.6.0 (GraphPad Software, La Jolla, California, USA).
Results
Patient characteristics
The flow chart diagram of the study is illustrated in figure 2.

Flow chart of the study. ARDS, acute respiratory distress syndrome.
Out of the 35 patients we screened, 32 met the study inclusion criteria.
Four patients were excluded for organisational reasons (impossibility to start the protocol within 24 hours from intubation or delayed diagnosis).
Two patients were excluded because insufficient quantity of the ETA was collected and one patient was excluded due to the low quality of the ETA (the percentage of squamous epithelial cells was >20%).
At least one baseline ETA has been collected from 25 patients within 24 hours from the admission to the ICU. Their clinical details at baseline are summarised in table 1. A second ETA was collected from 10 of these patients within 96 hours after the first ETA. The length of the ETA procedure was always less than 2 min and was performed without complications in all patients. No modification of the ventilator settings was necessary during this procedure. When the patients were divided according to the aetiology of the ARDS and/or the presence/absence of a positive bacterial culture in blood and/or in the ETA there were no significant differences in the clinical parameters between these groups. Also there was no significant difference in the ventilator parameters among patient with ARDS when subdivided according to the aetiology of the disease. Three patients (12%) died within 28 days after their ICU admission.
Patients’ characteristics
Total cell number and cell viability in the ETAs
The median value of the total cell number was 305 (IQR 130–1270)×103/mL; and the median cell viability was 89 (IQR 80–93)% (table 2).
Endobronchial aspiration total cells count and cells differential count
These data were not significantly different among patients with ARDS in terms of presence or absence of a positive bacterial culture in blood and/or in the ETA (Mann-Whitney U test p=0.70 and p=0.58, respectively).
Likewise they were not significantly different when patients with ARDS were subdivided according to the aetiology of the disease (Kruskal-Wallis test p=0.2140 and p=0.3208, respectively) (online supplementary tables 1 and 2).
Supplementary file 1
Neither the total cell count nor the cell viability was significantly different between the first and the second ETAs (Mann-Whitney U test p=0.5391 and p=0.2520, respectively) (online supplementary table 3).
Finally, we did not find any correlation between the total cell counting and the ventilation parameters as PEEP (p=0.82), driving pressure (p=0.74) and pressure plateau (p=0.68)
Differential inflammatory cell count in the ETAs and in the blood
The median total number of neutrophils was 279 (IQR 109–1213)×103/mL and their median percentage was 94.5 (IQR 82–97)%.
The median total number of macrophages was 19.8 (IQR 5.4–71.6)×103/mL with a median percentage of 4.5 (IQR 3–15)%.
The median total number of lymphocytes was 0 (IQR 0–0.188)×103/mL, with a median percentage of 0 (IQR 0–0.5)%.
Similarly the median eosinophil count was 0 (IQR 0–1.050)×103/mL with a median percentage of 0 (IQR 0–1)% (table 2).
The median total number of macrophages was significantly increased in patients with ARDS associated with acute pancreatitis compared with ARDS associated with pneumonia (113.4 (IQR 75.6–140.2)×103/mL vs 16.3 (IQR 3.7–39.0)×103/mL, respectively, Mann-Whitney U test p=0.0143, Kruskal-Wallis test p=0.0562) whereas there was no other significant difference in the differential inflammatory cell count between patients with ARDS when subdivided according to the aetiology of the disease (figure 3).
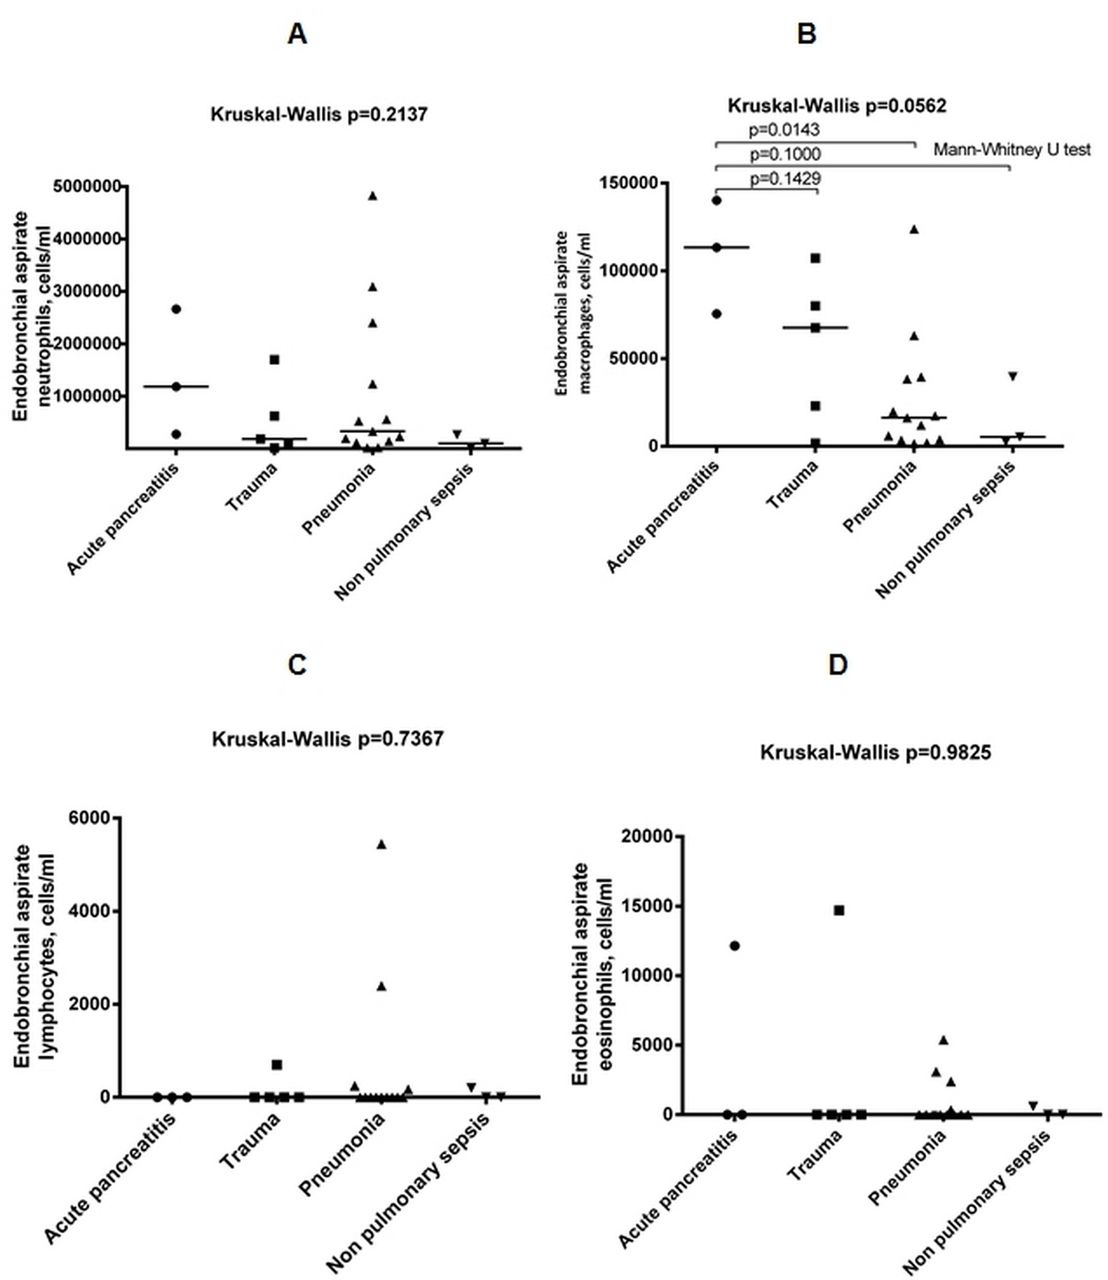
(A, C, D) The median neutrophil, eosinophil and lymphocyte counts did not differ significantly between any of the groups. (B) The median macrophage count was significantly increased in patients with ARDS/acute pancreatitis compared with ARDS/pneumonia group. ARDS, acute respiratory distress syndrome.
Instead, there was no difference in the differential inflammatory cell count between patients with ARDS with presence or absence of a positive bacterial culture in blood and/or in the ETA neither comparing the second ETA with the first ETA (online supplementary tables 2 and 3).
A significant positive correlation was found between the total number of blood eosinophils and the total number of the same cells in the ETA (r=0.4840, p=0.0142) (figure 4). This correlation was instead absent for the other inflammatory cells.

Correlation between the cell number of eosinophils per millilitre in the blood and their number per millilitre in the endotracheal aspirate.
There was no correlation between the differential inflammatory cell count and ventilation parameters.
Correlation between clinical and inflammatory parameters in the ETAs
There was no correlation between the inflammatory parameters in the ETAs and all the clinical parameters and/or the serum CRP or PCT levels (online supplementary table 4).
Discussion
We have demonstrated for the first time that the ETA, a relatively easy-to-perform and non-invasive procedure, may be used to investigate the inflammatory cells present in the central lower airways of patients with ARDS.
For many years, the BAL has been used as the gold standard for sampling the peripheral airways. However, as a sampling technique in critically ill patients with ARDS, it is less than ideal for several reasons. The passage of the bronchoscope along the tracheal tube in patients on mechanical ventilation can increase airflow resistance, limiting the inspiratory and expiratory flows.17–19 In addition, patients with ARDS require precise lung protective ventilation strategies to avoid ventilator-induced lung injury,20 and bronchoscopy can be particularly challenging in this group. Even fibreoptic bronchoscopy may disrupt protective ventilation, causing large variations in airway pressures.12 21 Also the bronchoscopy is expensive in terms of both equipment and physician time. Therefore, a less invasive technique such as the ETA performed using a simple suction catheter may represent a useful alternative.7
Currently there have not been previous studies that have investigated lower airways inflammation in patients with ARDS using repeated ETAs.
Online supplementary table 5 summarises the results of the previous studies where a BAL has been performed within 96 hours after the onset of ARDS,22–42 as in our study.
Supplementary file 2
It is difficult to compare the results obtained with these two techniques because BAL samples the peripheral lung, whereas the ETA might sample the central lower airways. Previous studies analysing the suction catheter site by injecting contrast liquid and performing a chest radiography have proved that the catheter used for the endotracheal aspiration invariably wedges in the right bronchial tree.43
In addition, the majority of the BAL studies have recruited a small number of patients with heterogeneous ARDS aetiology using different statistical analysis. Furthermore, in some studies not all the clinical and/or the inflammatory data have been reported.
These previous studies showed a significant increase in total cell count in the BAL of patients with ARDS when compared with healthy subjects or non-ARDS patients, although with marked variability of the total cell count reported (online supplementary table 5). In comparison with our study, the median cell count was 305 (IQR 130–1270)×103/mL in ETAs within 24 hours from ARDS diagnosis with a median cell viability of 89 (IQR 80–93)%.
The median percentage of BAL neutrophils range is 68%–79% of all cells at an early stage of ARDS (online supplementary table 5), whereas in our study the median neutrophil percentage was 94.5 (IQR 82–97)%. We have shown here for the first time that the median neutrophil count was unaffected by the presence or absence of bacterial culture in ETA or the blood or by ARDS aetiology. In this contest, it should be noted that neutrophils increased consistently even in those patients with a supposed non-bacterial ARDS. Interestingly, the highest cell count was found in patients with pancreatitis, an endothelial cause of ARDS (online supplementary table 2).
The median percentage of BAL macrophages range is 2.1%–26.7% of all cells at an early stage of ARDS (online supplementary table 5), whereas in our study the median macrophage percentage was 4.5 (IQR 3–15)% and was significantly increased in patients with ARDS associated with acute pancreatitis compared with those associated with pneumonia (figure 3) but unaffected by the presence or absence of bacterial culture in ETA or the blood.
There are only few studies from patients with ARDS that have reported the BAL eosinophil count (online supplementary table 5). In one study,30 the mean BAL eosinophil percentage was 0.8%, whereas in our study the median eosinophil percentage was 0 (IQR 0–1)% and unaffected by the presence or absence of bacterial culture in ETA or the blood and/or the ARDS aetiology. We have shown here for the first time that there is a significant positive correlation between the total number of blood eosinophils and the total number of the same cells in the ETA (figure 4).
The median BAL lymphocyte percentage range is 5.5%–74% (online supplementary table 5), whereas in our study the median lymphocyte percentage was 0 (IQR 0–0.5) and unaffected by the presence or absence of bacterial culture in ETA or the blood and/or the ARDS aetiology.
There was no difference in the total cell counting and in cell viability as well as in the differential inflammatory cell count comparing the second ETA with the first ETA.
Our pilot study has many limitations. First, for a more accurate assessment of the lower airways inflammation at the light of the clinical heterogeneity of patients with ARDS, we need to increase in future studies the sample size to recruit a statistically adequate number of patients with different ARDS aetiology.
Second, almost half of our patients were current or former smokers and hence they could have an occult chronic obstructive pulmonary disease or emphysema. Further, we did not assess the presence expiratory flow limitation, a trigger for airways inflammation.44
Finally, we considered the Diff-Quik staining method adequate for evaluating the differential cell count as it is a fast, easy, reproducible and well-standardised technique, applied by the majority of the previous studies.23 31 33 34 37 However, the flow cytometry is the gold standard for characterising the lymphocyte subsets and for characterising the activation status and the subsets of the other inflammatory cells. Furthermore, we did not measure the level of the main inflammatory mediators in the supernatants using, for example, a multiplex ELISA.
Conclusions
ETA is an easy-to-perform and non-invasive procedure that can be used to investigate the cellularity of the lower airways in the patients with ARDS. Eosinophil counts are significantly correlated both in ETA and in blood. The number of macrophages in ETA may be affected by the aetiology of the ARDS.
References
Footnotes
Contributors Conceived and designed the protocol: IK, SS, GC, PC, CAV. Recruited the patients: IK, SS, EM, FB, RR. Laboratory work: IK, PC, TB. Analysed the data: IK, SS, PR, CAV. Wrote the paper: all authors. Review of manuscript: all authors. All authors read and approved the final manuscript.
Competing interests None declared.
Patient consent Obtained.
Ethics approval Ethics Committee of Ferrara.
Provenance and peer review Not commissioned; externally peer reviewed.
Data sharing statement Not available