Article Text

Abstract
Background Pneumonia is a major cause of mortality and morbidity, but the development of new antimicrobials is lacking. Radiological assessment of pneumonia severity may serve as an effective intermediate endpoint to reduce barriers to successful completion of antimicrobial trials. We sought to determine whether the Radiologic Severity Index (RSI) correlated with mortality and healthcare resource utilisation in patients with acute leukaemia undergoing induction chemotherapy.
Methods We measured RSI (range 0–72) on all chest radiographs performed within 33 days of induction chemotherapy in 165 haematological malignancy patients with pneumonia. Peak RSI was defined as the highest RSI score within 33 days of induction. We used extended Cox proportional hazards models to measure the association of time-varying RSI with all-cause mortality within the first 33 days after induction chemotherapy, and logistic regression or generalised models to measure the association of RSI with total daily cost and healthcare resource utilisation.
Results After adjustment for clinical variables, each one-point increase in RSI was associated with a 7% increase in all-cause 33-day mortality (HR 1.07, 95% CI 1.05 to 1.09, p<0.0001). Peak RSI values of 37.5 or higher were associated with 86% higher daily direct costs (p<0.0001), more days in intensive care unit (9.9 vs 4.8 days, p=0.001) and higher odds for mechanical ventilation (OR 12.1, p<0.0001).
Conclusions Greater radiological severity as measured by RSI was associated with increased mortality and morbidity in acute leukaemia patients with pneumonia. RSI is a promising intermediate marker of pneumonia severity and is well suited for use in antimicrobial trials.
- pneumonia
- imaging/CT MRI etc
- respiratory infection
This is an open access article distributed in accordance with the Creative Commons Attribution Non Commercial (CC BY-NC 4.0) license, which permits others to distribute, remix, adapt, build upon this work non-commercially, and license their derivative works on different terms, provided the original work is properly cited, appropriate credit is given, any changes made indicated, and the use is non-commercial. See: http://creativecommons.org/licenses/by-nc/4.0/.
Statistics from Altmetric.com
Key messages
Progression of the Radiologic Severity Index (RSI), a reproducible measure of how severe a pneumonia is on chest imaging, is associated with increased morbidity and mortality after pneumonia in immunocompromised hosts
Each one-point increase in RSI is associated with a 7% increase in mortality, and higher peak RSI measurements are associated with higher daily hospital costs and utilisation of intensive care unit resources.
We highlight the potential of the RSI as an intermediate marker of pneumonia severity in antimicrobial trials.
Introduction
Worldwide, over 2.7 million deaths are attributed to pneumonia annually,1 and the annual cost in the USA has been estimated at $8.4 billion.2 Although antimicrobial resistance is a major barrier to the successful treatment of pneumonia,3 the development of new antimicrobials has lagged behind the emergence of resistant pathogens.4 A major impediment to antimicrobial development is the difficulty in proving clinical superiority through reductions in mortality, because death is not always attributable to the pneumonia itself.5 Furthermore, pneumonia is associated with substantial long-term morbidity in proportion to pneumonia severity, and reductions in long-term morbidity would not be captured by an endpoint of short-term mortality.6 As a result of the weakness of mortality as an endpoint in studies of antimicrobials, the Food and Drug Administration (FDA) recommended in 2009 that investigators consider non-mortality endpoints when designing clinical trials.7
A recent international expert panel cited clinical cure, defined as (1) resolution of signs and symptoms of pneumonia and (2) resolution or stability of radiological signs of pneumonia, as the most relevant endpoint in pneumonia trials.8 Radiological progression of pneumonia would therefore constitute a failure to achieve clinical cure,9 10 but tools to precisely quantify radiological severity have only recently been developed.11–13 We have previously shown that radiological severity could be precisely and reliably quantified using the Radiologic Severity Index (RSI), a semiquantitative scoring tool.13 RSI ranges from 0 to 72, and each one-point increase in RSI was associated with a 13% increase in the hazard for 30-day mortality in a high-risk cohort of haematological malignancy (HM) patients with parainfluenza pneumonia. Furthermore, we showed that RSI progression improved estimates of mortality risk in immunocompromised HM patients with respiratory syncytial virus pneumonia as compared with using only validated immunodeficiency indices.12 Finally, unlike qualitative assessments of severity, we found that RSI was highly reliable when scored by experienced radiologists or pulmonary experts.12–15 Therefore, RSI is a promising marker of disease severity in patients with pneumonia that can be reliably measured with a simple chest radiograph.
Reductions in radiological severity by way of an effective antimicrobial treatment may potentially correlate with lower long-term morbidity or lower costs associated with pneumonia. We previously published that in patients with HM undergoing induction chemotherapy for acute myeloid leukaemia (AML), acute lymphoblastic leukaemia (ALL) or high-risk myelodysplastic syndrome (MDS), 33-day mortality after pneumonia was nearly 17%.16 Pneumonia was the strongest predictor of death after induction chemotherapy and was associated with a 49% increase in hospital costs. We sought to determine (1) whether RSI could predict the risk for mortality among the subset of patients with leukaemia who developed pneumonia, (2) whether higher RSI was associated with a higher utilisation of hospital and intensive care unit (ICU) resources after pneumonia and (3) whether increasing RSI correlated with higher hospital costs.
Methods
Study design
We had previously conducted a retrospective cohort study of pneumonia incidence in adult patients with AML, ALL or MDS between 1 January 2005 and 30 September 2009.16 In the current study, we examined data from the prior study in the subset of patients with leukaemia who developed pneumonia within 33 days of induction chemotherapy. We defined pneumonia as the presence of fever (temperature >38.3°C), cough, dyspnoea or hypoxaemia, and thoracic imaging findings consistent with pneumonia.17 Pneumonia status was adjudicated by experienced pulmonologists (JB-G, SEE, DO and BD). We excluded by consensus those with clinical volume overload as assessed by echocardiography, right heart catheterisation or response to diuretics. Furthermore, we excluded patients who had pneumonia prior to induction chemotherapy, since the extent and duration of pneumonia prior to induction could not be accurately estimated. Onset of pneumonia was defined as the first appearance of radiological infiltrates consistent with infection as identified by a senior thoracic radiologist (MG and JJE). All clinical and oncological data were collected prospectively from a database of patients with acute leukaemia. Bacterial and fungal organisms were identified using culture-based assays, while viral organisms were identified using direct fluorescent antibody assays. Chemotherapy was defined as intensive when cytarabine was used in a dose of 500 mg/m2 or greater daily as part of the regimen. Data on days in the hospital or ICU, hospital charges and costs, and daily absolute neutrophil counts (ANC) were obtained from institutional databases. Further details on the calculation of charges and costs were previously published in an online supplementary appendix.16
Radiological scoring
Two senior thoracic radiologists (MG and JJE) calculated RSI for each chest radiograph performed within 33 days of induction chemotherapy.13Table 1 illustrates how RSI is calculated. Briefly, chest radiographs were divided into three zones in each lung (six in total): upper (above the carina), middle (below the carina and above the inferior pulmonary vein) and lower (below the inferior pulmonary vein) in both lungs (figure 1). Pulmonary infiltrates were scored on a 3-point scale based on the predominant pattern in that zone—normal attenuation: 1; ground glass opacities (GGOs): 2; consolidation: 3. Consolidation and GGOs were defined per the Fleischner Society guidelines.18 In general, infiltrates were considered to be consolidation unless there was clear evidence of interstitial infiltrates, which were scored as GGOs. Dense clusters of nodules were considered to be consolidative infiltrates for the purpose of RSI scoring. We multiplied the pattern score by a factor based on the extent of the area involved, excluding non-lung areas: normal: 0; 1%–24%: 1; 25%–50%: 2; 51%–75%: 3; >75%: 4. Scores from each zone were added to give the final RSI, which ranges from 0 to 72.

Sample chest radiograph with illustrated partitions of lung zones used to calculate the Radiologic Severity Index. LL, left lower; LM, left middle; LU, left upper; RL, right lower; RM, right middle; RU, right upper.
Scoring algorithm for the RSI
Chest radiographs for the first 60 patients were scored by two readers to generate estimates of reproducibility, with the mean of both scores being used for analysis. The remainder of images were scored by a single reader. Radiologists were blinded to the primary outcome of death and to each other’s scoring. Baseline RSI was defined as the RSI score on the first radiograph which showed evidence of pneumonia. We defined peak RSI as the highest RSI score after the onset of pneumonia and delta RSI as the difference between baseline RSI and peak RSI.
Statistical analysis
We used χ2 or Fisher’s exact test to analyse categorical data. We used Student’s t-test or Wilcoxon rank-sum to analyse continuous data. We used an extended Cox proportional hazards model to measure the association of predictor variables with all-cause mortality within the first 33 days of induction chemotherapy after a diagnosis of leukaemia.19 RSI and ANC were analysed as time-varying covariates, and we used the last observation carried forward method to impute data on days in which imaging was not performed. Variables significantly associated with mortality with p values <0.2 in univariate analysis were candidate variables in multivariate extended Cox models, and we used backward elimination to only include variables with p<0.05. The proportionality assumption was assessed and confirmed for all non-time-varying covariates using Kolmogorov’s supremum test. We used univariate logistic regression models to determine the association of peak RSI and delta RSI with days in the hospital, ICU days and mechanically ventilated days. We also calculated the association of baseline RSI, peak RSI and delta RSI with direct and total hospital costs from induction to day 33 using a generalised linear modelling approach with a log-link function and gamma distribution. We calculated agreement between readers using intraclass correlation (ICC). P values <0.05 were considered statistically significant and all tests were two-sided. We used SAS V.9.4 for statistical analyses.
Patient and public involvement
This research was done without patient involvement. Patients were not invited to comment on the study design and were not consulted to develop patient-relevant outcomes or interpret the results. Patients were not invited to contribute to the writing or editing of this document for readability or accuracy.
Results
Baseline characteristics
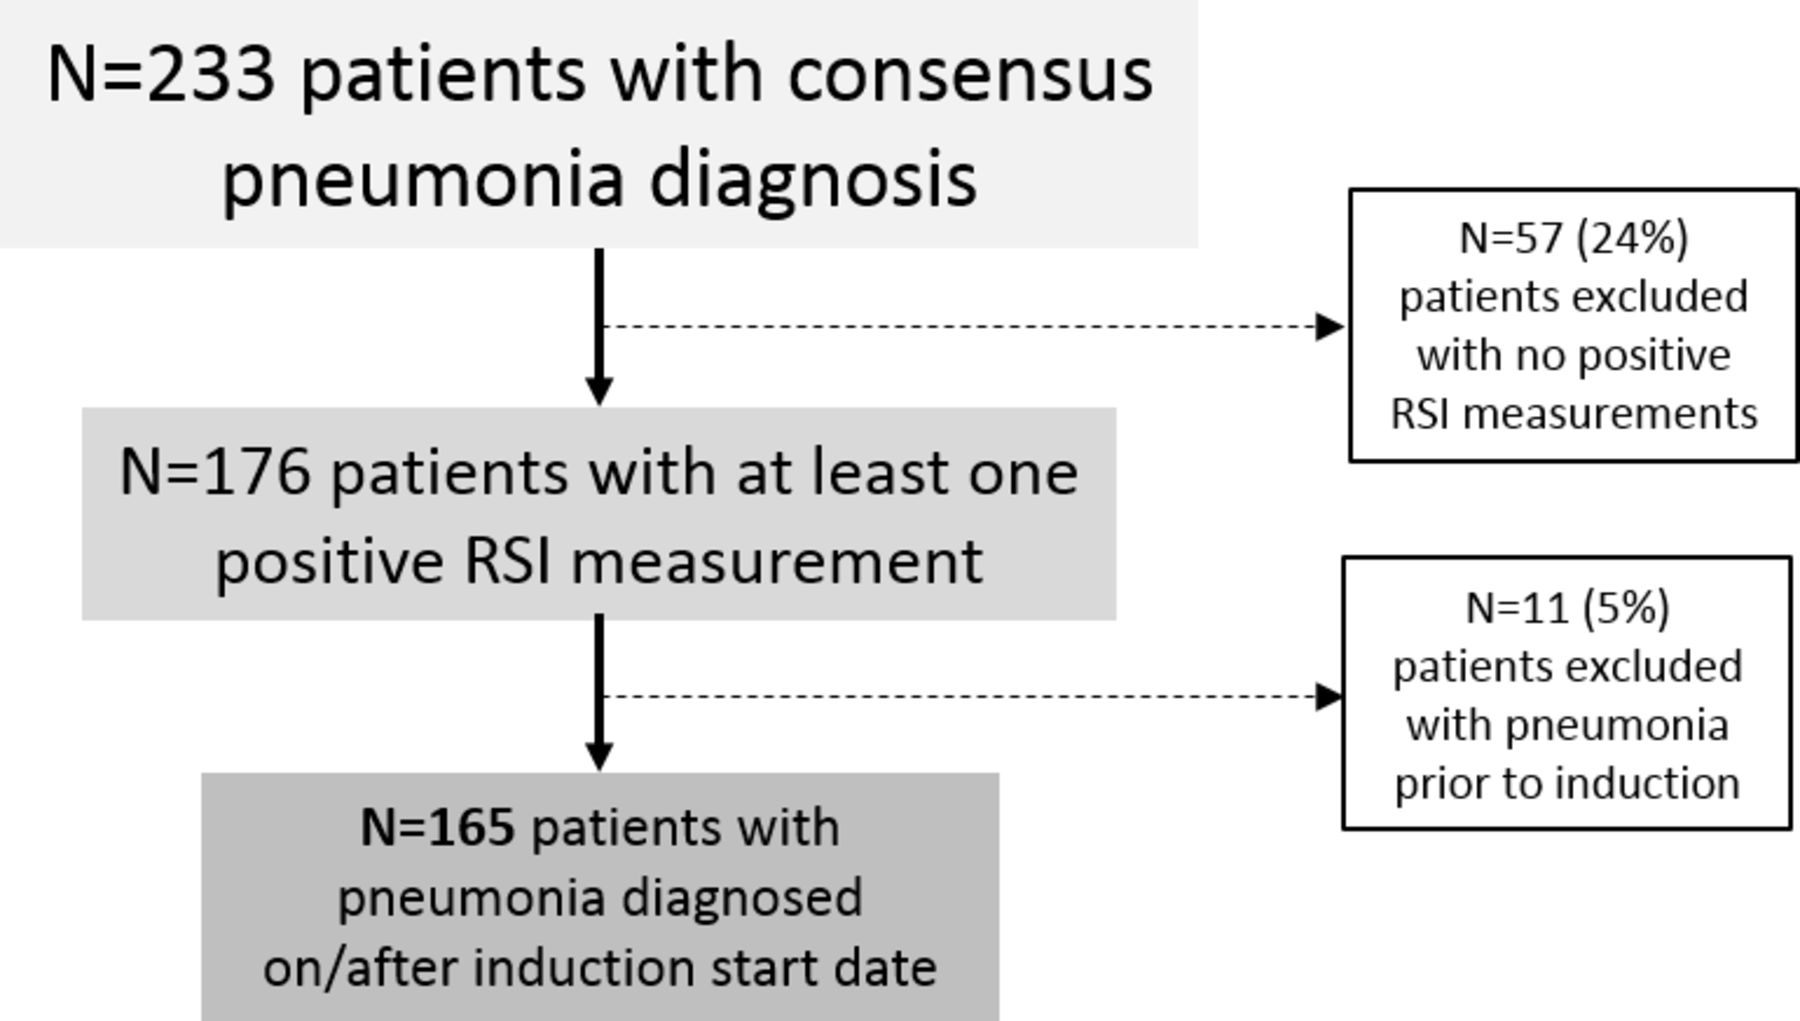
Figure 2 shows our selection of the study cohort. Of the 233 patients who were initially determined to have clinical signs of pneumonia, we excluded 57 patients who were not felt to have radiographic evidence of pneumonia and 11 patients who were diagnosed with pneumonia prior to induction chemotherapy. Table 2 compares the baseline characteristics between survivors and non-survivors. AML was the underlying malignancy in 90% of patients with pneumonia. Seventy-four per cent of patients had either grade 0 or 1 performance status as assessed by the Eastern Cooperative Oncology Group criteria.20 Anaemia, thrombocytopaenia and neutropaenia were common in survivors and non-survivors.

Enrolment flow chart for haematological malignancy patients with pneumonia during induction chemotherapy. RSI, Radiologic Severity Index.
Baseline characteristics by 30-day survival status
Progression of RSI as a predictor of mortality
In our primary extended Cox model, we incorporated 912 measurable RSI scores (median RSI scores/patient: 4). In 323 cases where two readers measured RSI, the ICC was 0.98 (95% CI 0.975 to 0.984). Non-survivors underwent more radiological tests within the study period (median number of total radiological tests: non-survivors: 8; survivors: 3). In univariate Cox regression models (table 3), each one-point increase in RSI was associated with a 6% increase in the hazard for death (HR 1.06, 95% CI 1.04 to 1.08, p<0.0001). Furthermore, higher baseline bilirubin (HR 1.6, 95% CI 1.2 to 2.2, p=0.004) and a diagnosis of ALL (HR 3.3, 95% CI 1.0 to 11.1, p=0.05) were associated with higher mortality. Sputum culture was significantly associated with survival status, primarily due to a lower risk in patients who did not have testing performed (HR 0.3 compared with positive cultures, 95% CI 0.1 to 0.7, p=0.004). Supporting this, the median peak RSI scores were lower in patients who did not undergo sputum testing (peak RSI: 19.5) as compared with those with negative cultures (median peak RSI: 36) and those with positive cultures (median peak RSI: 44.25). In the final multivariate model, time-varying RSI (HR 1.07, 95% CI 1.05 to 1.09, p<0.0001) and baseline bilirubin (HR 1.7, 95% CI 1.2 to 2.3, p=0.001) remained in the model after adjustment for sputum culture (p=0.02). Figure 3A–C shows the predicted versus the observed rates of 33-day mortality, and figure 3D shows the receiver operating characteristic curves for baseline RSI, peak RSI and delta RSI. Peak RSI had the greatest area under the receiver operating characteristic curve (AUC: 0.81, optimal cutpoint: 37.5) as compared with delta RSI (AUC: 0.76, optimal cutpoint: 24) or baseline RSI (AUC: 0.59, optimal cutpoint: 30). Using 37.5 as the cutpoint for peak RSI yielded a sensitivity of 79% and a specificity of 71% for mortality at 33 days after induction. Including sputum culture and baseline bilirubin along with peak RSI in the model increased the AUC to 0.85, yielding a sensitivity of 75% and specificity of 87%.

Observed versus predicted mortality for (A) peak RSI, (B) delta RSI and (C) baseline RSI. Peak RSI and baseline RSI had acceptable calibration for the prediction of 33-day mortality, while baseline RSI was poorly calibrated. (D) ROC curves for baseline RSI (short dashes), delta RSI (short dashes and dots) and peak RSI (alternating long and short dashes). Peak RSI had the best discrimination for association with 33-day mortality. ROC, receiver operating characteristic; RSI, Radiologic Severity Index.
Univariate and multivariate Cox regression models for the prediction of 33-day mortality
Association of RSI with healthcare utilisation
Table 4 shows the association of baseline RSI, peak RSI and delta RSI with total daily cost, inpatient length of stay, ICU admission, ICU length of stay and odds of requiring mechanical or positive pressure ventilation. Peak RSI and delta RSI were significantly associated with daily cost, risk for ICU admission, risk for mechanical ventilation and length of ICU stay. Using the peak RSI threshold of 37.5 as an example for classifying patients as high risk or low risk, we found that high-risk patients had 83% higher total costs per day compared with low-risk patients (p<0.0001) and 86% higher direct costs per day (p<0.0001). In addition, high-risk patients had a greater risk of ICU admission (OR: 8.1, 95% CI 3.9 to 16.7, p<0.0001), longer ICU length of stay (mean: 9.9 days (95% CI 7.5 to 12.3 days) vs 4.8 days (95% CI 2.7 to 7.0 days), p=0.001) and greater risk for mechanical ventilation (OR: 12.1, 95% CI 5.2 to 28.2, p<0.0001). Interestingly, peak RSI was a significant predictor of mortality among patients receiving mechanical ventilation (HR 1.03, 95% CI 1.00 to 1.06, p=0.049; n=21/43, 51%) but not among patients who did not receive mechanical ventilation (HR 1.02, 95% CI 0.92 to 1.06, p=0.29; n=7/122, 6%), potentially due to the lower mortality rate in patients who died during the study period without mechanical ventilation. We found that peak RSI was still significantly associated with mortality when we considered only chest X-rays before mechanical ventilation (HR 1.04, 95% CI 1.02 to 1.06, p=0.0001). Thirty-seven per cent of patients underwent bronchoscopy with bronchoalveolar lavage (BAL). BAL was more commonly performed in patients requiring mechanical ventilation (53% vs 31%, p=0.03). Peak RSI (OR 1.03, 95% CI 1.01 to 1.04, p=0.0009) and delta RSI (OR 1.03, 95% CI 1.02 to 1.05, p=0.0002) were significantly associated with utilisation of bronchoscopy, while baseline RSI was not (OR 1.00, 95% CI 0.98 to 1.02, p=0.98). Baseline RSI was only associated with risk of ICU admission, but not other estimates of healthcare utilisation. Only delta RSI was associated with total inpatient length of stay, although this metric is confounded by patients who experience early mortality after pneumonia.
Association of RSI with healthcare resource utilisation
Discussion
In this study, we show that progression of radiological severity, as measured by RSI, is associated with mortality after pneumonia in patients with acute leukaemia undergoing induction chemotherapy. Furthermore, higher RSI scores were associated with increased costs and utilisation of ICU resources and mechanical ventilation. Our findings suggest that RSI has potential to capture attributable mortality and morbidity in high-risk patients with pneumonia.
Our study shows that RSI is highly associated with 33-day mortality after pneumonia in patients undergoing induction chemotherapy for leukaemia. After adjustment for baseline serum bilirubin and sputum culture, each one-point increase in RSI conferred a 7% increase in the risk for death at day 33. This per-point increase in mortality is in line with our prior reports of RSI in parainfluenza13 and respiratory syncytial virus pneumonias.12 Furthermore, changes in RSI are likely to be attributable to changes in the clinical severity of pneumonia since they are derived directly from radiological assessments. Finally, our ICC of 0.98 shows excellent inter-rater reliability. Therefore, RSI offers a precise, reproducible assessment of attributable mortality risk in high-risk patients with pneumonia.
We also found that peak RSI and delta RSI are highly associated with daily inpatient costs and utilisation of ICU resources. Prior studies have reached discrepant conclusions about whether pneumonia risk scores predict cost and healthcare utilisation. For example, in lower-risk patients with community-acquired pneumonia (CAP), higher baseline CURB-65 and Pneumonia Severity Index (PSI) scores did not predict higher costs attributed to CAP, although non-survivors had lower direct costs due to mortality.21 Similarly, in a German cohort of CAP, PSI score did not influence treatment costs, likely also due to early mortality with higher PSI scores.22 However, in a Japanese cohort, increasing A-DROP scores correlated with higher cost and mortality after CAP.23 Other studies in Europe have shown that higher PSI scores24 25 and CURB-65 scores26 predict higher hospitalisation costs and increasing hospital and ICU utilisation.27 Discrepancies in these studies may arise because clinical risk indices are only assessed at baseline and do not necessarily correlate with pneumonia progression, or because early mortality limits direct costs of treatment. Our study shows that progression of pneumonia severity, as measured by peak RSI or delta RSI, correlates well with daily inpatient costs, utilisation of ICU and mechanical ventilation, and ICU length of stay. This suggests that RSI is not only associated with mortality, but also with a greater utilisation of healthcare resources due to increased morbidity.
An expert panel determined by majority that clinical cure of pneumonia could be defined by stability or improvement in the chest radiograph 7–10 days after the initiation of therapy.8 However, this endpoint would depend heavily on the time of initial imaging. Initial chest radiographs on ICU admission for pneumonia are likely to be abnormal,11 while our studies of viral pneumonia suggest that radiological severity is often mild at the time of diagnosis.12 13 In the scenario where radiological severity is substantial at baseline, stability or improvement in radiological severity would be reasonable as a surrogate for clinical cure. However, in the scenario where radiological severity is modest at baseline, progression of radiological severity at a prespecified timepoint as a measure of clinical failure may be a more suitable endpoint, as the FDA has previously suggested.28 The precise timing of when to measure clinical cure or treatment failure is controversial.8 29 30 Various groups have advocated that clinical success or failure be measured at 3, 5, 7 or 10 days after treatment initiation, and this discrepancy likely reflects, in part, on differences in rates of pneumonia progression in different populations. Irrespective of these details, RSI would be well suited to precisely determine stability, resolution or progression of pneumonia, and the current study validates radiological changes in pneumonia as clinically relevant due to their strong association with mortality and utilisation of healthcare resources. For example, a peak RSI score of 37.5 or greater at a prespecified timepoint after treatment would be associated with a greater than ninefold increased risk of death and 60% higher daily costs as compared with patients with a peak RSI less than 37.5. Future prospective studies using RSI as a marker of pneumonia severity could help clarify optimal peak RSI cutpoints and timepoints that would constitute treatment failure of pneumonia.
In our study, total bilirubin at the time of induction was a strong predictor of mortality. In general, bilirubin has a non-linear association with all-cause mortality.31 Lower levels of bilirubin have been associated with higher all-cause mortality32–34 in the general population, while higher levels are associated with worse outcomes in bacterial pneumonia.35 36 In the current study, we show that higher bilirubin levels were associated with increased mortality after induction chemotherapy even after adjustment for RSI, likely reflecting greater severe systemic illness prior to induction. In particular, this finding highlights the difficulty of using mortality as an endpoint in antimicrobial trials, because greater baseline systemic illness may not be a modifiable factor.
We also found that mortality was higher in patients in whom a pulmonary pathogen was identified in sputum culture as compared with those in whom a sputum culture was not performed. Isolation of a pulmonary pathogen is associated with increased mortality in high-risk pneumonia.37 38 We found that culture-positive pneumonia was associated with higher mortality as compared with patients whose sputa were not tested, but not higher than in patient with culture-negative pneumonia. Indeed, peak RSI was significantly lower in patients who did not provide sputum samples. It is possible that the similar mortality in culture-negative and culture-positive pneumonia could reflect misclassification due to the low sensitivity of sputum culture.39 This uncertainty in classification with culture-based methods highlights the need for new diagnostic techniques, such as metagenomic approaches.40
Our study must be interpreted in the context of certain limitations. RSI measurements were not obtained systematically after pneumonia onset because imaging was obtained based on clinical need. However, any measurement bias would likely introduce noise and bias our results towards the null hypothesis, because a lack of measurements in healthier patients would result in an overestimation of the severity of resolving pneumonia, while a lack of measurements in sicker patients (eg, non-survivors) would result in an underestimation of progressive pneumonia. Because data were collected from the time of induction chemotherapy and not from the onset of pneumonia, we may have underestimated mortality risk in patients who developed pneumonia towards the end of the study period. This would likely bias our results towards the null; however, most of our patients developed pneumonia in the first 2 weeks of the study period. Pneumonia-specific costs were not available for analysis, and cost data reflect total daily costs. We were not able to measure the association of RSI with hypoxaemia, since data on oxygenation were not always available, and the administration of supplemental oxygen was not necessarily performed by protocol. While peak RSI and delta RSI were associated with ICU length of stay, this measurement may be confounded by early mortality, although this would bias our results towards the null hypothesis. Finally, RSI scoring has not yet been validated outside our institution.
Conclusions
In summary, we show that progression of radiological infiltrates as assessed by RSI is predictive of 33-day mortality in a high-risk cohort of patients with pneumonia undergoing induction chemotherapy. RSI also correlated with utilisation of healthcare resources, as measured by daily inpatient costs, ICU admission and mechanical ventilation rates, and ICU lengths of stay. Our study shows that RSI is an important intermediate marker of pneumonia severity and would be ideal for determining clinical cure rates in clinical trials of antimicrobial agents.
References
Footnotes
Presented at This work was previously presented at the American Thoracic Society 2017 Conference.
Contributors AS, MG, SG, SEE, JB-G, RFC, BD and DO contributed to study planning and design. AS, MG, JJE, SEE, JB-G, BD and DO contributed to the conduct of the study. AS, MG, JJE, SG, AH and DO contributed to data acquisition and analysis. All authors contributed to writing the final draft of the manuscript.
Funding This study was funded by a sponsored research agreement with Pulmotect (Houston, Texas) and supported by a grant from the National Institute of Allergy and Infectious Diseases (K23 AI117024 to AS) and the National Cancer Institute (Cancer Center Support Grant, P30 CA016672, Biostatistics Resource Group) at the National Institutes of Health. The sponsor had no role in the conception, design, conduct or analysis of the study and in the preparation of the manuscript.
Competing interests SEE and BD are inventors of a technology to deliver aerosolised TLR ligands to induce resistance to microbial infection of the lungs; this technology has been licensed by MD Anderson Cancer Center to Pulmotect (Houston, Texas, USA), in which SEE and BD have ownership interests, and which has sponsored research in the laboratories of BD. RFC reports receiving research grants from Ansun Pharmaceuticals and Pulmotect.
Patient consent for publication Not required.
Ethics approval This study was approved by our Institutional Review Board with a waiver of informed consent (PA16-1091).
Provenance and peer review Not commissioned; externally peer reviewed.
Data availability statement Data are available upon reasonable request.