Article Text

Abstract
Background Spirometry interpretation is influenced by the predictive equations defining lower limit of normal (LLN), while ‘distal’ expiratory flows such as forced expiratory flow at 50% FVC (FEF50) are important functional parameters for diagnosing small airway disease (SAD). Area under expiratory flow-volume curve (AEX) or its approximations have been proposed as supplemental spirometric assessment tools. We compare here the performance of AEX in differentiating between normal, obstruction, restriction, mixed defects and SAD, as defined by Global Lung Initiative (GLI) or National Health and Nutrition Examination Survey (NHANES) III reference values, and using various predictive equations for FEF50.
Methods We analysed 15 308 spirometry-lung volume tests. Using GLI versus NHANES III LLNs, and diagnosing SAD by the eight most common equation sets for forced expiratory flow at 50% of vital capacity lower limits of normal (FEF50 LLN), we assessed the degree of diagnostic concordance and the ability of AEX to differentiate between various definition-dependent patterns.
Results Concordance rates between NHANES III and GLI-based classifications were 93.7%, 78.6%, 86.8%, 88.0%, 93.8% and 98.8% in those without, with mild, moderate, moderately severe, severe and very severe obstruction, respectively (agreement coefficient 0.81 (0.80–0.82)). The prevalence of SAD was 0.6%–6.9% of the cohort, depending on the definition used. The AEX differentiated well between normal, obstruction, restriction, mixed pattern and SAD, as defined by most equations.
Conclusions If the SAD diagnosis is established by using mean FEF50 LLN or a set number of predictive equations, AEX is able to differentiate well between various spirometric patterns. Using the most common predictive equations (NHANES III and GLI), the diagnostic concordance for functional type and obstruction severity is high.
- lung physiology
- respiratory measurement
- asthma
- lung transplantation
This is an open access article distributed in accordance with the Creative Commons Attribution Non Commercial (CC BY-NC 4.0) license, which permits others to distribute, remix, adapt, build upon this work non-commercially, and license their derivative works on different terms, provided the original work is properly cited, appropriate credit is given, any changes made indicated, and the use is non-commercial. See: http://creativecommons.org/licenses/by-nc/4.0/.
Statistics from Altmetric.com
Key messages
Is area under expiratory flow-volume curve (AEX) useful in assessing small airway disease (SAD)?
The AEX can be used as a useful additional tool in diagnosing the spirometric pattern of SAD.
Comparing various predicted equations for normal spirometry, we show that prevalence of SAD varies considerably. Using the most common predictive equations (National Health and Nutrition Examination Survey III and GLI), the diagnostic concordance for functional type and severity is high.
Introduction
Interpretation of pulmonary function testing (PFT) relies mainly on comparisons between measured flows or volumes and predicted, upper and lower limit of normal values (ULN or LLN, respectively), as determined by specific reference equations, derived from healthy individuals originating from similar populations.
In spirometry, obstruction is defined as forced expiratory volume in 1 s to forced vital capacity (FEV1/FVC) ratio below the fifth percentile of its distribution (LLN). Restriction is suggested by either FVC <FVCLLN or FVC <FVCLLN when FEV1/FVC ratio is ≥FEV1/FVCLLN; in this situation or when mixed ventilatory defects are suspected, full lung volume testing becomes necessary as the diagnostic gold standard. Lastly, small airways disease (SAD) is usually defined when the following criteria are satisfied: normal FVC, normal FEV1/FVC ratio and forced expiratory flow at 50% FVC (FEF50) < forced expiratory flow at 50% of vital capacity lower limits of normal (FEF50 LLN),1 Not only that FEF50 has very high variability and wide CIs for its predicted values, but many reference equations have been published and validated over the years, in different populations.2–9 As such, the nosological definition of SAD lacks precision and unequivocal functional criteria. Nevertheless, early detection of SAD is of great importance in optimising the diagnosis and treatment of asthma, chronic obstructive pulmonary disease, various bronchiolitides, in occupational exposures, and in chronic lung allograft dysfunction or rejection. Two of the most widely used spirometric predictive equations for FEV1, FVC and FEV1/FVC are the National Health and Nutrition Examination Survey (NHANES) III10 and the more comprehensive, recently published Global Lung Initiative (GLI).11 Unfortunately, neither of these equation sets include predicted values or LLNs for FEF50.
In previous work, we described the diagnostic utility of a spirometric parameter called area under expiratory flow-volume curve (AEX) and its approximations12–14 as alternative measurements for categorising and estimating the severity of PFT impairments, with the intent to reduce the need to perform lung volume testing. The AEX is the bound integral function of flow (L·s–1, Y axis) by volume (L, X axis) during a forced expiration manoeuvre from TLC to RV. Although AEX can be computed by digital spirometry software, AEX values appear currently to be offered by only a minority of PFT equipment manufacturers.
To address the above shortcomings and to enhance the diagnostic accuracy and value of spirometry, this study evaluates the diagnostic value of AEX in defining the type (normal, obstruction, restriction, mixed defects or SAD) and the severity of impairment compared with the most common reference equations, NHANES III and GLI.
Methods
The dataset included 15 308 consecutive tests consisting of spirometry and same-day lung volume determinations, performed in the Cleveland Clinic PFT Laboratory on 9328 distinct adult subjects, over a period of 10 years. Spirometry was performed following the American Thoracic Society (ATS) standards.15–17 Body plethysmography and helium dilution techniques were used to assess lung volumes per ATS/European Respiratory Society (ERS) standards and criteria.1 15 18 Functional testing was performed by using a Jaeger Master Lab system (Wurzberg, Germany). The lung function studies were independently reviewed by PFT technicians and interpreting physicians for reproducibility, accuracy and for quality assurance (ie, ATS/ERS criteria of acceptability).15–17 The actual AEX, as computed by the PFT software, was selected from the best manoeuvre, that is, the trial that generated the highest AEX. For the purpose of comparison, reference values from both NHANES III and GLI were used for spirometry interpretation.10 11 For lung volumes, the reference values used were those published by Crapo et al.19 With respect to FEF50, we decided to compute the LLN values based on the main published sets of reference equations.2-9 Using eight of the most common predictive equations, we classified the presence of SAD as possible, probable, highly probable or definite if the FEF50 was <FEF50 LLN from 5, 6, 7 or all 8 of the eight equations. We also computed the average of all eight FEF50 LLN for every subject tested (‘mean FEF50 LLN’).
Categorical variables were displayed as counts and percentages and compared using Pearson χ2 tests. The goodness of fit for the continuous variables’ distributions was assessed using Shapiro-Wilk W (n<2000) or Kolmogorov-Smirnov-Lillefors (n>2000) tests (normal distributions), Kolmogorov’s D test (exponential or logarithmic distributions) or Cramer-von Mises W (Weibull or gamma distributions), as appropriate. Continuous variables were reported as mean±SD or median (25th–75th IQR), and were compared using Student’s t-test or Tukey-Kramer HSD (parametric), Welch’s analysis of variance or Wilcoxon/Kruskal-Wallis rank sum (non-parametric) tests, as appropriate.
Statistical significance was defined as p<0.05. Analyses were performed using JMP Pro V.14.
Patient and public involvement
None (as this involves secondary analyses of data).
Results
Among the subjects tested, 51% were men and 49% women; 86% were White and 13% African-American. Median (IQR) for age, height, weight and body mass index were 57 (47–67) years, 168 (161–175) cm, 79 (66–94) kg and 28 (24–32) kg/m2, respectively. All subjects had spirometry. The helium dilution method was used in 40%, and body plethysmography in 60% of volume determinations. The median (IQR) for FEV1, FVC and FEV1/FVC were 1.77 (1.09–2.49) L, 2.81 (2.14–3.59) L and 0.62 (0.47–0.78), respectively. Mean±SD and median (IQR) for AEX and Sqrt AEX were 6.64±6.13, 4.88 (1.95–9.48) L2·s–1; and 2.32±1.13, 2.21 (1.40–3.08) L·s–0.5, respectively.
Based on FEV1 percent predicted by NHANES III references, obstruction was present in 39.4% of the tests; among them, the degree of severity (using standard ATS/ERS stratification criteria)1 was as follows: mild (6%), moderate (11%), moderately severe (14%), severe (22%) and very severe (46%). When using GLI predictive splines, obstruction was present in 42.6% of tests; among these, airflow limitation was mild in 7%, moderate in 14%, moderately severe in 14%, severe in 22% and very severe in 43%.
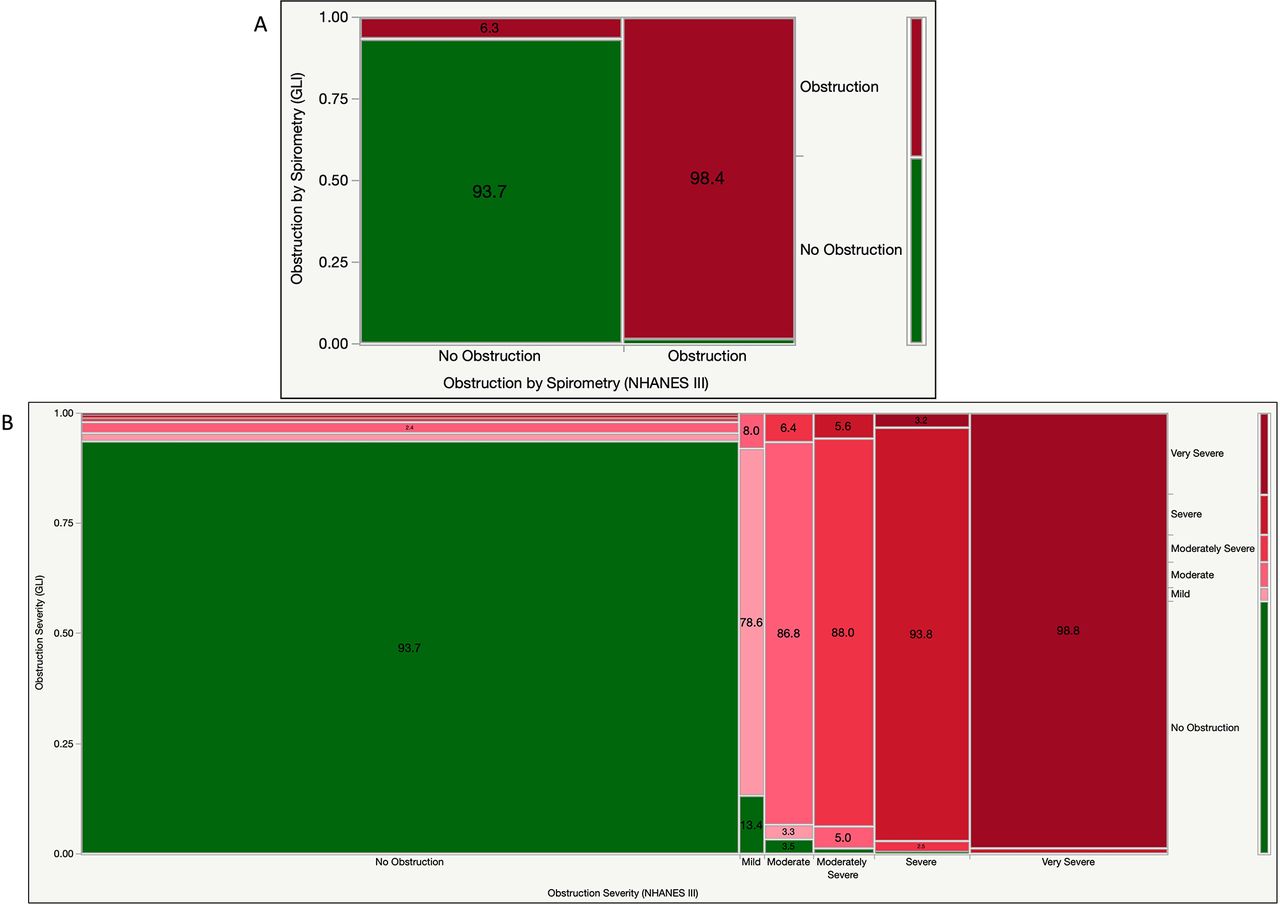
Figure 1A shows an overall reclassification rate of 4.4% when using GLI versus NHANES III (6.3% among those without and 1.6% in those with obstruction by NHANES III equations). The kappa agreement coefficient was 0.91 (CI 0.90 to 0.92). When lung volume testing was performed, the overall rate of reclassification was 8.3% (10.7% in the group without obstruction and 6.2% in the group with obstruction by NHANES III criteria).

(A) Mosaic plot illustrating concordance and discordance rates between NHANES III and GLI—defined obstruction. P<0.0001 (Pearson test). Colour codes: green: no obstruction; red: obstruction. (B) Mosaic plot illustrating concordance and discordance rates between NHANES III and GLI—defined obstructive ventilatory defects, using standard American Thoracic Society severity stratification. P<0.0001 (Pearson test). Colour codes: green: normal; light pink: mild obstruction; darker pink: moderate obstruction; light red: moderately severe; red: severe; dark red: very severe. GLI, Global Lung Function Initiative; NHANES III, National Health and Nutrition Examination Survey 3.
Figure 1B shows that using GLI equations, the reclassification rate was 6.3% in the group without obstruction by NHANES III criteria (of which 1.8, 2.4, 1.1, 0.7 and 0.2% were deemed to have mild, moderate, moderately severe, severe or very severe obstruction by GLI). By obstruction severity, we reclassified 21.4%, 13.2%, 12.0%, 6.2% and 1.2% of those with mild, moderate, moderately severe, severe and very severe obstruction by NHANES III, respectively (figure 1B). The kappa coefficient of agreement was 0.81 (CI: 0.80 to 0.82).
When using both spirometry and lung volume determinations (per the ATS/ERS diagnostic algorithm),1 a normal test was found in 27.6% and 28.2%, obstruction was present in 49.9% and 50.8%, restriction in 18.7% and 16.4%, and mixed impairment in 3.8% and 4.5% in NHANES III and GLI-defined patterns, respectively (table 1). The kappa statistic was 0.83 (0.82–0.84). Approximately 25% of the tests showed restriction, defined as TLC <TLCLLN on lung volume testing.
Ventilatory pattern distribution versus classification schema and predictive equations used. Classification 1 included spirometry only (FEV1/FVC vs FEV1/FVCLLN). Classification 2 partitioned ventilatory impairments based on FEV1/FVC versus FEV1/FVCLLN, FVC versus FVCLLN and TLC versus TLCLLN (observed vs lower limit of normal, LLN)
Using the most commonly used predictive equations for FEF50 LLN (figure 2),2–9 SAD was possible in 4.6%, probable in 2.9%, highly probable in 2.2% or definite in 0.6% of cases, that is, when FEF50<FEF50 LLN using at least 5, 6, 7 or all 8 of the eight equations used for comparison. By comparing FEF with the mean FEF50 LLN (ie, the average of all eight FEF50 LLN from the respective predictive equations), the prevalence of SAD was 6.9%.
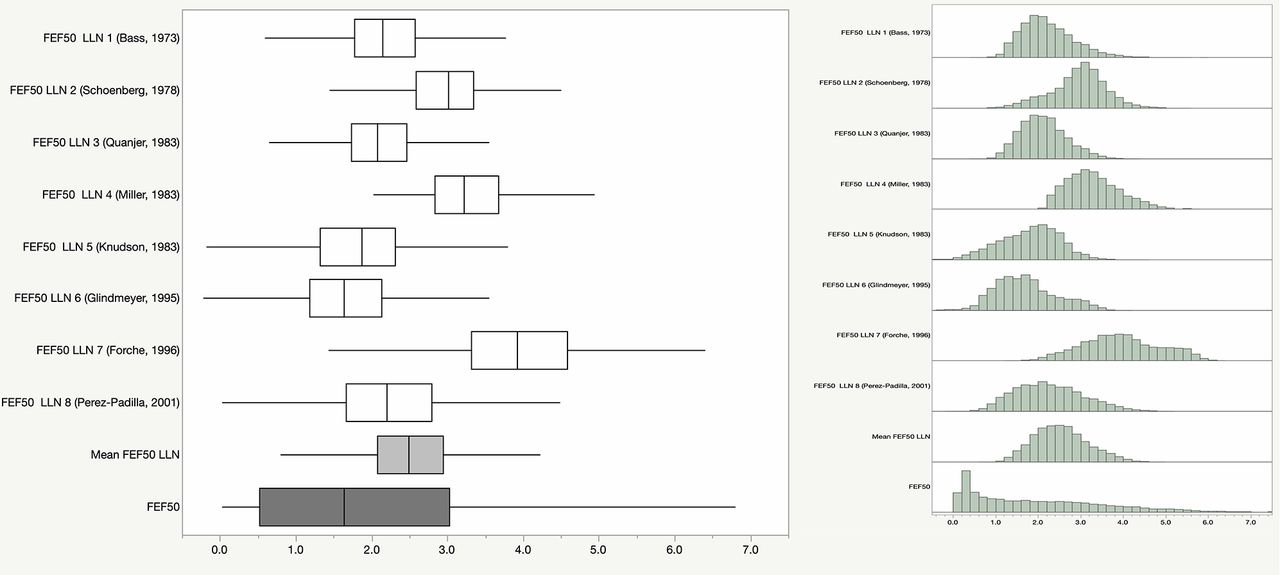
Box-and-whisker and histogram plots of FEF50 LLN by eight different predictive equations2–9, their average and actual FEF50 measurements. FEF50, forced expiratory flow at 50% FVC; FEF50 LLN, forced expiratory flow at 50% of vital capacity lower limits of normal.
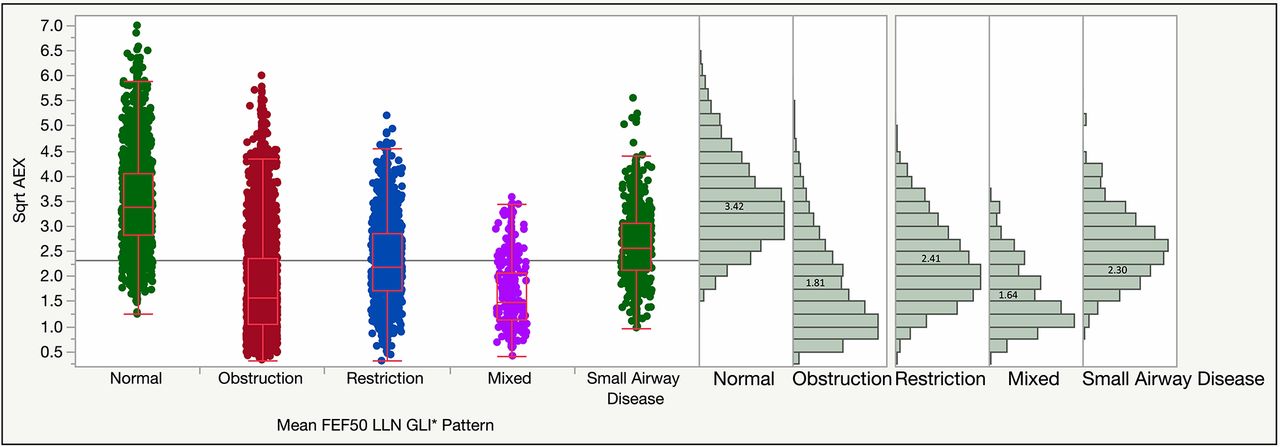
By using either NHANES III or GLI reference equations (figure 3A and B), Sqrt AEX differentiated well between normal lung function, obstruction, restriction and mixed ventilatory defects. The mean Sqrt AEX was 2.30 in restriction, 1.81 in obstruction and 1.64 in mixed defects (as defined by GLI equations). Average Sqrt AEX was 2.41, 2.33, 2.25 and 2.01 L2·s–1 in possible, probable, highly probable and in definite SAD, respectively. When Sqrt AEX was assessed by functional patterns, all in-between differences were statistically significant when SAD was defined by FEF50 <mean FEF50 LLN (p<0.0001, figure 4). In possible, probable or highly probable SAD, the differences between restriction and SAD were not statistically significant (although easily differentiated clinically by abnormal vs normal FVC), while in definite SAD, the Sqrt AEX was significantly smaller than in those with restriction, and undifferentiable from those with obstruction (but also easily categorised clinically by normal vs abnormal FEV1/FVC ratio).
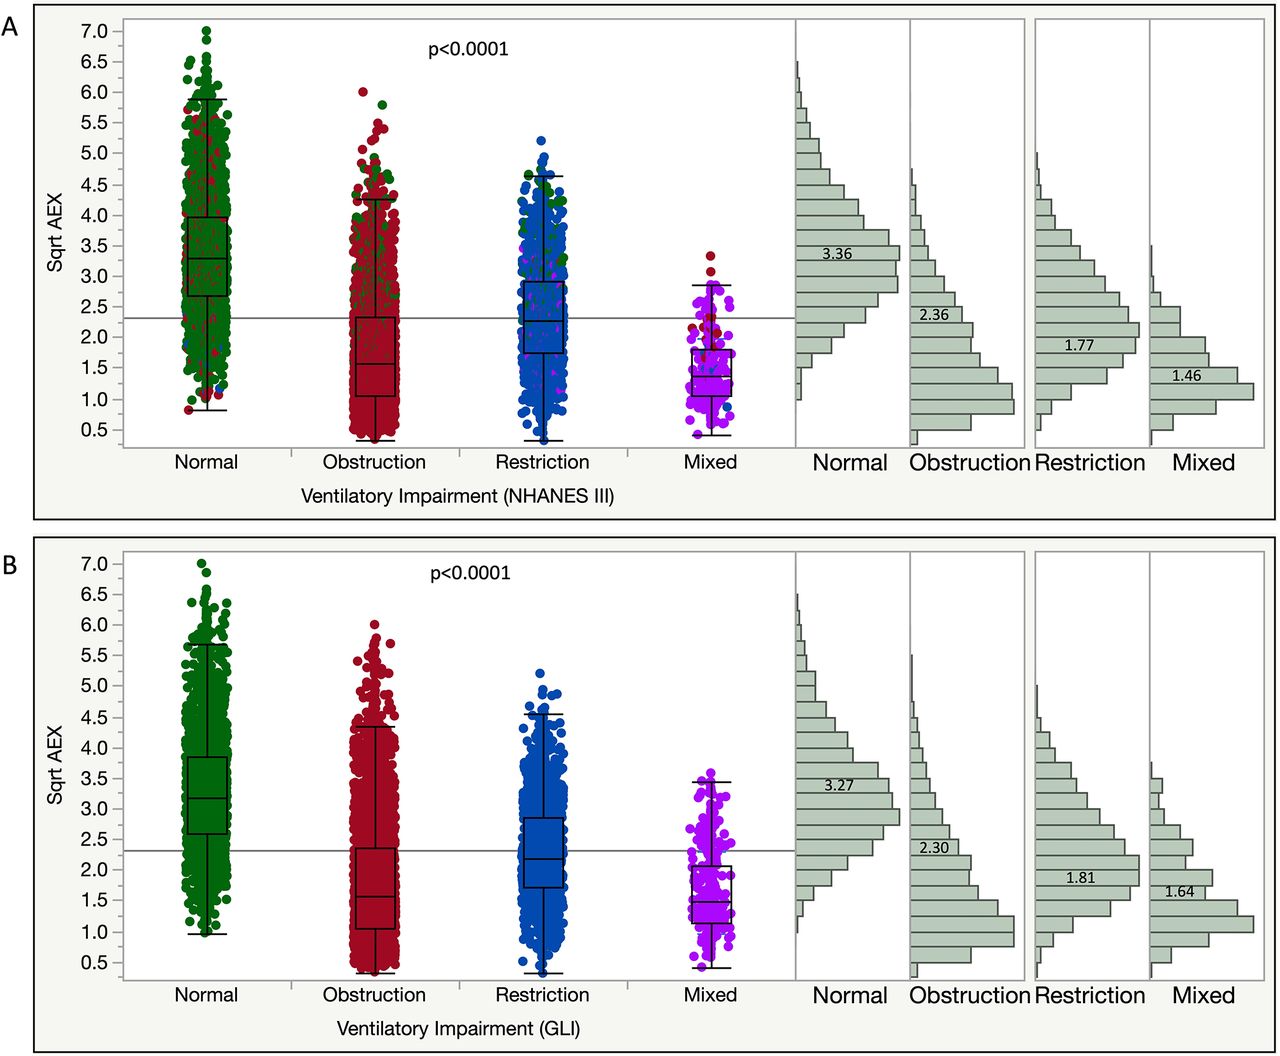
Sqrt AEX differentiates well between various functional patterns in both NHANES III ((A), top) and GLI ((B), bottom) classifications. P<0.0001 (for all in-between group comparisons, Welch’s ANOVA and Kruskal-Wallis tests). Colour codes: green: normal; red: obstruction; blue: restriction; purple: mixed ventilatory defects (as defined by GLI equations). ANOVA, analysis of variance; GLI, Global Lung Function Initiative; NHANES III, National Health and Nutrition Examination Survey 3; Sqrt, square root.
Box-and-whisker plots and distributions of Sqrt AEX by functional patterns, as defined by GLI equations for normal, obstruction, restriction, mixed ventilatory defects and SAD; the latter, a subgroup of normal spirometry if no distal flows are analysed, is defined as FEF50<mean FEF50 LLN (ie, the mean of all eight FEF50 LLN, as per the respective predictive equations, L·s–1).2–9 P<0.0001 (for all in-between group comparisons, Kruskal-Wallis rank sum and Welch’s ANOVA tests). AEX, area under expiratory flow-volume curve; ANOVA, analysis of variance; FEF50 LLN, forced expiratory flow at 50% of vital capacity lower limits of normal; GLI, Global Lung Function Initiative; NHANES III, National Health and Nutrition Examination Survey 3; SAD, small airway disease; Sqrt, square root.
Discussion
In spirometry, obstruction is optimally defined by FEV1/FVC<FEV1/FVCLLN, while restriction is suggested by either FVC <FVCLLN or FVC <FVCLLN when FEV1/FVC≥FEV1/FVCLLN. In the latter situation or when mixed ventilatory defects are suspected, confirmatory lung volume measurements are necessary. When comparisons are performed between total lung capacity (TLC), TLCLLN and TLCULN, the following patterns can be identified: normal (TLCLLN<TLC<TLCULN), thoracic overdistension (TLC >TLCULN) or restriction (TLC <TLCLLN). Similarly, airway hyperinflation can be defined as functional residual capacity (FRC) >FRCULN, residual (RV) >RVULN or RV/TLC >RV/TLCULN. Lastly, SAD is usually defined as normal FVC, normal FEV1/FVC ratio and FEF50<FEF50 LLN.1 Not only that FEF50 has very high variability and wide CIs for its predicted values but, over the years, many reference equations have been published and validated in different populations.2–9 Two of the most widely used spirometric predictive equations are represented by NHANES III10 and by the more comprehensive, recently published Global Lung Function Initiative (GLI).11 Neither of these equation sets includes predicted or LLN values for FEF50.
The appeal of AEX relates to the existing limitations of spirometry and its current interpretive strategies. For example, an obstructive defect is currently defined per ATS/ERS recommendations1 as a reduced FEV1/FVC ratio below the fifth percentile. However, it is well-known that sometimes, the earliest changes of airflow limitation occur in the small airways, and can be seen in the last portion of the flow-volume diagram (with a downward ‘concave’ appearance of the curve), even when the initial portion is still normal. Quantitatively, this can be described as reduced isovolumic instantaneous flows, such as forced expiratory flows at 50% or 75% of FVC (FEF50 or FEF75, respectively) or the flow between 25% and 75% of FVC (FEF25–75).20 Unfortunately, abnormalities in the middle/distal portion of the curve and impairments of these flows are non-specific, while the CIs of their predicted values are very wide, that is, incapable of satisfactorily differentiating between normal and abnormal.21 22 Furthermore, the ‘concavity’ of the flow-volume curve is not easily quantifiable.23 Further, FEF50 pred and FEF50 LLN have not been developed in neither the NHANES III nor in the GLI equation sets. The use of AEX is intended to address these limitations, being able to better separate qualitatively (the type) and quantitatively (the severity) of these ventilatory impairments.
Indeed, this analysis suggests that AEX can also quantitatively assess flow changes that impact terminal or distal segment of the flow-volume curve. The terminal segment of the flow-volume loop is considered effort-independent and due to a complex interplay between resistance to airflow in small airways or units with long emptying time and the respiratory system’s elastic recoil.21 As such, AEX could be used as a more sensitive spirometric parameter for SAD. The measurement can replace in the future the use of individual isovolumic instantaneous flows, not to be added to a portfolio of imprecise metrics.
To date, several studies have addressed the possible utility of AEX.24–30 Bunn et al explored an analogue version of AEX and compared it with predicted values based on peak expiratory flow and FVC,24 25 essentially AEX1.14 Most prior studies assessed the use of AEX in paediatric subjects (as younger individuals may encounter difficulty following spirometry instructions), in bronchodilator testing, or as a surrogate marker for FEV1.27–31 Vermaak et al26 examined the AEX in 60 adult South African subjects without a history of lung disease and derived AEX predictive equations that showed values very close (again) to AEX1; unfortunately, their study lacked a validation group. They wrote, ‘we speculate that when dealing with lungs of normal capacity, this new parameter might be sensitive enough to detect small airways involvement when the Raw is normal’.26 Four decades later, other authors found that digitally obtained AEX correlates well with hyperinflation in subjects with COPD,32 confirming the utility of AEX as a global functional respiratory parameter.
Extending the scope and the scale of the studies which examined AEX in narrow clinical settings or in small populations, in this investigation and in our prior communication,13 we have used digital AEX as a global spirometric measurement of ventilatory impairment in a large sample of adult subjects. Given the challenge of defining SAD, we posit that AEX is capable of detecting earlier airflow limitation, that is, involvement of small airways, and that AEX can be used as a surrogate measurement for the area ‘lost’ as an increased downward concavity of the curve in its terminal portion. In this study, we validated all ventilatory defects against the gold standard test, that is, determination of lung volumes by body plethysmography or helium dilution.
One possible limitation of the current investigation is related to the fact that our subjects’ demographics were different from the general US population. For example, in our dataset, 86% were White, 13% were African-American, while other ethnic or racial groups were poorly represented. Further, any specific working definition used for SAD will inevitably affect the performance of the new measurement, inducing ‘imprecision’. As shown in figure 2, there is great performance heterogeneity for various predictive equations with respect to FEF50 LLN. We found that even when the FEF50 LLN ‘outliers’ were excluded from the set of predictive equations (eg, Forche and Miller equations),5 33 34 the AEX stratification did not change substantially. Furthermore, comparing the diagnostic performance of AEX with other measurements to establish the presence of SAD (eg, impulse oscillometry or forced oscillation techniques) or correlations with patient-centred symptoms represent significant future study opportunities.35 For future, widespread use in clinical practice, we will need to assess the reproducibility and the intrinsic test-to-test variability of AEX as a spirometric measurement, as well as to derive predictive equations for normal values and natural variance at population levels, so that specific thresholds for categorising normal, functional impairment and more discrete degrees of dysfunction can be established.
Conclusions
The AEX is a useful tool for assessing respiratory dysfunction, including that of SAD. In this setting, the formulas used for FEF50 LLN can influence greatly the accuracy of the categorisation. This study also shows that, using the two most common predictive equations (NHANES III vs GLI), the diagnostic concordance for the type of defect and severity of obstruction is relatively high.
Acknowledgments
Kevin McCarthy RCPT (data extraction).
References
Footnotes
Contributors OCL: concept, data analysis and interpretation, article writing, submission. JKS: concept, interpretation, article writing.
Funding The authors have not declared a specific grant for this research from any funding agency in the public, commercial or not-for-profit sectors.
Competing interests None declared.
Patient consent for publication Not required.
Ethics approval The study received Institutional Review Board approvals (Cleveland Clinic IRB EX#0504 and EX#19–1129; Emory IRB #00049576).
Provenance and peer review Not commissioned; externally peer reviewed.
Data availability statement No data are available.