Article Text

Abstract
Background Although several studies have reported an association between atherosclerosis-related diseases and COVID-19, the relationship between COVID-19 severity and atherosclerosis progression remains unclear. The aim of this study is to determine the coronary artery calcium score (CACS) prognostic value in patients with COVID-19 using indices such as deterioration in oxygenation and CT images of the chest.
Methods This was a single-centre retrospective study of 53 consecutive patients with COVID-19 in Narita who were admitted to our hospital between March 2020 and August 2020. CACS was calculated based on non-gated CT scans of the chest performed on admission day. The patients were divided into the following two groups based on CACS: group 1 (CACS ≥180, n=11) and group 2 (CACS <180, n=42). Following univariate analysis of the main variables, multivariate analysis of variables that may be associated with COVID-19 progression was performed.
Results Multivariable logistic regression analysis of age, sex, smoking history, diabetes, hypertension, dyslipidaemia, number of days from symptom onset to hospitalisation and CACS of ≥180 was performed. It revealed that unlike CACS of <180, CACS of ≥180 is associated with exacerbation of oxygenation or CT images of the chest during hospitalisation (OR: 12.879, 95% CI: 1.399 to 380.401). Furthermore, this model of eight variables showed good calibration (Hosmer-Lemeshow p=0.119).
Conclusion CACS may be a prognosis marker of COVID-19 severity. Although coronary artery calcification is not typically assessed in pneumonia cases, it may provide a valuable clinical indicator for predicting severe COVID-19 outcomes.
- COVID-19
- viral infection
Data availability statement
Data are available upon reasonable request. All data relevant to the study are included in the article or uploaded as supplementary information. All data relevant to the study are included in the article or uploaded as supplementary information. Data are available upon reasonable request.
This is an open access article distributed in accordance with the Creative Commons Attribution Non Commercial (CC BY-NC 4.0) license, which permits others to distribute, remix, adapt, build upon this work non-commercially, and license their derivative works on different terms, provided the original work is properly cited, appropriate credit is given, any changes made indicated, and the use is non-commercial. See: http://creativecommons.org/licenses/by-nc/4.0/.
Statistics from Altmetric.com
Key messages
Can COVID-19 prognosis be predicted by quantifying atherosclerosis?
High coronary artery calcium score (CACS) is associated with COVID-19 severity, as measured by oxygenation and CT image of the chest deteriorations.
High CACS may be a prognostic predictor of COVID-19 severity.
Introduction
COVID-19, which is caused by SARS-CoV-2, has spread rapidly worldwide and has become a pandemic. According to the WHO, COVID-19 dashboard, as of 3 March 2021, there were 114 653 749 confirmed cases of COVID-19 and 2 550 500 deaths due to COVID-19.1 2 Previous reports suggest that approximately 20% of patients with COVID-19 rapidly progress to a critical clinical condition.3 4
Various diseases are known to be associated with COVID-19 severity, and they include atherosclerosis-related diseases such as hypertension, diabetes and coronary artery disease.5 It has been stated in several reports that atherosclerosis-related diseases account for a high proportion of severely ill patients with COVID-19.6–9 Of 138 patients with COVID-19 in an intensive care unit (ICU) in Wuhan, China, who participated in a single-centre cohort study, 72% had comorbidities, 58% had hypertension, 25% had cardiovascular disease (CVD) and 22% had diabetes.6 Of 1591 patients with COVID-19 who were admitted to an ICU in Italy, 49% had hypertension, 21% had CVD and 17% had diabetes.7 Of 393 consecutive ventilated patients with COVID-19 in New York, the USA, up to 54% had hypertension, 28% had diabetes and 19% had coronary artery disease.8 According to a study of 8438 patients with COVID-19 in New York City, the rates of mechanical ventilation and mortality were significantly higher than in patients with coronary artery disease, peripheral artery disease or heart failure than in patients without comorbidities.9 Many papers have reported an association between atherosclerosis-related diseases and COVID-19.6–9 However, only a few papers have demonstrated their association with COVID-19 by quantifying the amount of atherosclerosis. Coronary artery calcification (CAC) is a CT finding that indicates atherosclerosis and can be quantified using the coronary artery calcium score (CACS).10 CACS is a widely used quantification score for atherosclerosis in cardiovascular medicine. Higher CACSs are associated with a higher risk of future cardiovascular events, providing a useful tool for predicting cardiovascular events.11 12 Only a few studies have pointed out the association between CAC and prognosis in hospitalised patients with COVID-19.13 14
In this study, we aimed to determine the prognostic value of CACS in patients with COVID-19 using deteriorations of oxygenation and CT images of the chest during hospitalisation as indices.
Methods
Study design and subjects
This was a single-centre retrospective study of consecutive patients with COVID-19 confirmed using quantitative reverse-transcription PCR test and admitted to our hospital (International University of Health and Welfare Narita Hospital) between March 2020 and August 2020. Of 92 patients admitted to our hospital in this period, 53 were enrolled into this study after excluding 32 patients who were under 39 years of age, 5 patients who did not undertake regular CT scans on admission, 1 patient who had agitation and 1 patient with insufficient data (figure 1).

Study flow chart.
Clinical assessment
The electronic medical records of the hospital were used to extract data during hospitalisation such as laboratory test results, CT scans, vital signs, peripheral capillary oxygen saturation (SpO2), oxygen demand and patient characteristics including age (in years), sex, body mass index (BMI: in kg/m2), smoking history (current or former), CACS and comorbidities. The number of days from onset to admission to our hospital and the length of hospital stay were evaluated. Laboratory tests were performed on admission day, and regular inspections were conducted at least once a week during hospitalisation. CT scans were performed on all admitted patients with COVID-19. CT scans were performed on admission day, and regular inspections were conducted once a week or once every 2 weeks. In our hospital, deterioration of CT image of the chest was defined by postadmission CT scans showing progression of ground-glass opacity or infiltrative shadows. CT findings were evaluated for CACS and disease progression (eg, area of shadow and change of shadow type) by two skilled operators (one radiologist and one pulmonologist) blinded to the clinical history. Vital signs, SpO2 and dose of oxygen were recorded every day. Deterioration of oxygenation was defined as an SpO2 of ≤93% and increase in oxygen dose after admission. Disease severity was categorised according to the National Institutes of Health guidelines into asymptomatic or presymptomatic infection, mild illness, moderate illness, severe illness and critical illness. Asymptomatic or presymptomatic infection refers to infection characterised by positive virologic test for SARS-CoV-2 in patients who have no symptoms consistent with COVID-19. Mild illness refers to illness characterised by any of the various signs and symptoms of COVID-19 but not shortness of breath, dyspnoea or abnormal findings on CT images of the chest. Moderate illness refers to illness characterised by evidence of lower respiratory tract disease observed during clinical assessment or on CT image of the chest and an SpO2 of ≥94% on room air at sea level. Severe illness refers to illness characterised by an SpO2 of <94% on room air at sea level, the ratio of arterial partial pressure of oxygen to fraction of inspired oxygen of <300 mm Hg, a respiratory rate of >30 breaths per minute or lung infiltrates of >50%. Critical illness refers to illness characterised by respiratory failure, septic shock and/or multiple organ dysfunction.15 We scored each patient on the admission day and on the worst-condition day.
Computed tomography
Non-gated CT studies were performed using an 80-detector row CT scanner (Aquilion Prime, Cannon Medical Systems, Otawara, Japan). CT scan of the chest was routinely performed without contrast media for all patients at admission. The acquisition parameters were as follows: tube voltage of 120 kVp, automatic tube current modulation of 40–650 mA, collimation of 320 mm×0.5 mm, field of view of 230 mm and rotation time of 0.275 s. As for an image reconstruction algorithm, we used a deep-learning-based reconstruction technique (Advanced Intelligent Clear-IQ Engine).16 17
Coronary artery calcium score
All images were transferred to a dedicated computer workstation (ZAIO server, ZAIO software, Tokyo, Japan), and we calculated CACS as described by Agatston et al10 CAC was defined by an area with CT attenuation value above a threshold of 130 Hounsfield units in the four main coronary arteries (ie, left main, left anterior descending, left circumflex and right coronary arteries). A lesion score was determined based on the maximal CT number as follows: 1=130–199, 2=200–299, 3=300–399 and 4≥400 Hounsfield units. Scores were calculated for each region of interest by multiplying the density score and the area. The total CACS was determined by adding up each of these scores for all 20 slices.
Statistical analysis
For baseline variables, summary statistics were constructed using mean (SD), median (IQR), frequency distributions or proportions. A sensitivity analysis was performed based on the distribution of 53 patients’ CACS data, using area under the curve. Analyses were performed with cut-off values of 150, 180, 300 and 400, and as a result, 180 was set as the cut-off value. The patients were divided into the following two groups based on CACS: group 1 (CACS ≥180, n=11) and group 2 (CACS <180, n=42). For continuous variables such as age, BMI and CACS, we first compared the mean values (mean, SD, quartile) between the two groups. Then, normality test was performed using the Kolmogorov-Smirnov test (two sided) and Shapiro-Wilk test, and homoscedasticity was further tested using the F test. According to the distribution of data, the Welch t-test and Mann-Whitney test were performed.
Fisher’s exact test was used to determine the significance of differences in the proportions of groups. After the key characteristics of the variables were studied, a logistic regression model was fitted with age, sex, smoking status, diabetes, hypertension, dyslipidaemia, days from onset to hospitalisation and a CACS of ≥180. Statistical significance was defined by OR and 95% CIs. Analyses were conducted using SAS V.9.4 (SAS Institute).
Patient and public involvement
No patients were involved in setting the research questions, outcome measures or study design. No patients were asked to advice on interpretation or the presentation of results.
Results
Patient basic characteristics
The basic clinical characteristics of the 53 patients in the two groups (ie, group 1: CACS ≥180, n=11 and group 2: CACS <180, n=42) are shown in table 1. Age was significantly higher in group 1 than in group 2. The mean CACS was 701.9 (SD:±397.4) and 23.8 (SD:±41.5) in group 1 and group 2, respectively, (p<0.01). No significant differences in sex, BMI, smoking status, diabetes, hypertension, dyslipidaemia, heart disease, brain disease, lung disease or malignant tumour were observed between the two groups.
Characteristics
Association between CACS and coronary risk factors
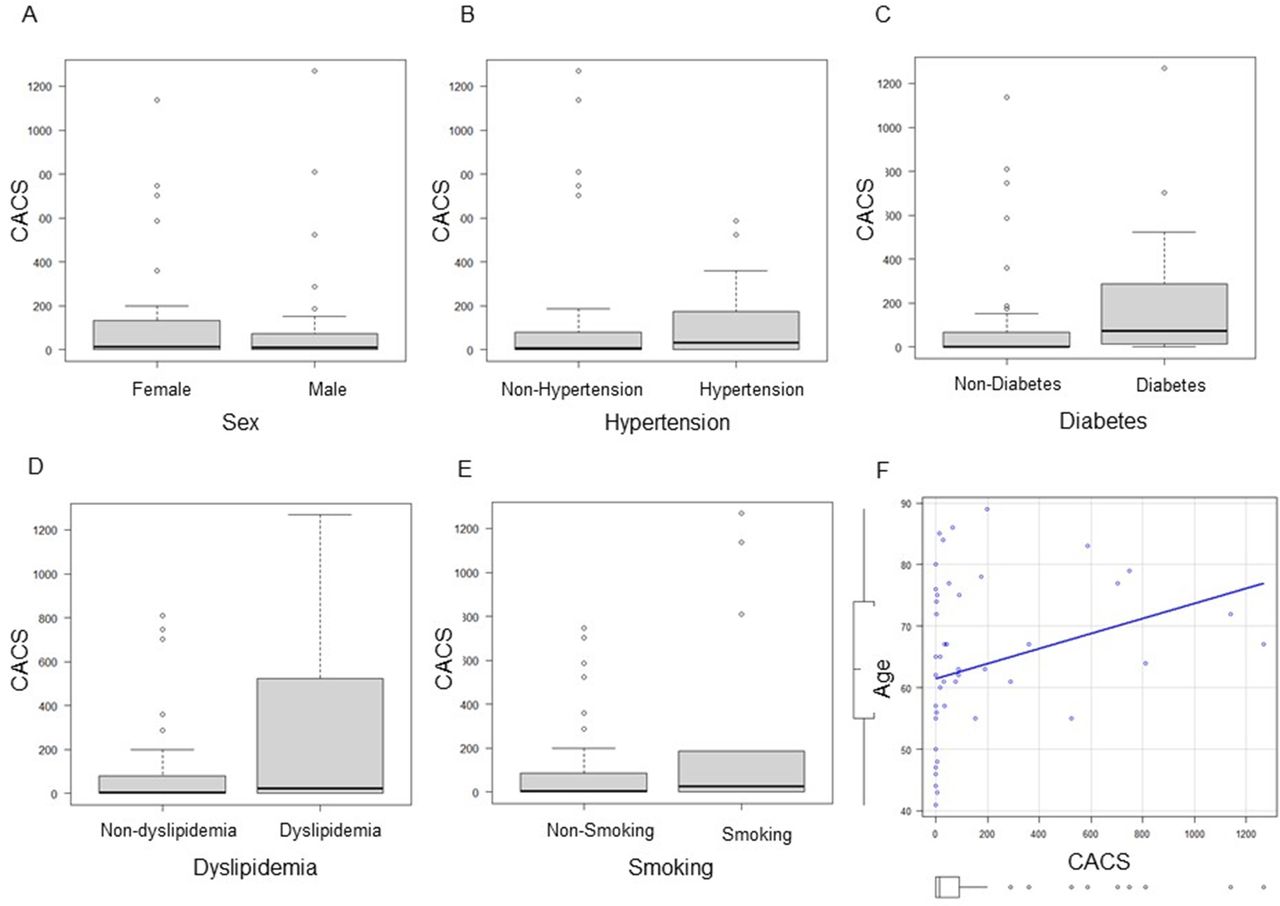
The relationships between CACS and clinical parameters in patients with coronary risk factors are shown in figure 2. The median (IQR) CACS was significantly higher in patients with diabetes than in those without diabetes (74.4 (14.73–287.6) vs 2.5 (0–58.23), p=0.03, figure 2C). A weak positive correlation was observed between CACS and age (ρ=0.282, p=0.039, figure 2F). There was no significant association between CACS and sex, hypertension, dyslipidaemia or smoking status.

Correlations between coronary artery calcium score (CACS) and sex (A), hypertension (B), diabetes (C), dyslipidaemia (D), smoking (E) and age (F). CACS was significantly higher in the diabetes group than in the non-diabetes group. There was a weak positive correlation between CACS and age. No significant differences were observed between hypertension and nonhypertension (32.58 (0–174.5) vs 8.265 (0–677.31), p=0.477), dyslipidaemia and non-dyslipidemia (24.81 (0.543–436.3) vs 3.88 (0–80.19), p=0.225), men and women (9.46 (0–72.06) vs 12.65 (0–132.11), p=0.848), smoking and non-smoking (27.52 (0.31–159.66) vs 4.19 (0–87.87), p=0.389). Mann-Whitney U test (A–E) and Pearson’s product-moment correlation coefficient (F) were used for the analyses. Horizontal lines represent medians, boxes represent the 25th and 75th percentiles, whiskers represent the 10th and 90th percentiles and dots represent outliers.
Patients’ clinical characteristics before and after hospitalisation
Patients’ clinical characteristics before and after hospitalisation are shown in table 2. Oxygenation or CT image of the chest deteriorations during hospitalisation were significantly worse in group 1 than in group 2 (p=0.03). Separate comparisons of deteriorations in oxygenation and CT images of the chest during hospitalisation showed a higher rate of deterioration in group 1 than in group 2, but there was no statistically significant difference between the two groups. Similarly, there was no statistically significant difference in disease severity at admission between the two groups. Further, the deterioration frequency during hospitalisation was higher in group 1 than in group 2, but there was no statistically significant difference between the two groups.
Clinical characteristics of patients before and after hospitalisation
CACS and deterioration of oxygenation or CT images of the chest during hospitalisation
Table 3 reports the ORs and 95% CIs from logistic regressions of the deterioration of oxygenation or CT images of the chest during hospitalisation, adjusting factors such as age, sex, smoking status, diabetes, hypertension, dyslipidaemia, days from onset to hospitalisation and a CACS of ≥180. A CACS of ≥180 was found to be associated with deterioration of oxygenation or CT images of the chest during hospitalisation (OR: 12.879, 95% CI: 1.399 to 380.401, Hosmer-Lemeshow p=0.119).
CACS and deterioration of oxygenation or CT images of the chest during hospitalisation
Discussion
The main finding of this study is that in hospitalised patients with COVID-19, high CACS may be more strongly associated with deterioration of oxygenation and CT images of the chest than other general risk factors of atherosclerosis such as age, sex, smoking, dyslipidaemia, diabetes and hypertension.
Multivariate analysis revealed that high CACS is associated with COVID-19 progression and may be a prognostic predictor of COVID-19 severity. In the current state of the pandemic, prediction of COVID-19 prognosis using preclinical data (eg, age, smoking history and underlying medical history) and clinical information at the time of admission (eg, laboratory test and CT scan) is important in clinical settings.5 In this regard, the results of this study support the potential usefulness of CACS as an additional prognostic predictor that uses information from a widely available non-invasive modality (ie, CT of the chest). Although a weak association between CACS and age was observed (see table 1 and figure 2), the combined results indicated that a higher CACS may be a more useful indicator of COVID-19 severity than age (table 3). Even if a patient has pneumonia at the time of admission, prediction of prognosis based only on the pneumonia image pattern on admission is challenging, and it is often difficult to determine the appropriate drug for treatment.
Two earlier studies published in 2020 reported an association between CAC and COVID-19. In a single-centre cohort study of 53 hospitalised patients with COVID-19 in Italy, half of the patients with a CACS of ≥400 died during hospitalisation, whereas 8.9% of patients with a CACS of <400 died during hospitalisation.14 Using Kaplan-Meier analysis, a cross-sectional study in France of 209 consecutive patients hospitalised with COVID-19 and aged 40–80 years showed that CAC is associated with the first occurrence of non-invasive or invasive mechanical ventilation, extracorporeal membrane oxygenation or death during hospitalisation (HR: 3.5; 95% CI: 2.2 to 5.8; p<0.0001).13 In this study, the rate of oxygenation or CT image of the chest deterioration after admission was significantly higher in group 1 than in group 2. In addition, although the difference between the two groups was not statistically significant, the rates of deterioration of oxygenation, CT images of the chest and disease severity were higher in group 1 than in group 2. This suggests that CACS is a prognostic predictor of COVID-19 progression.
Other atherosclerosis-related comorbidities and unhealthy habits such as cerebrovascular disease, diabetes, hypertension and smoking are also known to be associated with COVID-19 severity, and this association may involve vascular endothelial dysfunction.18 19 Endothelial dysfunction is mainly observed in patients with comorbidities that increase the risk of COVID-19 disease progression. These comorbidities include hypertension, obesity, diabetes, coronary artery disease and heart failure. SARS-CoV-2 is known to be transmitted via the ACE 2 receptor. The ACE2 receptor is expressed in several organs including the lungs, heart, kidneys and intestines. It is also found in endothelial cells.20 21 A previous study reported that SARS-CoV-2 may infect vascular endothelial cells, induce endothelial injury and inflammation, and ultimately result in multiorgan damage or thrombotic events.8 Recent findings suggest that atherosclerosis constitutes chronic inflammation that causes repair failure in vascular endothelium. CAC is a finding in patients with advanced atherosclerosis after repair failure in vascular endothelium.22 When SARS-CoV-2 infection occurs in such a vascular condition, the vascular injury cannot be completely repaired, and inflammation spreads. This may lead to severe COVID-19 outcomes. Table 3 shows that exacerbation is more likely to be severe in patients with a CACS of ≥180 than in patients with a CACS of <180, and the difference between the two patient groups is statistically significant. Although no statistically significant differences in age, smoking status, diabetes and hypertension were observed between the two groups, there is a higher tendency for disease progression in patients with a CACS of ≥180 than in patients with a CACS of <180.
Our study has several limitations. First, the study is of a subgroup of patients over the age of 40. The Suita score, which predicts coronary disease using risk factor categories, indicates that age is one of the strongest risk factors of coronary heart disease over any 10-year period. It also shows that the risk of coronary heart disease increases after the age of 35–44 years.23 The 2018 multisociety guidelines on cholesterol management also suggest that CACS testing may be considered in adults aged 40–75 years.24 Second, all the patients’ CT images of the chest were subjectively evaluated by clinicians. Further, changes in the pneumonia image during the clinical course were primarily and subjectively judged in clinical practice. Third, the CT scans were non-electrocardiography (ECG) gated. Moreover, CACS measured on non-ECG-gated CT scan is similar to CACS measured on ECG-gated CT scan.13 Fourth, in our study, the CACS cut-off of 180 was determined using area under the curve, which was not highly accurate (0.609, 95% CI: 0.461 to 0.756). However, a CACS of 180 is itself clinically significant. A high CACS is known to be associated with high coronary event rate and high relative risk ratio. Generally, a CACS of 1–112 is considered to be of average risk (risk ratio, 1.9), a CACS of 100–400 is considered to be of moderate risk (risk ratio, 4.3), a CACS of 400–999 is considered to be of high risk (risk ratio, 7.2) and a CACS of ≥1000 is considered to be of very high risk (risk ratio, 10.8).25 Our sensitivity analysis was performed based on the distribution of our CACS data, which resulted in selecting 180 as the cut-off value. In an atherosclerosis study, Budoff et al25 recommended setting the CACS cut-off value in the range of 100–400; thus, the value of 180 was deemed appropriate. However, the cut-off value determination could be considered a limitation of this retrospective study. Further studies are desirable to evaluate the validity of the cut-off value. Fifth, our results show that 36.4% of patients with an elevated CACS had a malignant tumour (table 1). In a previous report on the link between smoking-related cancers and CACS, the extent of coronary atherosclerosis determined by CACS was not generally associated with the development of cancer; however, an association between CACS and risk of lung cancer in women was detected.26 In our study, the number of patients with malignant tumours was small (n=5) and variable (prostate, colorectal, stomach and breast); thus, the potential association is unclear. Further research is needed to clarify the relationship between malignant tumours and CACS.
In conclusion, CACS may provide a useful non-invasive biomarker for predicting severe COVID-19 outcomes. CAC is not routinely evaluated in CT images of the chest, but in patients with COVID-19, it may be an important finding that can be used to predict prognosis.
Data availability statement
Data are available upon reasonable request. All data relevant to the study are included in the article or uploaded as supplementary information. All data relevant to the study are included in the article or uploaded as supplementary information. Data are available upon reasonable request.
Ethics statements
Ethics approval
All study procedures involving human participants were conducted in accordance with the standards of the Ethical Review Board of the International University of Health and Welfare (approval number 20-Nr-054) and conformed to the 1964 Declaration of Helsinki and its later amendments or comparable ethical standards. The requirement for informed consent was waived by the ethics committee because this retrospective analysis was limited to preexisting data collected as part of the standard of care by respiratory physicians; data anonymisation and privacy issues are protected.
Acknowledgments
The authors would like to thank all medical teams for COVID-19 in International University of Health and Welfare Narita hospital and thank Enago (www.enago.jp) for the English language review.
References
Footnotes
Contributors KT, YT, JT, RF and SK―study conception and design and drafting of the manuscript. KT, YT, JT, RF, YH, TK, YI, TK, HT, YT and SK―data collection, analysis, review and critical revision of the manuscript. KT, YT, JT and RF―statistical analysis, interpretation and administrative and technical support.
Funding This research was supported in part by the International University of Health and Welfare grant (IUHW research grant 2020).
Competing interests Dr. Kiryu has a grant from Canon medical systems. Other authors have no conflicts of interest to declare.
Patient and public involvement Patients and/or the public were not involved in the design, or conduct, or reporting, or dissemination plans of this research.
Provenance and peer review Not commissioned; externally peer reviewed.