Article Text

Abstract
Background In spirometry, the area under expiratory flow-volume curve (AEX-FV) was found to perform well in diagnosing and stratifying physiologic impairments, potentially lessening the need for complex lung volume testing. Expanding on prior work, this study assesses the accuracy and the utility of several models of estimating AEX-FV based on forced vital capacity (FVC) and several instantaneous flows. These models could be incorporated in regular spirometry reports, especially when actual AEX-FV measurements are not available.
Methods We analysed 4845 normal spirometry tests, performed on 3634 non-smoking subjects without known respiratory disease or complaints. Estimated AEX-FV was computed based on FVC and several flows: peak expiratory flow, isovolumic forced expiratory flow at 25%, 50% and 75% of FVC (FEF25, FEF50 and FEF75, respectively). The estimations were based on simple regression with and without interactions, by optimised regression models and by a deep learning algorithm that predicted the response surface of AEX-FV without interference from any predictor collinearities or normality assumption violations.
Results Median/IQR of actual square root of AEX-FV was 3.8/3.1–4.5 L2/s. The per cent of variance (R2) explained by the models selected was very high (>0.990), the effect of collinearities was negligible and the use of deep learning algorithms likely unnecessary for regular or routine pulmonary function testing laboratory usage.
Conclusions In the absence of actual AEX-FV, a simple regression model without interactions between predictors or use of optimisation techniques can provide a reasonable estimation for clinical practice, thus making AEX-FV an easily available additional tool for interpreting spirometry.
- lung physiology
- respiratory measurement
Data availability statement
No data are available. Data sharing: in place in-between investigators’ institutions
This is an open access article distributed in accordance with the Creative Commons Attribution Non Commercial (CC BY-NC 4.0) license, which permits others to distribute, remix, adapt, build upon this work non-commercially, and license their derivative works on different terms, provided the original work is properly cited, appropriate credit is given, any changes made indicated, and the use is non-commercial. See: http://creativecommons.org/licenses/by-nc/4.0/.
Statistics from Altmetric.com
Key messages
What is the key question?
Area under expiratory flow-volume loop (AEX or AEX-FV) is a spirometric measurement that could differentiate between functional impairments and patterns. How can we derive AEX-FV based on available volumes and flows and make it widely available for clinical practice?
Why read on?
Different AEX approximations can be derived using the trapezoid-and-triangle segmentation method, and based on forced vital capacity (FVC), peak expiratory flow (PEF) and several instantaneous isovolumic flows. One estimation is based on FVC, PEF, forced expiratory flow at 25% (FEF25), FEF50, FEF75 and forced expiratory volume at PEF (FEVPEF) (the latter not often reported or used in spirometry). We developed here several predictive models for AEX-FV based only on FVC, PEF, FEF25, FEF50 and FEF75.
What is the bottom line?
Whenever actual AEX-FV is not available, estimated AEX-FV could be computed easily and included in the standard spirometry reports, providing additional value for diagnosis and severity stratification of functional impairments. A simple linear regression model for estimating AEX-FV that does not include FEVPEF was found to be highly performing and adequate for clinical practice. Due to their higher precision, deep learning models could be used in more advanced epidemiological or research studies.
Introduction
Interpretation of spirometry relies on visual pattern recognition and on quantitative comparisons between measured flows and volumes versus predicted reference values derived in healthy subjects from similar populations.1–3 Previous studies described the diagnostic utility of a global spirometric parameter called area under expiratory flow-volume curve (AEX or AEX-FV)4–9 for characterising pulmonary function test (PFT) impairments, potentially lessening the need to perform lung volume testing by body plethysmography or other complex methods. The measurement was found to be particularly useful in separating traditional patterns of normal function, obstruction, restriction, mixed ventilatory defects and small airway disease, in further refining the response to bronchodilators, as well as in stratifying the severity of these impairments, including the possibility to use it as a surrogate marker and severity grading system for airway hyperinflation.4–9
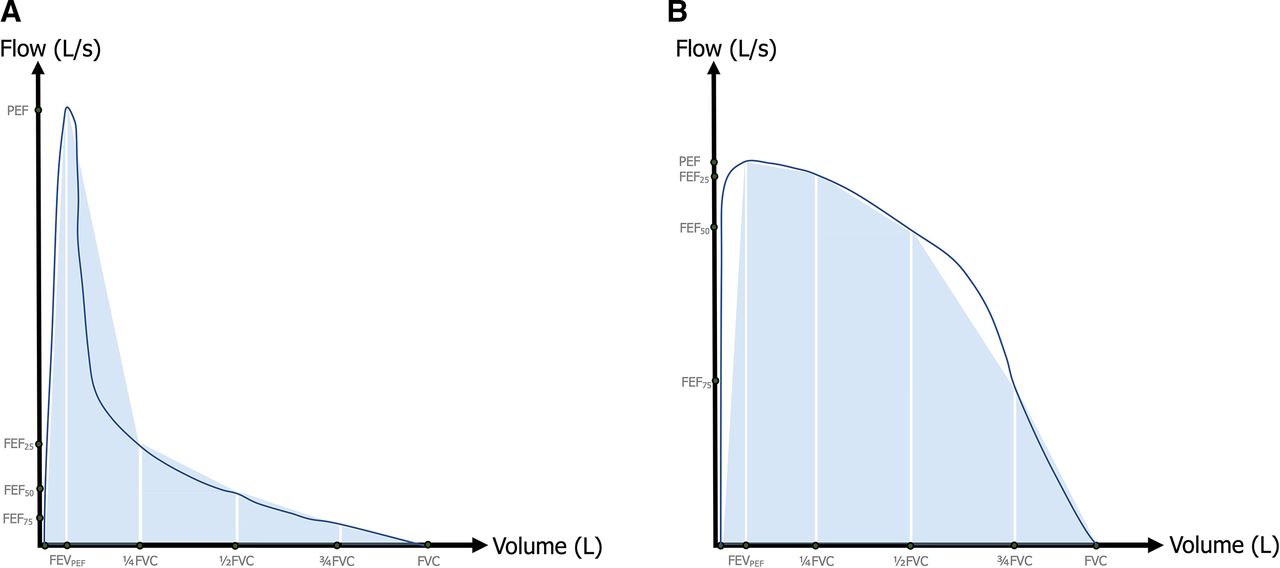
While AEX-FV represents the integral function of airflow by expired volume (an easily available measurement in digital spirometry), it is currently made available in the interpretative reports by only one PFT equipment vendor. To overcome this limitation, in previous work we approximated the AEX-FV from forced vital capacity (FVC), peak expiratory flow (PEF), forced expiratory volume at PEF (FEVPEF) and several instantaneous isovolumic flows, that is, forced expiratory flows at 25%, 50% and 75% of FVC (FEF25, FEF50 and FEF75, respectively).10 However, the triangle-and-trapezoid segmentation method for approximating AEX-FV could lead to either overestimation (one example in figure 1A) or underestimation (eg, figure 1B) of the actual measurement, which may affect its diagnostic and prognostic value. Further, the FEVPEF is rarely included in the standard spirometry reports, hence not easily available in simple equations such as the ones used for AEX1-4 (the AEX-FV approximations based on 1–4 flows, that is, PEF, FEF25, FEF50 and FEF75).11

Two examples of how AEX-FV4 reconstruction or approximation by the triangle-and-trapezoid method using PEF, FEF25, FEF50 and FEF75 could overestimate (A) or underestimate (B) the actual AEX-FV. AEX-FV, area under expiratory flow-volume curve; FVC, forced vital capacity; FEF25, FEF50 and FEF75, forced expiratory flows at 25%, 50% and 75%; PEF, peak expiratory flow.
In the current study, we aim to compute the AEX-FV by using various predictive models that consider only widely available parameters such as FVC, PEF, FEF25, FEF50 and FEF75, effectively searching for an optimised combination of coefficients for the predictive variables, so that AEX can become a standard reported parameter in spirometry.
Methods
Analyses were performed on a dataset of 4980 normal spirometry tests including AEX-FV values, done in the Cleveland Clinic PFT Laboratories between 2 April 2019 and 17 August 2020. The spirometry tests were performed on 3634 distinct, consecutive adult non-smoking subjects without any known lung disease or reported respiratory symptoms. In 135 of these ‘normal’ tests, the best FVC, FEV in 1 s (FEV1), FEV1/FVC or ‘distal’ flow FEF75 were below the lower limits of normal, as defined by Global Lung Initiative (GLI) equations,2 12 so they were excluded from further analyses even if they represented normal, isolated or ‘non-specific’ reductions in one of these functional parameters13; this exclusion led to a total number of normal spirometry tests analysed of 4845.
Spirometry was performed and interpreted according to the current American Thoracic Society/European Respiratory Society standards and recommendations.1 14–16 The tests were performed using Jaeger Master Lab Pro systems (Wurzberg, Germany). The most recent, comprehensive and applicable reference values, as published by the GLI were used for spirometry interpretation.2 12
Statistical analyses were done in JMP Pro V.15 (SAS Institute). Descriptive statistical analysis of available variables was performed. Categorical variables were presented as frequencies or group percentages. Continuous variables were characterised as mean±SD (for normally distributed variables) or as median and 25–75th IQR (for non-normal distributions, as determined by the Shapiro-Wilk or Anderson-Darling test). Student’s t test and analysis of variance were used to compare mean values, while categorical variables were compared using variations of the χ2 test. The Tukey-Kramer honest significant differences method was used to compare means among pairs when the variances were similar, while the Wilcoxon or Kruskal-Wallis rank sum tests were performed as non-parametric methods when variances were unequal, as appropriate.
In a prior publication,10 we defined AEX-FV4 (also called AEX4) by the triangle-and-trapezoid method of segmentation of AEX-FV, and we used for computations the following formula:
AEX-FV4 = 0.5·FEVPEF·PEF + 0.5·(PEF + FEF25)·(¼·FVC - FEVPEF) + 0.5·(FEF25 + FEF50)·¼·FVC + 0.5·(FEF50 + FEF75)·¼·FVC + 0.5·FEF75·¼·FVC
In the current investigation, instead of using the above coefficients (1 or 0.5), we aimed: (1) to identify a combination of coefficients which ‘smooth’ (reduce or augment) the contributions of various flows, and (2) not to rely on FEVPEF, a spirometric variable not often used or included in the standard PFT reports.
The simple linear and generalised (optimised) regression models used the following pool of variables: FEV, PEF, forced expiratory time (FET), FEF25, FEF50 and FEF75 to predict square root of AEX-FV (Sqrt AEX-FV, a transformation that lead to a near-normal distribution, figure 2).17 18 Generalised regression was performed using optimisation techniques such as ridge regression, lasso, elastic net and double lasso, with and without adaptive features. The variables that contributed by <10% to a model (eg, FET) were pruned out from the models; for this, we used k nearest neighbours’ method of dependent variables resampling in JMP. Similarly, interactions that contributed by <5% of the model’s variance were not included in the linear regression models, even if statistically significant (ie, a false discovery rate or FDR <0.001). A random 70/30 partition was generated for cross-validation of all the models. Statistical significance was defined as p<0.001.
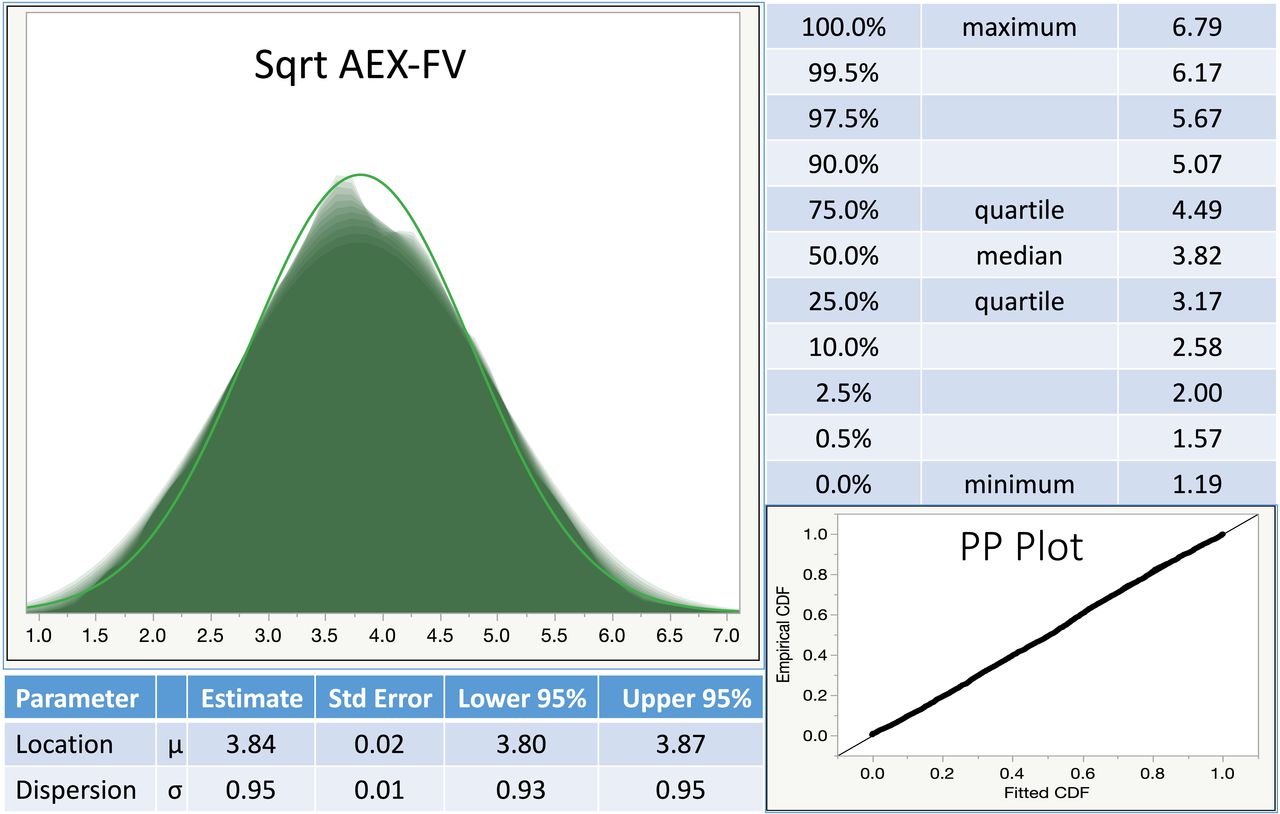
Distribution of the variable square root of AEX-FV (Sqrt AEX-FV) illustrated as a shadowgram and main quantiles; estimates of the distribution and dispersion, and the PP plot for a normal distribution fit. Which shows the relationship between the empirical cumulative distribution function (CDF) and the fitted CDF obtained using the estimated parameters. AEX-FV, area under expiratory flow-volume curve; PP plot, percentile-percentile plot.
Patients or the public were not involved in the design, conduct, reporting or dissemination plans of our research.
Patient and public involvement statement: patients and public were not involved in the design, conduct or analyses of the study results.
Results
From the total of 4845 normal, best-value spirometry sets performed on 3634 distinct participants (83% men), 2475 (51%) were coded as ‘single’ tests, 1250 (26%) as pre-bronchodilator and 1120 (23%) as postbronchodilator tests. In order to avoid weighing due to multiple tests performed in the same subjects, and to assess the potential impact of bronchodilator administration, we used for models’ development and validation one random spirometry set from each of the 3634 tested subjects. Approximately 71% of the tested individuals were self-identified as white, 17% as black, 0.6% North-East Asians, 0.4% South-East Asians and 11% as other or multiracial. The median age (IQR) was 60 (47–70) years. Median (IQR) height, weight and body mass index were 1.74 (1.68–1.80) m, 88 (77–102) kg and 29 (26–34) m/kg2, respectively. All tests had available, actual AEX-FV measurements, as provided by the spirometry testing equipment vendor. Mean (µ) Sqrt AEX-FV was 3.81 (95% CI or CI 3.78 to 3.84), and the standard deviation (σ) was 0.97 (95% CI 0.95 to 0.97) L2/s. Median/IQR of actual Sqrt AEX-FV was 3.79/3.12–4.49 L2/s. Mean (µ, 95% CI)/SD (σ, 95% CI) of Sqrt AEX-FV was 3.89 (3.85–3.92)/0.90 (0.88–0.90) in ‘single’ tests, 3.64 (3.57–3.72)/1.01 (0.96–1.02) and 3.84 (3.74–3.93)/1.06 (1.00–1.07) L2/s, in prebronchodilator and postbronchodilator tests, respectively. By gender, mean (µ, 95% CI)/SD (σ, 95% CI) Sqrt AEX-FV was 2.76 (2.72–2.80)/0.65 (0.61–0.65) in women and 4.09 (4.06–4.11)/0.85 (0.83–0.85) L2/s in men.
Table 1 and online supplemental figure S1 show the linear regression model that predicts Sqrt AEX-FV using FVC, PEF, FEF25, FEF50 and FEF75 and assuming no interactions between the X factors. All five variables performed well in univariate and multivariate models with significance levels<0.0001, and contributed between 16% and 24% in predicting the Y variable Sqrt AEX. While the variance inflation factor was generally lower than 10, one of the assumptions of the regression model was violated, that is, that of normal distribution of the predictors, and their distribution did not ‘normalise’ with any of the usual transformations. In both testing and validation sets, the percentage of variance explained by the model (R2) was very high, 0.993. While some of the interactions between these factors were statistically significant (table 2), their main effects were very small and the overall R2 remained <0.995, pointing towards the fact that more complex models that include interactions are not necessary (despite collinearities), as the model’s performance remains high (similar dispersion as expressed by the root average square error between 0.074 and 0.075).
Supplemental material
Simple linear regression model without interactions for predicting square root AEX-FV
Linear regression model with interactions for predicting square root AEX-FV
Further attempts to improve the models’ performance by using various response variable distributions (eg, gamma or lognormal transformations) and using optimisation (generalised regression) techniques such as ridge regression, elastic net, lasso and double lasso, with or without adaptive features, did not lead to major improvements in generalised R2 of the validation set (table 3).
Model Comparisons between linear regression (standard least squares) and various techniques of optimisation (generalised regression) for predicting square root AEX-FV
To counteract the issue of non-normal distributions and collinearities between variables (assumed by default in regression to be completely independent), we also developed a neural network model using the same variables (figure 3A–C). We ran several neural network architectures, and the optimised, fastest models were based on a deep learning architecture with one output (Sqrt AEX-FV, maintained as transformed for purpose of comparability with the other models), same five inputs (PEF, FVC, FEF25, FEF50 and FEF75) and two hidden layers, each with three sigmoid [(e2x-1)/(e2x+1)], 3 gaussian (1/ex·x) and three linear activation function nodes. We used transformed covariates (with either Johnson Su or Johnson Sb distributions), a robust fit method that uses absolute deviations instead of least squares (in order to minimise the effects of outliers), 10 additional tours for the fitting process, and a squared penalty function to avoid overfitting (the latter being preferred when all X variables are expected to contribute to the predictive ability of the model). Generalised R2 in this instance simplifies the traditional R2 for continuous normal responses in the standard least squares setting, and is also known as the Nagelkerke or Craig-Uhler R2, which is a normalised version of Cox and Snell’s pseudo R2.19 The root mean square error (RMSE) is equivalent to the SD, while Mean Absolute Deviance is represented by the average of the absolute differences between the predicted response and the actual Y variable (figure 3A). The SSE (figure 3A) represents the sum of squares error, while the main effects of the variables is based on the k nearest neighbours’ method of resampling dependent variables. Overall, the R2 was very high (0.995 in both the training and the validation set), while the RMSE was even further reduced to 0.070 (figure 3A). The prediction profiler in figure 3B shows the non-linear relationship between Sqrt AEX-FV and the X variables, while the contour profilers show the response surfaces for various combination of variables versus Sqrt AEX-FV (figure 3B). Another illustration of the neural network model’s performance is shown in figure 3C, which showcases the high correlations between Sqrt AEX-FV observed and predicted values, and the residual values plotted against the predicted Sqrt AEX-FV in the training and validation sets, respectively. The figure 3C also shows that the residuals do not increase at higher response variable values (visual inspection confirming that the homoscedasticity condition is met).

(A) Neural network architecture, model performance and variable importance. The average of the absolute values of the differences between the response and the predicted response. (B) Prediction and contour profilers for the neural network model. (C) Actual and residual Sqrt AEX values versus predicted Sqrt AEX. AEX-FV, area under expiratory flow-volume curve; FVC, forced vital capacity; FEF25, FEF50 and FEF75, forced expiratory flows at 25%, 50% and 75%; mean abs dev, mean absolute deviance; PEF, peak expiratory flow; RMSE, root mean square error; SSE, sum of squares error.
The models performed well in both prebronchodilator and postbronchodilator studies, their residuals being very low (~0.001 in regression and ~−0.007 in neural networks) and similar in the two groups. Further, for all predictive models tried, the performance was almost identical in prebronchodilator versus postbronchodilator spirometry tests (data not shown). When we assessed the coefficients of variation for AEX-FV, we found it to be very low: 5 (2–6)% in prebronchodilator tests and 6 (4-12)% in postbronchodilator spirometries, making the promise of a reliable, reproducible functional parameter, that is, with low intraindividual variability.
Discussion
The AEX-FV has emerged as a useful spirometric tool, able to separate traditional patterns of normal function, obstruction, restriction, mixed ventilatory defects and small airway disease, to characterise the response to bronchodilators, to stratify the severity of these impairments, and to assess airway hyperinflation, without employing more advanced, expensive and laborious lung volume testing.4–9
In a previous study, we have shown that computing AEX-FV4 (or AEX4) using the trapezoid-and-triangle method of approximation, and based on PEF, FVC, FEF25, FEF50, FEF75 and FEVPEF represents a reasonable approximation of the AEX-FV.10 The main finding of this article is that a simple linear regression model using only PEF, FVC, FEF25, FEF50 and FEF75 as predictors for Sqrt AEX-FV (table 1) is likely sufficient to estimate the AEX-FV when the actual measurement is not available. As such, the dependence on spirometric variables that are either not reported (FEVPEF) or not made available by the digital spirometry platform (AEX-FV or FEVPEF) is easily avoided. Furthermore, especially when advanced computational capabilities are not available, more complex regression or neural network models are likely non-essential for the purpose of this endeavour.
Our previous work showed that AEX compared favourably with several traditional spirometric measurements and parameters in diagnosing physiologic derangement and in estimating the severity of respiratory impairments. The actual AEX was able to predict with reasonable accuracy inspiratory capacity, inspiratory capacity/total lung capacity and residual volume/total lung capacity ratios, thus potentially obviating the need for complex lung volume testing.4 5 The current investigation extends the value of the AEX-FV concept by showing that it can be easily estimated using widely available spirometric volumes and instantaneous flows. This becomes important especially when existing PFT software does not compute or report the actual AEX values. Further, we recently developed methodologies for predicting AEX-FV values, which allows the clinician to derive the percent predicted values and to further characterise physiological impairment.20
The current work also extends prior evaluations of AEX, which have tested the use of this spirometric functional measurement either in paediatric populations, or for assessing bronchoconstriction or bronchodilation responses.21–24 In a more recent article, the authors constructed predicted AEX4 (called ‘reference flow-volume loop’) and compared it against actual AEX, thus assessing the degree of airway hyperinflation in adult chronic obstructive pulmonary disease patients.25
For any new functional measurement to be used in clinical practice, it is important to establish not only its performance, but also its test-to-test, inherent variability. As such, in a separate sub-analysis of valid and acceptable spirometry tests represented by 93 prebronchodilator and 122 post-bronchodilator trials, with a median of 3 and 5 trials per subject, respectively, we evaluated the inter-test variability of the AEX-FV. The average (range) for the coefficient of variation, defined as SD·100/mean of AEX-FV was overall low, that is, 6 (1%–11%) in pre-bronchodilator tests and 7 (1%–20%) in postbronchodilator assessments, respectively. Their ranges, defined as mean differences between the best (largest) and the worst (smallest) AEX-FV values, were 3.5 (95% CI 3.2 to 3.7) and 2.9 (95% CI 2.8 to 3.2) L2/s in prebronchodilator and postbronchodilator repeat trials, respectively. The predicted AEX-FV by various models were highly correlated with the actual AEX-FV variable, thus the variability of the predicted AEX-FV was, unsurprisingly, very similar. Given that the relative differences (range·100/mean) could be considerable (22% and 21% in prebronchodilator and postbronchodilator tests, respectively), perhaps an expression of the inherent variability of the lung volumes and instantaneous flows that determine AEX-FV, it is likely best to consider for reporting and analysis purposes the best (largest) obtained values, similar to the rules applied to FEV1, FVC and their ratio.
One of the strengths of our investigation is represented by the large dataset of normal PFTs extracted from a laboratory-based population of non-smokers without any known respiratory symptoms or pathologies, and for which actual AEX-FV were made available by the digital spirometry platform. In order to assess more advanced modelling capabilities, we employed both regular and optimised regression models and several simplified models of machine or deep learning. One weakness of this investigation is the single-centre collection of PFTs; as such, these findings will need to be validated externally in other populations. Additionally, some PFT laboratory-based ‘normal’ populations may include various uncaptured, relevant pathologies or could hide early functional impairments, while still above the lower limit of normal cut-offs. This may affect the population-level estimations or normality. Further, some demographic groups are under-represented in our cohort; as such, our models require further evaluation using broader populations and the models may require further refinement by including gender, race or ethnicity predictor factors.
Conclusion
This study analyses the performance of several models of estimating the AEX-FV, based on FVC, PEF and several isovolumic flows, that is, FEF25, FEF50 and FEF75. We found that AEX-FV estimated by a simple regression model without interactions performs with acceptable accuracy as a surrogate marker of actual AEX, which makes it potentially useful in diagnosing physiologic derangement of pulmonary function and in stratifying the severity of such impairment in clinical practice. In more advanced epidemiological or research settings, the use of a neural networks or deep learning models may be preferred due to their higher precision.
Data availability statement
No data are available. Data sharing: in place in-between investigators’ institutions
Ethics statements
Ethics approval
Institutional research ethical oversight approval was obtained to conduct the study (Cleveland Clinic IRB EX#0504 and Emory IRB# 00049576/Atlanta Veteran Affairs Medical Center R&D Ioachimescu-002).
References
Supplementary materials
Supplementary Data
This web only file has been produced by the BMJ Publishing Group from an electronic file supplied by the author(s) and has not been edited for content.
Footnotes
Collaborators None.
Contributors OCI, JAR, MH and JKS contributed to the writing of this article; JAR and MH contributed with data extraction; OCI contributed with statistical analyses.
Funding The authors have not declared a specific grant for this research from any funding agency in the public, commercial or not-for-profit sectors.
Competing interests None declared.
Provenance and peer review Not commissioned; externally peer reviewed.
Supplemental material This content has been supplied by the author(s). It has not been vetted by BMJ Publishing Group Limited (BMJ) and may not have been peer-reviewed. Any opinions or recommendations discussed are solely those of the author(s) and are not endorsed by BMJ. BMJ disclaims all liability and responsibility arising from any reliance placed on the content. Where the content includes any translated material, BMJ does not warrant the accuracy and reliability of the translations (including but not limited to local regulations, clinical guidelines, terminology, drug names and drug dosages), and is not responsible for any error and/or omissions arising from translation and adaptation or otherwise.