Article Text

Abstract
Background Markers of idiopathic pulmonary fibrosis (IPF) severity are based on measurements of forced vital capacity (FVC), diffusing capacity (DLCO) and CT. The pulmonary vessel volume (PVV) is a novel quantitative and independent prognostic structural indicator derived from automated CT analysis. The current prospective cross-sectional study investigated whether respiratory oscillometry provides complementary data to pulmonary function tests (PFTs) and is correlated with PVV.
Methods From September 2019 to March 2020, we enrolled 89 patients with IPF diagnosed according to international guidelines. We performed standard spectral (5–37 Hz) and novel intrabreath tracking (10 Hz) oscillometry followed by PFTs. Patients were characterised with the gender-age-physiology (GAP) score. CT images within 6 months of oscillometry were analysed in a subgroup (26 patients) using automated lung texture analysis. Correlations between PFTs, oscillometry and imaging variables were investigated using different regression models.
Findings The cohort (29F/60M; age=71.7±7.8 years) had mild IPF (%FVC=70±17, %DLCO=62±17). Spectral oscillometry revealed normal respiratory resistance, low reactance, especially during inspiration at 5 Hz (X5in), elevated reactance area and resonance frequency. Intrabreath oscillometry identified markedly low reactance at end-inspiration (XeI). XeI and X5in strongly correlated with FVC (r2=0.499 and 0.435) while XeI was highly (p=0.004) and uniquely correlated with the GAP score. XeI and PVV exhibited the strongest structural-functional relationship (r2=0.690), which remained significant after adjusting for %FVC, %DLCO and GAP score.
Interpretation XeI is an independent marker of IPF severity that offers additional information to standard PFTs. The data provide a cogent rationale for adding oscillometry in IPF assessment.
- Imaging/CT MRI etc
- Lung Physiology
- Interstitial Fibrosis
Data availability statement
Data are available on reasonable request. Following publication of the manuscript, deidentified data will be made available on request following review, approval and completion of data sharing agreements between University Health Network and the requesting institution(s).
This is an open access article distributed in accordance with the Creative Commons Attribution Non Commercial (CC BY-NC 4.0) license, which permits others to distribute, remix, adapt, build upon this work non-commercially, and license their derivative works on different terms, provided the original work is properly cited, appropriate credit is given, any changes made indicated, and the use is non-commercial. See: http://creativecommons.org/licenses/by-nc/4.0/.
Statistics from Altmetric.com
Key messages
What is already known on this topic
The pulmonary function test parameters of forced vital capacity and diffusing capacity are currently used as metrics of disease severity in idiopathic pulmonary fibrosis (IPF) and are key factors in the gender-age-physiology IPF score.
What this study adds
Our study revealed that respiratory oscillometry, in particular the intrabreath reactance assessment at end-inspiration (XeI) was uniquely correlated with the gender-age-physiology score and strongly associated with pulmonary vessel volume, a new quantitative metric derived from automated CT image analysis.
How this study might affect research, practice and/or policy
Our data suggest that the novel intrabreath oscillometry provides additional information to standard pulmonary function tests and may be a simple surrogate metric of CT derived structural indices in IPF.
Introduction
Idiopathic pulmonary fibrosis (IPF) is a progressive interstitial lung disease (ILD) of unknown aetiology. Affecting older adults, it has an exceedingly poor prognosis with a 5-year survival of 45%1–3 and confounded by the fact that it is often recognised late due to the non-specific nature of the clinical presentation. The joint European Respiratory Society (ERS)/American Thoracic Society (ATS)/Japanese Respiratory Society (JRS)/Latin American Thoracic Association (ALAT) guidelines recommend that IPF be diagnosed by consensus following a multidisciplinary review of the clinical presentation, pulmonary function tests (PFTs), high resolution CT and serology with/without surgical biopsy.2 4
Markers of IPF severity are based on a combination of demographics, imaging and physiological measurements that include forced vital capacity (FVC), diffusing capacity (DLCO) and hypoxemia during the 6 min walk (6MW) test. The GAP (gender, age, physiology) score is preferentially weighted by FVC and DLCO.5 CT imaging analyses are increasingly focused on developing quantitative metrics of disease severity and fibrosis. A computer-aided lung informatics for pathology evaluation and rating (CALIPER) tool has identified pulmonary vessel volume (PVV) to be the most predictive of IPF progression and mortality that is independent of PFT parameters.6–9
Oscillometry is a PFT that is highly sensitive to the lung periphery, a region not well assessed by conventional PFTs. It measures respiratory impedance (Zrs), expressed by resistance (Rrs) and reactance (Xrs) grossly reflecting the dynamic resistive and elastic properties, respectively, of the respiratory system.10 11 The difference between the mean inspiratory (X5in) and expiratory (X5ex) reactance at 5 Hz, was reported to distinguish ILD from asthma and chronic obstructive lung disease12 and combined pulmonary fibrosis-emphysema (CPFE) from ILD-only.13 14 Two recent studies found that whole-breath reactance at 5 Hz (X5) and X5in correlated with spirometry and the GAP score,14 and that the reactance values are correlated with CT metrics of structural abnormalities.15 While these data suggest that oscillometry could be useful to assess disease severity, it is not known whether oscillometry, a more easily applied diagnostic tool, can be used in place of or whether it provides additional information beyond spirometry.
The goals of the current study are to characterise IPF with the usual (spectral) and intrabreath oscillometry16 17 and to determine if oscillometry can provide additional information beyond conventional PFT and CT imaging.
Methods
Only patients (n=89) who met the ATS/ERS/JRS/ALAT criteria for IPF2 were eligible and prospectively recruited from the ILD Clinic at UHN, a tertiary referral centre. Written informed consent was obtained from participants prior to oscillometry; conventional PFTs were conducted as part of usual clinical care. We excluded patients with CPFE or who were already enrolled in a clinical trial due to existing protocol guidelines. The diagnosis of CPFE was made in a patient with a compatible history of smoking, evidence of emphysema on CT imaging, spirometry and clinical review by a multidisciplinary team. Healthy subjects were recruited from the UHN PFT Laboratory Biological control procedures and an unrelated study with oscillometry to screen for lung disease.
Oscillometry was conducted according to ERS guidelines11 following published quality control standards,18 using the tremoflo (model C-100, Thorasys, Montreal, Canada) device. Following spectral oscillometry with standard 5–37 Hz multifrequency measurements, monofrequency (10 Hz) recordings of 30 s were conducted for intrabreath analysis of Zrs at a 0.1 s temporal resolution as previously described,17 by using the research modality of the tremoflo device. Spirometry, body plethysmography and DLCO were performed after oscillometry, following international guidelines.19–21 All testing was conducted at the Toronto General Pulmonary Function Laboratory.
Anthropometric and clinical data were extracted from patients’ electronic medical records. Available high resolution CT scans of the chest done within 6 months of paired oscillometry—conventional PFTs were analysed by a fellowship trained thoracic radiologist using Lung Texture Analysis (Imbio, Minneapolis, Minnesota, USA) which is based on the CALIPER technology. In brief, lung texture analysis is a machine learning programme that automatically segments the lung from the chest and removes the central airways and central vasculature. It is trained to classify each voxel of lung as normal, hyperlucent, ground glass, reticular or honeycombing texture using a large previously described dataset.22 The parameters such as the ILD extent, which is the sum of volumes of ground glass, reticular and honeycombing volumes and the PVV, volume of vessel related structures, are expressed a per cent of the total lung capacity as defined by CT (TLCCT).6
Statistical analyses were performed using RStudio (The R Foundation, Boston, Massachusetts, USA). The absolute and % predicted values are presented as mean±SD or median and IQR, as appropriate. Correlations between PFTs, oscillometry and imaging variables were investigated using linear, polynomial with 2 degrees and exponential regression. The coefficient of determination R2 was used to compare goodness-of-fit in different models. Multivariate linear regression models with natural logarithm of PVV or ILD extent as outcomes were used to assess the correlation with XeI.
The study was conducted without patient and public involvement beyond peer-reviewed of the funding proposal.
Results
Demographics and conventional PFT
From 6 September 2019 to 12 March 2020, 120 patients with IPF were identified from the UHN ILD clinic. Seven patients were excluded as they were in a clinical drug trial and nine declined enrolment. Of the 104 consented patients, 10 were subsequently excluded when clinical review identified mixed lung diseases that did not meet inclusion criteria, for example, CPFE. Three patients did not complete oscillometry testing for various reasons (did not feel well; late for appointments). Two additional patients were excluded when post-test review of the PFT and/or oscillometry data failed to meet quality control.18
The remaining 89 participants were predominantly older males (67%) and overweight (mean body mass index=27.2±4.2; table 1). The group was similar to previously reported study cohorts of IPF.5 14 23 All patients performed paired oscillometry and spirometry during the same visit to the PFT laboratory. Fifteen patients of the 89 were unable to complete lung volume and DLCO measurements due to dyspnoea and/or fatigue. Similarly, four patients could not complete the 6MW test. The study group had mild to moderate impairment in conventional pulmonary function measures (mean % predicted FVC=69.6±17.0; % predicted DLCO=62.3±16.6). Six of the 85 patients who completed the 6MW test did so while on supplemental O2; the mean distance was normal with minimum O2 saturations being 87.7%±7.1%. There was no difference in anthropometric or PFT parameters between the overall cohort and the subgroup of 26 patients in whom CT scans were available (table 1). Thirty-eight per cent of the cohort were non-smokers and the others were equally distributed as ex-smokers of greater and less than 20 pack years (table 1). One-way analysis of variance revealed no statistical differences among the three groups with respect to the standard PFTs nor oscillometry with the exception of higher absolute FVC in the >20 pack-year group (online supplemental table). This was likely due to differences in height as %predicted FVC was similar among all groups. Of the oscillometry metrics, only the reactance values were different, but paradoxically, the worse values (more negative X5 and XeE, and higher AX) were observed in the non-smokers (online supplemental table S2).
Supplemental material
Summary of patient demographics, PFTs and 6MW parameters
Oscillometry of the IPF cohort
The spectral oscillometry graphs from an patient with IPF (figure 1A) and a healthy subject (figure 1D) showed alterations in oscillation mechanics in IPF with marked changes in the reactance versus frequency plots, with a rightward shift of Xrs resulting in elevated resonance frequency (Fres) and reactance area (AX). The intrabreath impedance-volume (figure 1B,E) and impedance-flow loops (figure 1C,F) from the same two subjects reflect an overall decrease in Xrs with an enhanced difference between end-expiratory (XeE) and end-inspiratory (XeI) values in IPF. This is manifested in a larger area of the Xrs vs flow loop and a distinct clockwise rotation.

Examples in a patient with IPF (A–C) and a healthy subject (D–F) of multifrequency (spectral) oscillometry (A,D) and intrabreath oscillometry at 10 Hz (B,C,E,F). Respiratory resistance (Rrs) and reactance (Xrs) values are indicated by closed and open circles, respectively. Fres denotes resonance frequency and AX denotes reactance area between 5 Hz and Fres. XeE and XeI, respectively, mark the end-expiratory and end-inspiratory reactance values; The solid arrows mark the beginning of inspiration and dotted arrows indicate beginning of expiration. IPF, idiopathic pulmonary fibrosis.
Comparison of the oscillometry for the whole cohort and the subgroup with chest CT measurements found the two groups to be similar (table 2). While Rrs at the lowest frequency (R5) is only slightly higher than its predicted value in the IPF group, this difference disappears by 19 Hz; this results in a considerably higher frequency dependence (R5–19) than that predicted and observed in the group of healthy controls (online supplemental table S1). X5 and its inspiratory and expiratory mean values (X5in and X5ex, respectively) were much lower than predicted (with a negligible difference between the latter). As a consequence, the reactance indices, AX and Fres were significantly higher than both the predicted values24 and the healthy group (online supplemental table S1).
Summary of spectral and Intrabreath oscillometry measurements
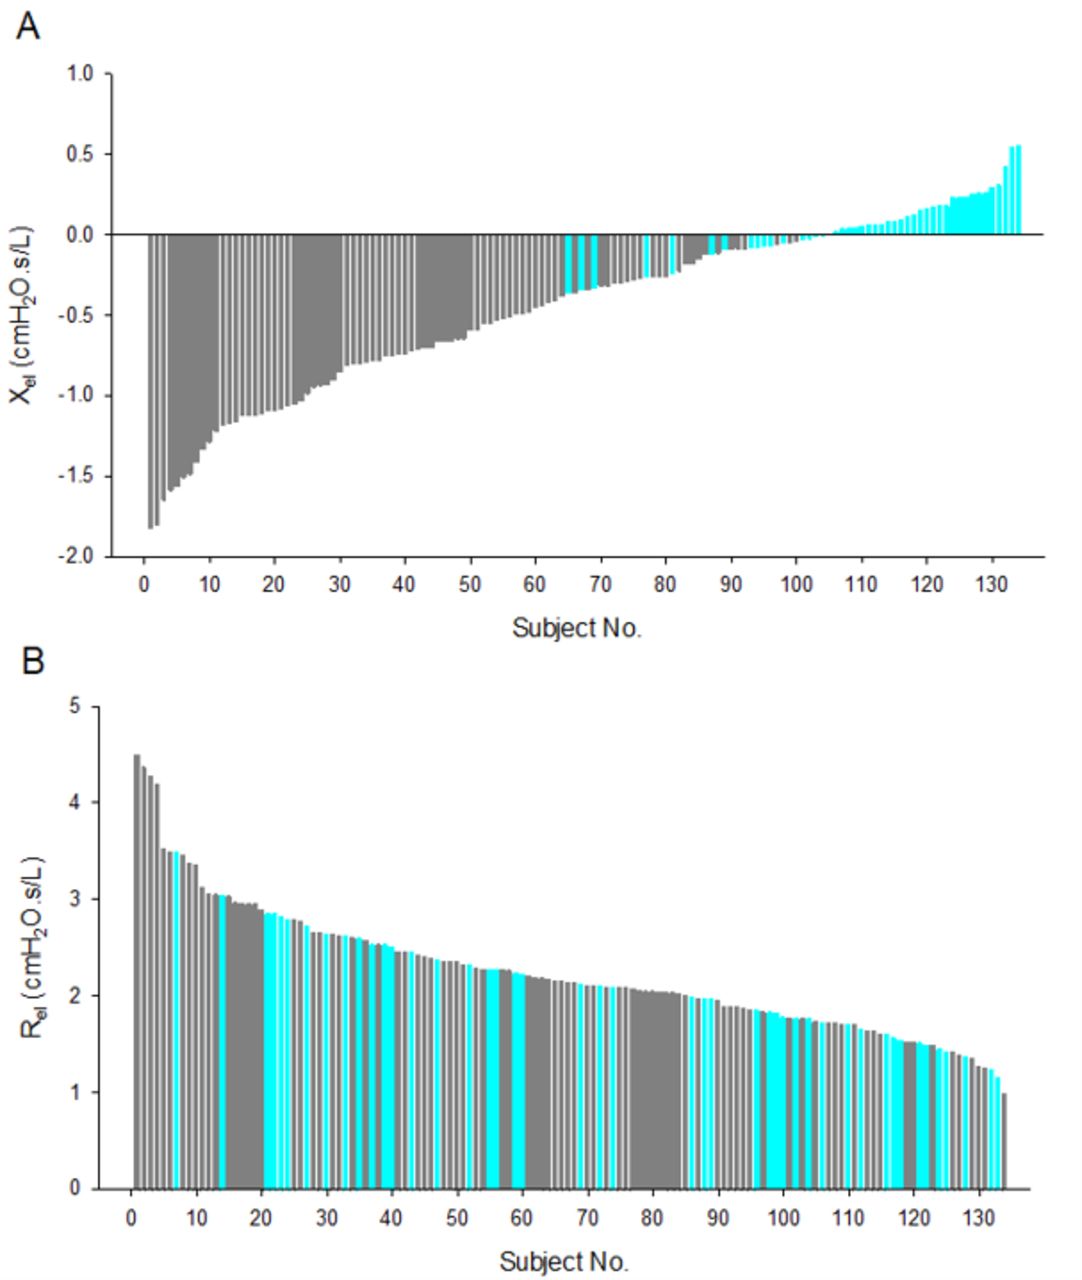
The intrabreath metrics reflected slightly elevated Rrs at resting lung volume (ReE) as compared with the healthy controls (online supplemental table S1); however, this difference disappeared at end-inspiration. Accordingly, the tidal change in Rrs, (ReE-ReI), was higher in the IPF group and more pronounced when the changes were normalised by VT. The zero-flow Xrs metrics (XeE and XeI) and the tidal changes (XeE-XeI and (XeE-XeI)/VT) were significantly different from the healthy group (online supplemental table S1). The contrast between the subtle alterations in Rrs and the marked changes in Xrs in IPF is also illustrated by the rank order plots of ReI and XeI; while the IPF and healthy subjects are intermingled in the whole range of ReI values, the IPF group was distinctly clustered at low values of XeI (figure 2).
Rank order plot of end-inspiratory reactance (XeI (A)) and resistance (ReI (B)) measured in patients with IPF (n=89; grey bars) and healthy subjects (n=45; cyan bars). IPF, idiopathic pulmonary fibrosis.
We had complete data to calculate the GAP score in 74 patients (table 3). Of these, 48 patients were in GAP Stage I, 22 in GAP Stage II and 5 were in GAP Stage III. No differences in age or sex were found among the three groups, while those in Stage III had significantly lower body mass index compared with GAP Stages I and II. Smoking status was different among the groups. We also observed an elevation in XeE-XeI and XeE-XeI/VT with increasing GAP stage although this was not statistically significant. Comparison of the oscillometry among the three GAP categories was notable for the significant progressive decrease in XeI with increasing GAP stages, accompanied by no change in XeE. Of all the oscillometry parameters, XeI was the only metric that was significantly different among the GAP stages (p<0.004).
Patient demographics and oscillometry parameters according to the GAP score
Quantitative analyses of CT images and correlation with oscillometry
Thirty participants had a non-contrast high-resolution CT of the chest within 6 months of paired oscillometry-conventional PFT. Segmentation and texture analysis of the lung in a patient with IPF using the Lung Texture Analysis tool are shown in online supplemental figure S1. Segmentation failed in four cases after manual review of the output (one case of pneumomediastinum, one case of pacemaker, one case of shoulder arthroplasty and one case of failed central airway segmentation). The demographics, conventional PFT and oscillometry measurements of the remaining 26 patients were not significantly different from the overall cohort (tables 1 and 2). CT texture analysis found that TLCCT was lower than the PFT-measured TLC (3.5±1.1 vs 4.3±1.0 L), with 76.9%±15.9% normal lung volume, 20.8%±16.3% ILD extent and 5.3%±2.4% PVV (online supplemental table S3).
Comparison of spectral and intrabreath oscillometry data with automated CT parameters revealed the highest correlations for XeI with almost all CT-derived parameters (table 4). The highest coefficients of determination for XeI were with PVV and ILD extent (R2=0.69 and 0.62, respectively). For spectral oscillometry, moderate correlations (R2<0.20) were found with X5, X5in, X5ex and AX with the PVV and ILD extent. After adjusting for %FVC, %DLCO, GAP score, XeI remained significantly correlated with PVV and ILD extent (p<0.001 and p=0.002, respectively). The adjusted R2 values indicate that the correlation of XeI is higher for PVV than ILD extent (table 5).
Correlation of Oscillometry with CT-derived metrics
Results of multivariate analysis
Correlations of conventional PFTs with oscillometry
Analysis of intrabreath oscillometry measurements (table 6) revealed that XeI was most highly correlated with TLC and fit better than the spectral oscillometry measurement of X5in (r2=0.58 vs 0.45). Similarly, XeI correlated better than X5in with FVC (R2=0.50 vs 0.44). Of the main physiological parameters in the GAP index, FVC was most significantly correlated with XeI, followed by X5in, X5, AX and Fres, while DLCO was most correlated with X5in and X5.
Correlation of oscillometry with conventional PFTs
Discussion
This is the first study to apply both conventional (spectral) and intrabreath oscillometry for characterisation of patients with IPF who meet the consensus guidelines definition, and to evaluate the correlations of oscillometry with CT-derived metrics of lung volume and lung injury. Intrabreath oscillometry is a novel modality that evaluates dynamic changes in the airways and respiratory tissues during the breathing cycle using a tracking signal with sufficient temporal resolution (0.1 s in the current study).17 25 We observed excellent correlations of XeI with ILD extent and PVV, which remained significant after adjusting for %FVC, %DLCO and GAP score. These novel findings suggest that intrabreath oscillometry identified a physiological-structure signal that was undetectable by conventional PFTs nor standard oscillometry and revealed only by automated CT chest image analysis.6
PVV is a biomarker unique to CALIPER-based analyses that has no visual correlate.6 It is a quantification of vessel-related structures, as determined by the machine learning algorithm when assessing for ground-glass opacities, reticulation and honeycombing. While previously unrecognised, PVV has been shown to be the most important CT metric in predicting disease progression and mortality in patients with IPF.6–9 26 The strong and unique correlation of PVV with XeI in particular indicates that intrabreath oscillometry provides additional information regarding IPF severity that complements conventional PFT and routine visual CT analyses.
Various theories have been proposed to explain the correlation of PVV with IPF severity. Some relate to the intuitive abnormalities of blood-flow diversion, vascular collateralization and pulmonary hypertension6 as well as other potential vascular abnormalities in patients with IPF.27 It has been proposed that increased PVV is secondary to markedly negative intrathoracic pressures generated by the low-compliance, fibrotic lung at end-inspiration causing expansion of the pulmonary vasculature.6 The fact that the strongest correlation of oscillometry with PVV was exhibited by the end-inspiratory reactance (XeI) supports the theory that PVV is a marker of highly negative intrathoracic pressures in patients with IPF at end-inspiration. The marked increase in the retracting forces transmitted to the bronchial wall also explains the typical absence of airway obstruction in IPF; in fact, the ReI values were as low as that in the healthy group and the other Rrs measures were not much higher either (online supplemental table S1).
XeI proved to be the single oscillometry parameter that was the most highly correlated with FVC (r2=0.50) and TLC (r2=0.58); the correlations were higher than the spectral parameter of X5in. XeI was also the only oscillometry parameter that correlated with the GAP Stage. We observed a trend to increasingly large changes in the reactance during a tidal breath as reflected by higher XeE-XeI values with increasing GAP stage (table 3). The intrabreath metrics, XeI and XeE, are exquisitely sensitive to the changes in lung elastance as they are estimated at zero flow, that is, at the endpoints of a tidal breath. The possibility that XeI, XeE-XeI and other intrabreath reactance indices could provide useful information regarding IPF severity will be explored with longitudinal follow-up. As the majority of our patients had mild disease (mostly GAP stage I) at enrolment, we will have the opportunity to evaluate XeI in tracking disease progression and/or drug efficacy if treatment is initiated during follow-up.
Spectral oscillometry showed a distinct pattern of basically normal respiratory resistance with a rightward shift of the reactance-frequency curve (figure 1), leading to increased AX and Fres when compared with the upper limits of normal of 9 cm H2O/L and 12 Hz, respectively.24 The good correlations of X5 and X5in with FVC and DLCO are in keeping with previous observations in two similarly-sized IPF cohorts14 15 although we found higher correlation coefficients between X5 with FVC14 15 and DLCO.14 Our findings also differ from the previous studies which reported normal AX (3.9 and 7.0 cmH2O/L) and Fres values (10.4 and 12.1 Hz).14 15 Our IPF cohort had lower X5 (−2.1 cmH2O s/L), higher AX (12.8 cmH2O/L) and Fres (21.3 Hz). While it is possible that these discrepancies are due to differences in disease severity between the groups (mean %predicted FVC=69.6 vs 95.114 and 83.3,15 it is more likely that they relate to intrinsic difference of the oscillometry devices. Comparisons of measurements made with the currently available commercial oscillometers28 show a large systematic bias with lower AX and Fres and higher (ie, less negative) reactance values with the device used in these studies;14 15 therefore, our present oscillometry results cannot be interpreted numerically in the context of their findings.
We found good correlations of AX and Fres with ILD extent. Our findings corroborate previous observations made by Yamamoto et al,15 the only published study to-date that has addressed the relationship between oscillometry and radiographic metrics. However, direct comparisons cannot be made as the Yamamoto study used a visual scoring system of quantifying structural abnormalities,15 which does not offer the ability to quantify PVV. Furthermore, automated CT image analysis has been shown to be superior to visual scoring of IPF severity.29 As previously reported,6 we also observed high correlation of % ground glass, ILD extent and PVV with conventional PFTs, particularly for %predicted TLC (r2=0.81, 0.72 and 0.60, respectively; online supplemental figure S2). Notably, correlation of PVV was higher for XeI than for %predicted TLC (r2=0.69 vs 0.60).
While all 89 patients completed spirometry and oscillometry, 15 were unable to perform full PFTs and 4 were too symptomatic to complete the 6MW test. This is not unusual in IPF as respiratory symptoms often limit patients’ ability to breath hold or to be off oxygen for the timed needed to perform lung volume measurements. In contrast, oscillometry is conducted during normal tidal breathing, eliminating the need for forced expiratory manoeuvres. A full oscillometry inclusive of spectral and monofrequency recordings can be completed in less than 10 min, offering an advantage over spirometry and conventional PFTs.
Interpretation of the novel intrabreath oscillometry measures is burdened by the lack of normative values, which are available for spectral oscillometry and conventional PFTs. Therefore, our comparison with a modest-size and not age-matched healthy group is only of illustrative value. Our study is also limited to a single centre, with the majority of patients being older men with mild IPF. With increased enrolment and follow-up, the proportion of patients with moderate and severe disease is expected to grow. As such, the strength of the associations between the oscillometry parameters with CT-derived metrics and disease severity is expected to improve. Furthermore, only a subset of patients had imaging in the appropriate time-frame for analysis.
In conclusion, the intrabreath parameter of XeI corresponds to the end-tidal elastance of the respiratory tissues that is not available from conventional PFTs. The high correlation of XeI with CT-derived metrics of PVV and ILD extent and the finding that these correlations remain significant after accounting for %FVC, %DLCO and the GAP score suggest that XeI provides complementary information regarding IPF severity, particularly in settings where access to subspecialty thoracic radiology expertise and/or automated quantitative CT analysis is limited. While quality control is important for accurate measurements, training of technicians to conduct oscillometry is relatively simple.18 Given the ease of conduct of oscillometry during normal tidal breathing, high patient satisfaction18 30 and the small environmental footprint of oscillometry devices, our findings support the addition of oscillometry and in particular, its intrabreath technique as an adjunct to routine PFTs in the management of patients with IPF.
Data availability statement
Data are available on reasonable request. Following publication of the manuscript, deidentified data will be made available on request following review, approval and completion of data sharing agreements between University Health Network and the requesting institution(s).
Ethics statements
Patient consent for publication
Ethics approval
This study involves human participants and was approved by The study was approved by the University Health Network Research Ethics Board under protocols REB# 17-5531, 17-5652 and 19-5582. Participants gave informed consent to participate in the study before taking part.
References
Supplementary materials
Supplementary Data
This web only file has been produced by the BMJ Publishing Group from an electronic file supplied by the author(s) and has not been edited for content.
Footnotes
Contributors JKYW drafted the manuscript, conducted the clinical review and analysis, conducted the statistical analysis plan, developed the standard operating procedures and quality control and assurance of the data. JM developed the statistical analysis plan, performed and oversaw data analysis. LN conducted the research, compiled the clinical data, performed the data analysis and drafted the manuscript. ELD verified the clinical data, conducted the clinical review and analysis and drafted the manuscript. EC, AV, JL, QWH and AC conducted the research, refined the standard operating procedures and participated in the data analysis. MB, SS and JF provided feedback on study design and edited the manuscript. ZH advised quality control and interpretation of the respiratory oscillometry data and edited the manuscript. CMR developed the research protocol, ensured quality control of the pulmonary function data and edited the manuscript. MCM performed the data analysis of CT scans and edited the manuscript. CW-C developed the concept, study protocol, oversaw all aspects of the project and is the guarantor for the study.
Funding The study was funded by CIHR-NSERC Collaborative Health Research Projects Fund 175 072 (CW-C), Pettit Block Term grant (CW-C) and Canadian Lung Association—Breathing as One: Allied Health Grant (JW). ZH is supported by Hungarian Scientific Research Fund Grant K128701. ZH is recipient of the ERS Clinical Research Collaboration Award as a host of the intrabreath oscillometry development. Thorasys Thoracic Medical Systems Inc (Montreal, Canada) provided the software for the 10 Hz sinusoidal frequency recordings.
Competing interests C-WC has received speaking fees for webinars supported by Thorasys Thoracic Medical Systems Inc. and has received consulting fees for Theravance Biopharma, Inc. ZH has received consultation fees from Thorasys Thoracic Medical Systems Inc. on subjects unrelated to this study.
Patient and public involvement Patients and/or the public were not involved in the design, or conduct, or reporting, or dissemination plans of this research.
Provenance and peer review Not commissioned; externally peer reviewed.
Supplemental material This content has been supplied by the author(s). It has not been vetted by BMJ Publishing Group Limited (BMJ) and may not have been peer-reviewed. Any opinions or recommendations discussed are solely those of the author(s) and are not endorsed by BMJ. BMJ disclaims all liability and responsibility arising from any reliance placed on the content. Where the content includes any translated material, BMJ does not warrant the accuracy and reliability of the translations (including but not limited to local regulations, clinical guidelines, terminology, drug names and drug dosages), and is not responsible for any error and/or omissions arising from translation and adaptation or otherwise.