Article Text

Abstract
Introduction Chronic obstructive pulmonary disease (COPD) can progress across several domains, complicating the identification of the determinants of disease progression. In our previous work, we applied k-means clustering to spirometric and chest radiological measures to identify four COPD-related subtypes: ‘relatively resistant smokers (RRS)’, ‘mild upper lobe-predominant emphysema (ULE)’, ‘airway-predominant disease (AD)’ and ‘severe emphysema (SE)’. In the current study, we examined the associations of these subtypes to longitudinal COPD-related health measures as well as blood transcriptomic and plasma proteomic biomarkers.
Methods We included 8266 non-Hispanic white and African-American smokers from the COPDGene study. We used linear regression to investigate cluster associations to 5-year prospective changes in spirometric and radiological measures and to gene expression and protein levels. We used Cox-proportional hazard test to test for cluster associations to prospective exacerbations, comorbidities and mortality.
Results The RRS, ULE, AD and SE clusters represented 39%, 15%, 26% and 20% of the studied cohort at baseline, respectively. The SE cluster had the greatest 5-year FEV1 (forced expiratory volume in 1 s) and emphysema progression, and the highest risks of exacerbations, cardiovascular disease and mortality. The AD cluster had the highest diabetes risk. After adjustments, only the SE cluster had an elevated respiratory mortality risk, while the ULE, AD and SE clusters had elevated all-cause mortality risks. These clusters also demonstrated differential protein and gene expression biomarker associations, mostly related to inflammatory and immune processes.
Conclusion COPD k-means subtypes demonstrate varying rates of disease progression, prospective comorbidities, mortality and associations to transcriptomic and proteomic biomarkers. These findings emphasise the clinical and biological relevance of these subtypes, which call for more study for translation into clinical practice.
Trail registration number NCT00608764.
- COPD Exacerbations
- COPD epidemiology
- Emphysema
- Imaging/CT MRI etc
Data availability statement
Data are available in a public, open access repository.
This is an open access article distributed in accordance with the Creative Commons Attribution Non Commercial (CC BY-NC 4.0) license, which permits others to distribute, remix, adapt, build upon this work non-commercially, and license their derivative works on different terms, provided the original work is properly cited, appropriate credit is given, any changes made indicated, and the use is non-commercial. See: http://creativecommons.org/licenses/by-nc/4.0/.
Statistics from Altmetric.com
WHAT IS ALREADY KNOWN ON THIS TOPIC
Previous reports have grouped patients with chronic obstructive pulmonary disease (COPD) based on their cross-sectional spirometric, imaging and clinical features. However, few studies have explored the longitudinal outcomes and transcriptomic and protein biomarker characteristics of COPD subtypes.
WHAT THIS STUDY ADDS
COPD k-means subtypes show notable differences in regard to 5-year changes in FEV1 (forced expiratory volume in 1 s) and CT-quantified emphysema, as well as prospective risks of respiratory exacerbations, cardiovascular disease, diabetes and mortality. These subtypes also exhibit differences in their associations to whole blood transcriptomic and plasma proteomic biomarkers.
HOW THIS STUDY MIGHT AFFECT RESEARCH, PRACTICE OR POLICY
The heterogeneity of COPD progression presents major clinical challenges in risk-stratifying patients. The differences in cross-sectional and longitudinal associations of COPD subtypes may shed light on the biology of the disease and help with individualised care.
Introduction
Chronic obstructive pulmonary disease (COPD) is a heterogeneous disorder, with a wide variety of clinical manifestations.1 Additionally, disease progression in COPD occurs across multiple domains, such as lung function decline, worsening of emphysema and development of comorbidities.2–4 These challenges complicate COPD subtyping and the identification of the determinants of COPD progression.
Subtyping beyond the Global Initiative for Chronic Obstructive Lung Disease (GOLD) criteria is essential. Numerous investigations have revealed that many smokers without spirometry-defined obstruction experience respiratory symptoms, emphysema and airway thickening that are similar to those with traditionally defined COPD based on the GOLD criteria.5–8 COPD subtyping presents an opportunity to advance toward more individualised treatment for this complex and heterogeneous disease.
Several reports have shown that factors, such as COPD exacerbation history, reduced pulmonary function, and a low body mass index (BMI), are associated with an elevated risk of respiratory exacerbations, accelerated spirometric decline and emphysema changes.2 9 10 Additionally, studies which have subtyped subjects with COPD based on spirometry, respiratory symptoms and other characteristics have revealed that these subgroups differ in their risks for exacerbations, hospital admissions and forced expiratory volume in 1 s (FEV1) and emphysema changes.11–15 However, many of these studies have modest sample size and limited longitudinal follow-up. Furthermore, while comorbid conditions such as cardiovascular disease (CVD) and type 2 diabetes mellitus are common in subjects with COPD, the specific COPD-related characteristics associated with the risk of developing these comorbidities have not been fully described.16 17 According to earlier studies, more severe airflow obstruction and COPD exacerbation history are associated with higher risks of COPD exacerbations and CVD.11 18–20 In addition, Hersh et al have previously demonstrated in cross-sectional data that COPD with limited emphysema and high airflow obstruction is associated with diabetes.21 However, the particular COPD-related traits linked to the likelihood of acquiring these comorbidities have not yet been thoroughly defined.16 17 Similarly, while transcriptomic signatures have been identified in COPD, the differences in such patterns between COPD subtypes have not been rigorously investigated.22–24 Moreover, different protein biomarkers have been identified in subjects with COPD, but few studies have assessed subtype-specific proteomic signatures.25
In our previous work, we applied k-means clustering to spirometric and chest radiological measures and identified four COPD-related subtypes: ‘Relatively resistant smokers (ie, no/mild airflow obstruction and minimal emphysema despite heavy smoking) (RRS)’, ‘mild upper lobe-predominant emphysema (ULE)’, ‘airway-predominant disease (AD)’ and ‘severe emphysema (SE)’, which had differing cross-sectional profiles and genetic associations.26 In the current study, we included up to 12.7 years of prospective data to investigate subtype-specific rates of progression in spirometric measures and radiological emphysema and to quantify the risks of prospective COPD exacerbations, CVD events, diabetes and mortality. We also performed transcriptome and proteome-wide discovery analyses between the subtypes using high-throughput platforms. We hypothesised that these subtypes would have different disease progression profiles and associations to biomarkers. Some of these results have been previously reported as an abstract27 and in the form of a preprint.28
Methods
Study description
The COPDGene study is a prospective, multicentre, longitudinal study investigating the genetic and epidemiological characteristics of COPD across 21 centres in the USA (NCT00608764, www.copdgene.org).29 Institutional review board approval was obtained at each study centre. Patients or the public were not involved in the design, conduct, reporting or dissemination plans of our research. This study enrolled non-Hispanic whites and African-Americans, who were 45–80 years old and had at least 10 pack-years of lifetime smoking history. Subjects were recruited across the full spectrum of disease severity as defined by the GOLD spirometric grading system.29 Normal spirometry (GOLD grade 0) was defined as a postbronchodilator FEV1/forced vital capacity (FVC) ≥0.7 and FEV1 ≥80% predicted. GOLD 1–4 were defined as FEV1/FVC <0.70 and postbronchodilator FEV1 ≥80% predicted (GOLD 1), FEV1/FVC <0.70 and postbronchodilator FEV1 50%–79% predicted (GOLD 2), FEV1/FVC <0.70 and postbronchodilator FEV1 30%–49% predicted (GOLD 3), and FEV1/FVC <0.70 and postbronchodilator FEV1<30% predicted (GOLD 4).30 COPDGene conducted two study visits (Visit 1 and Visit 2) approximately 5 years apart. Subjects were also contacted every 3–6 months through the COPDGene Longitudinal Follow-up programme via phone or online surveys to collect data on incident COPD-related events, comorbidities and mortality. COPD-related events and comorbidities included self-reported COPD exacerbations (defined as the acute worsening of respiratory symptoms that required systemic steroids and/or antibiotics),30 CVD events (defined as a composite endpoint of stroke, heart attack, coronary artery disease, coronary artery bypass graft surgery, peripheral artery disease and/or cardiac angina) and type 2 diabetes mellitus. All-cause mortality was determined through a combination of longitudinal follow-up and a search of the social security death index. Cause-specific mortality was categorised as respiratory related, CVD related, cancer related (any type) or due to other causes and determined through systematic adjudication process based on the methods used in the Towards a Revolution in COPD Health (TORCH) trial.31 More information about the COPDGene is available elsewhere.29
Demographics, spirometry, imaging, smoking burden, respiratory symptoms and comorbidities were collected at Visits 1 and 2. In addition to GOLD grades 0–4, we included subjects with Preserved Ratio Impaired Spirometry (PRISm), defined as FEV1/FVC ≥0.70 but with FEV1 <80% predicted.30 Thirona software (www.thirona.eu) was used to quantify emphysema as the percentage of lung voxels with an attenuation of < −950 HU (Hounsfield unit) at maximal inspiration (%LAA-950).32 The Hounsfield units at the 15th percentile of the CT density histogram at end inspiration corrected for the depth of inspiratory variation (adjusted Perc15 density) were used for longitudinal changes in emphysema.33 34 Per convention, adjusted Perc15 density values are reported as HU+1000. Total blood RNA was collected at Visit 2. The levels of 1305 protein biomarkers (SOMAscan Human Plasma 1.3K assay) were obtained from plasma samples collected at Visit 1.35
Cluster generation
We used the k-means clusters that were generated in our previously published work.26 FEV1 percent predicted, CT-quantified emphysema, percent airway wall thickness and apicobasal emphysema distribution (log of the lung upper third to lower third ratio of emphysema) were the input features that were used for clustering at Visit 1. Using the same approach, we also performed k-means clustering at Visit 2 to assess cluster assignment stability between the two visits and to conduct differential gene expression analyses using RNA-Seq data available at Visit 2. The percentage of subjects in a cluster at Visit 1 who are still in the same cluster at Visit 2 was used to assess cluster assignment stability.
Statistical analyses
Data distributions were reported as medians with IQRs or counts with percentages, where appropriate. We calculated FEV1 and emphysema changes as either absolute or relative annualised changes. We computed absolute annualised changes by subtracting Visit 1 from Visit 2 values and dividing the difference by the time in years between visits for each subject. Relative annualised changes were obtained by dividing the absolute annualised changes by Visit 1 values and multiplying by 100. Negative values indicate worsening of the disease between visits. Lower adjusted Perc15 density (emphysema) values indicate worse emphysema. Emphysema change resembles FEV1 change in that negative change values indicate a lower value of the outcome at Visit 2 (ie, lower adjusted Perc15 density/worsening emphysema at Visit 2). We used the Kruskal-Wallis and χ2 tests for continuous and categorical variables, respectively. We subsequently performed post hoc pairwise comparisons between the clusters using the Nemenyi and χ2 tests for continuous and categorical variables, respectively. Additionally, we constructed univariable and multivariable linear regression models to relate changes in FEV1 and emphysema as well as plasma proteins to cluster assignment. We assessed risks of incident COPD exacerbations, CVD events, diabetes and mortality using Cox proportional hazards models and obtained survival curves using the Kaplan-Meier method. For the analyses of incident CVD events and diabetes, we excluded subjects who had a history of CVD or diabetes at Visit 1. We used the RRS cluster as the reference group. Linear regression and Cox models were adjusted for relevant baseline physiological, clinical and demographic characteristics. For analyses investigating the risk of diabetes, we adjusted for age, sex, race, smoking pack-years and systemic steroid use. We additionally adjusted for metabolic syndrome in the CVD multivariable Cox models and for BMI, airflow obstruction and exercise capacity (BODE index) and GOLD in the mortality models. To ensure that cluster associations to emphysema changes are not confounded by CT scanner type, a sensitivity analysis was performed by adding scanner type as a covariate in a subgroup analysis limited to subjects who underwent scans with the same scanner type between visits.
To test for differential gene expression between clusters, we used the linear modelling approach implemented in the limma R package (V.3.38.3)36 adjusting for age, sex, current smoking, white cell count proportions and library preparation batch. Gene ontology (GO) functional enrichment of the gene sets was calculated using the weighted Fisher test in the topGO Bioconductor package that accounts for the dependency between terms in the GO topology.37 We reported only the GO pathways with at least three significant genes. For the protein analyses, we adjusted for age, sex, race and current smoking status. We conducted an additional analysis where we limited the study population to subjects who were in the SE cluster at Visit 1 and remained in the SE cluster at Visit 2. We then built multivariable regression models relating SOMAscan plasma proteins to absolute and relative emphysema changes. We also tested for differential gene expression and protein associations by comparing subjects who transitioned from RRS to those who stayed within RRS at Visit 2 using multivariable linear regression.
All tests for the clinical outcomes were two-tailed with a significance threshold of p-value <0.05. For the protein and RNA-Seq analyses, we corrected for multiple comparisons using the Benjamini-Hochberg method and applied a threshold of significance of false discovery rate (FDR) of 10%.38 Significantly enriched GO pathways were identified using the weighted Fisher p-value <0.005.
Additional methods are available in the Online supplemental file.
Supplemental material
Results
The overview of the study is shown in figure 1, and the study flow diagram is outlined in online supplemental figure 1. Subjects who were not included in the analyses of longitudinal changes in FEV1 and emphysema, 935 of whom died between the first and second study visit, had a higher proportion of GOLD spirometric grade 4 disease (online supplemental table S1).
Supplemental material
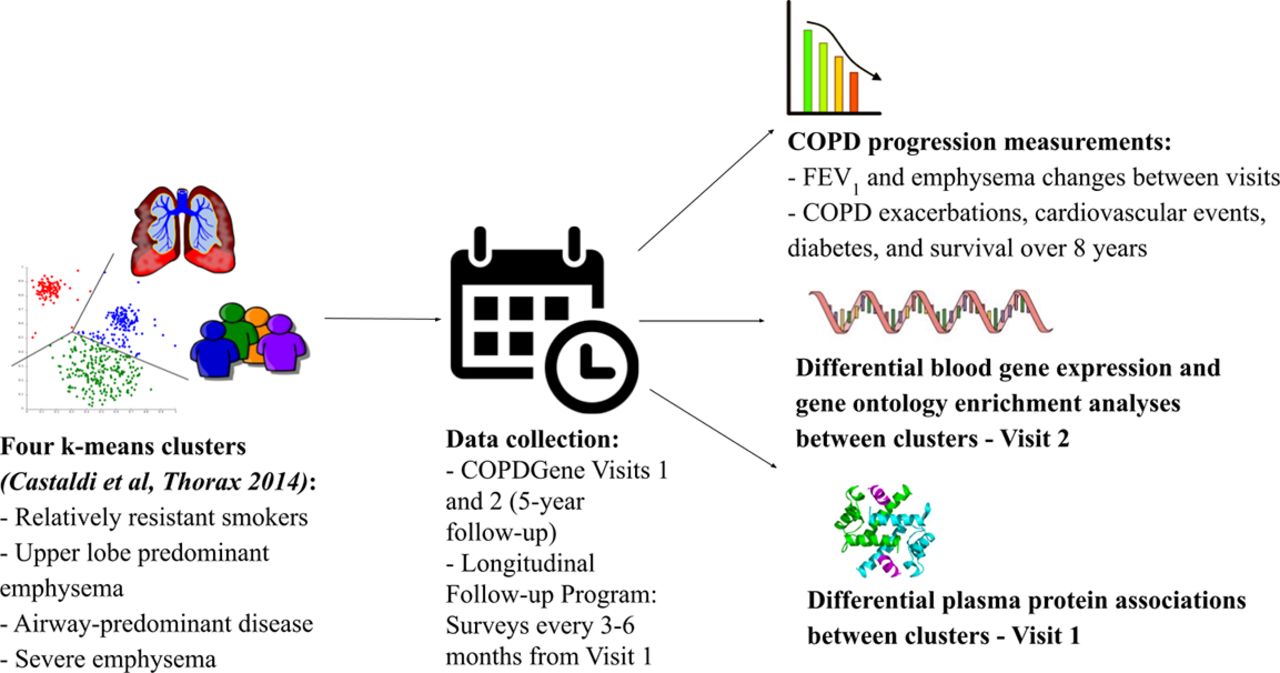
Study design. The goal of the study was to analyse chronic obstructive pulmonary disease (COPD) progression, differential blood gene expression, differential plasma protein associations and gene ontology enrichment characteristics of the four clusters that we identified in our previous k-means clustering analysis in the COPDGene study (Castaldi et al, Thorax 2014).
Cluster characteristics at baseline and stability of cluster assignments between visits
The RRS cluster represented 39% of the studied population at the baseline visit and was characterised by a history of heavy smoking without significant airflow obstruction, emphysema or airway wall thickness compared with the other clusters (p<0.05) (online supplemental table S2). Additionally, the majority of the subjects in the RRS cluster were GOLD 0–1. At Visit 2, RRS cluster membership was stable as 76.3% of subjects were still assigned to this cluster (online supplemental figure 2). The ULE cluster consisted of 15% of all subjects and had moderate airflow obstruction and mild emphysema predominantly in the upper lung lobes. The ULE cluster was relatively unstable, with only 38% of subjects remaining within this cluster at their follow-up visits. The AD cluster, 26% of all participants, was characterised by high BMI and had the highest proportion of subjects with PRISm (p<0.05). The AD cluster was more stable than the ULE cluster with 53% of subjects staying within this cluster at their follow-up visits. The SE cluster, 20% of the studied cohort, exhibited high emphysema and gas trapping and had the highest proportion of GOLD 3–4 smokers (p<0.05). The SE cluster was very stable as 92.2% of subjects remained within the SE cluster at Visit 2. 7.8% of the subjects in the SE cluster at Visit 1 did transition to a different cluster at Visit 2. Of those, 2.4% transitioned to the RRS cluster, 4.3% transitioned to the ULE cluster and 1.1% transitioned to the AD cluster (online supplemental figure 2). For subsequent analyses of longitudinal outcomes and protein data by k-means clusters, subjects were analysed according to their cluster assignment at Visit 1.
Supplemental material

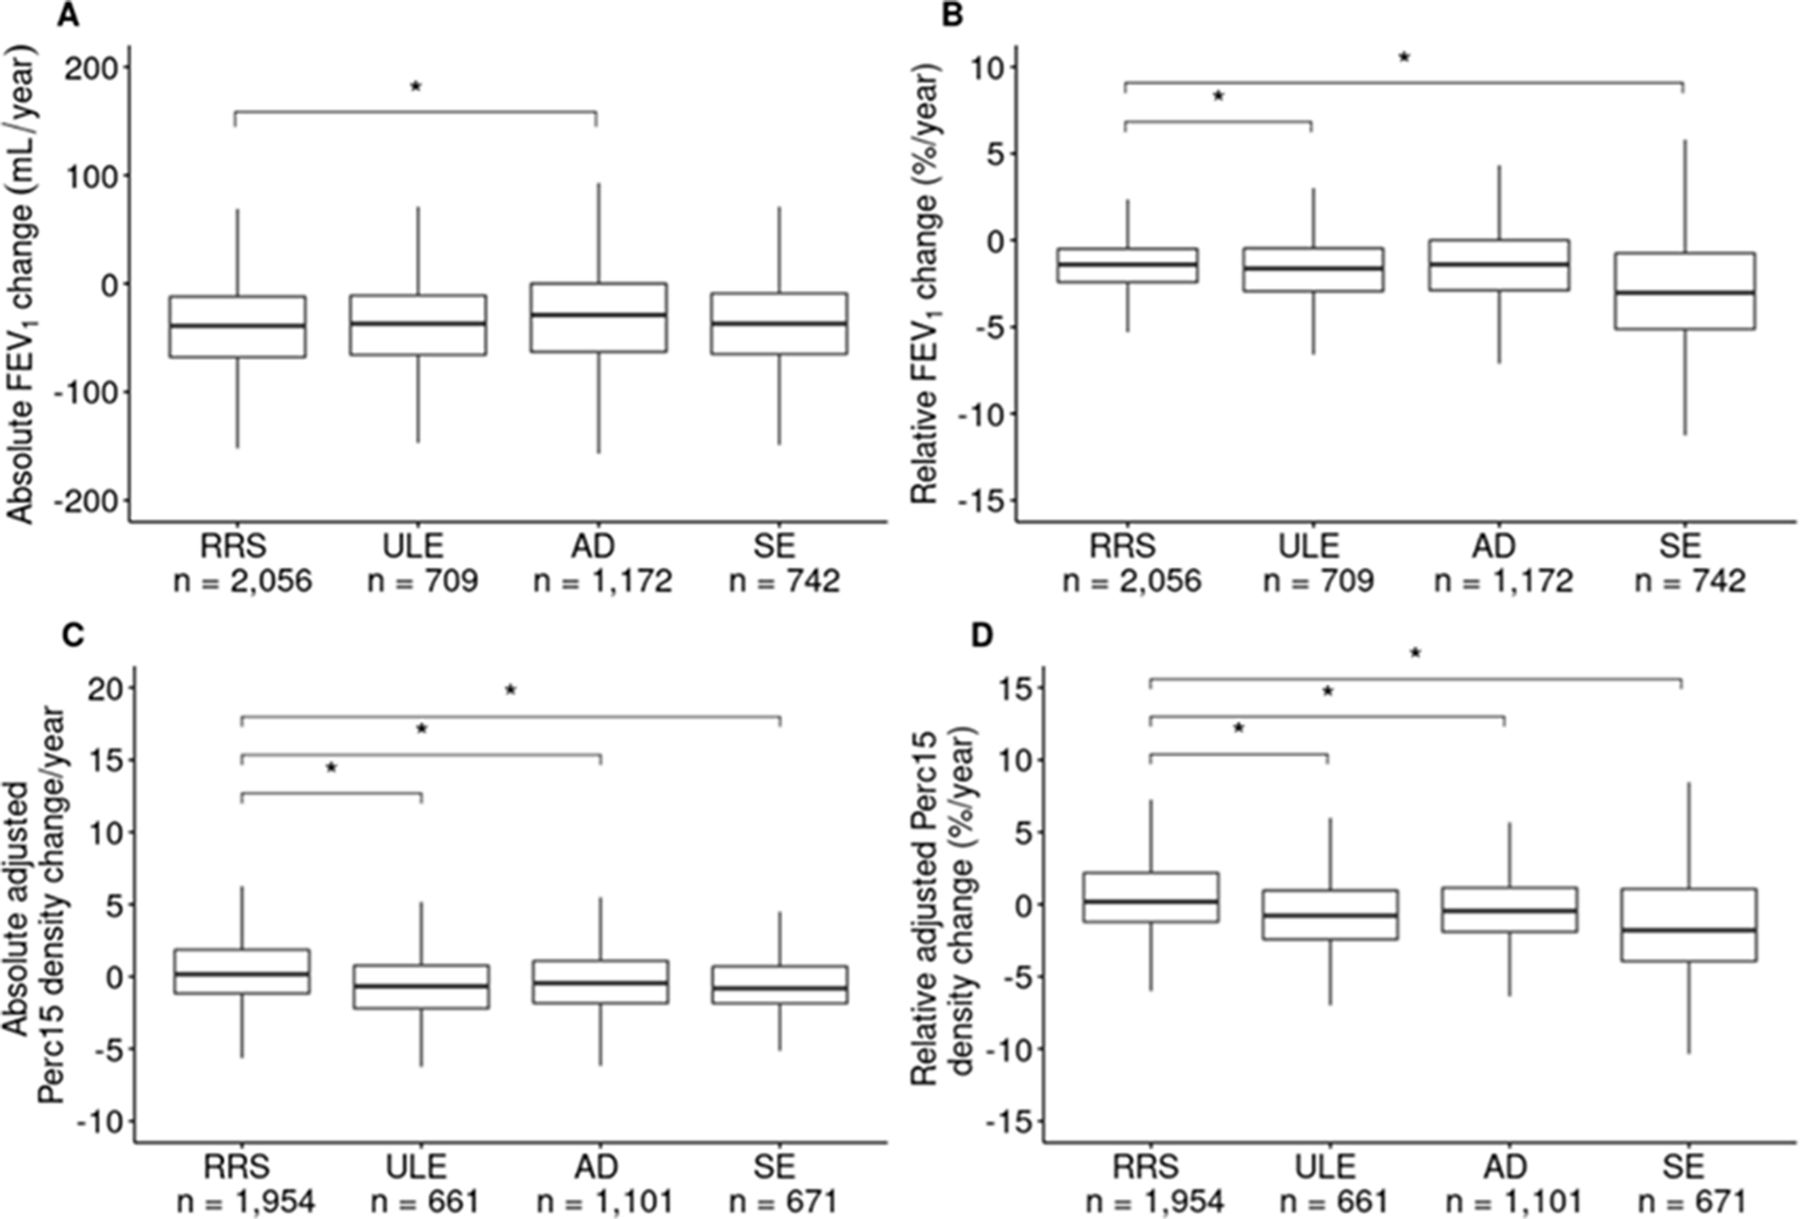
Disease progression by k-means cluster. (A) Absolute change in FEV1 (mL/year). (B) Relative change in FEV1 (change as % of baseline value/year). (C) Absolute change in emphysema measured as adjusted Perc15 density change/year. (D) Relative change in emphysema measured as adjusted Perc15 density change (% of baseline value/year). P- values <0.05 are indicated by an asterisk. AD, airway-predominant disease; FEV1, forced expiratory volume in 1 s; Perc15, 15th percentile; RRS, relatively resistant smokers; SE, severe emphysema; ULE, upper lobe-predominant emphysema.
Cluster-specific rates of spirometric and emphysema progression
The 5-year change values for FEV1 (measured as absolute change in FEV1 and percent change relative to baseline) and emphysema are shown in figure 2, and the results from the univariable and multivariable models are shown in table 1. The RRS cluster, which has the least impaired spirometry and emphysema at baseline, had the greatest loss in absolute FEV1. The AD cluster had the lowest absolute loss in FEV1, significantly less than the RRS cluster in both univariable and multivariable models. Both the ULE and SE clusters had similar absolute FEV1 changes relative to the RRS cluster. However, when adjusted for relevant covariates, the SE cluster had significantly less absolute FEV1 decline than the RRS cluster. While absolute FEV1 changes were notably higher in the RRS cluster, percent changes in FEV1 relative to baseline were most pronounced in the SE cluster. Pairwise comparisons between all clusters showed that both emphysema-related clusters (ULE and SE) had significantly larger relative changes in percent FEV1 relative to baseline than both the RRS and AD clusters (p<0.05; online supplemental table S3). Compared with FEV1 changes, the pattern of CT-quantified emphysema progression was less sensitive to the metric being used (absolute vs relative). The SE cluster had the most rapid while the RRS cluster had the least rapid relative progression in both univariable and multivariable models. The ULE and AD clusters had significantly greater absolute and relative emphysema changes than the RRS cluster. The ULE cluster had significantly greater relative emphysema progression than the AD cluster (pairwise p-value: 0.03; online supplemental table S4). We noted similar cluster associations to both absolute and relative emphysema changes when we added scanner type as a covariate in the subgroup analysis limited to subjects who underwent scans with the same scanner type between visits (online supplemental table S6).
Associations of k-means clusters with absolute and relative annualised FEV1 and emphysema changes
Cluster-specific risk of incident comorbidities and COPD-related events
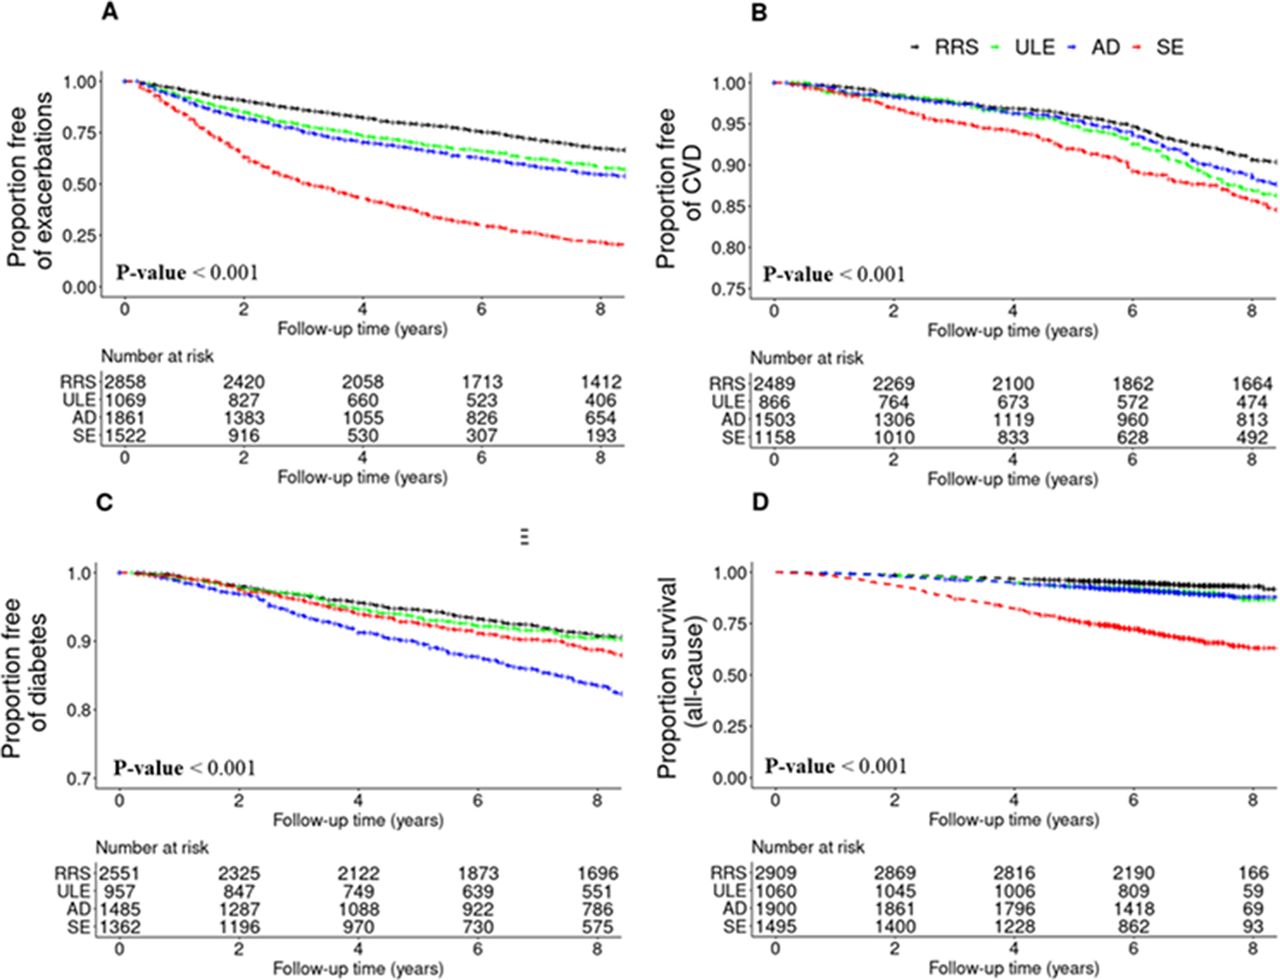
Starting from Visit 1, the median follow-up time was 9.2 years for prospective CVD and diabetes, 5.3 years for respiratory exacerbations, 9.5 years for all-cause mortality and 7.8 years for cause-specific mortality. When we analysed prospective risks of various health outcomes by subtype, we observed that the SE cluster had the highest risk for prospective COPD exacerbations and incident CVD (figure 3). After multivariable adjustment, the SE cluster had a three times higher likelihood of having a COPD exacerbation when compared with the RRS cluster (HR 2.98 (SE: 0.05), p<0.001) (online supplemental table S5). The AD cluster had the highest risk of incident diabetes (HR 1.97 (SE: 0.09), p<0.001), and this association remained significant after correcting for age, sex, race, BMI, smoking pack-years and systemic steroid treatment. COPD exacerbation and CVD risks were higher in the ULE cluster compared with the RRS cluster (p<0.05).

Kaplan-Meier plots of COPD-related events by k-means cluster. (A) COPD exacerbation, defined as the acute worsening of respiratory symptoms that required antibiotics and/or systemic steroids. (B) Cardiovascular disease (CVD) event, defined as a composite endpoint of stroke, heart attack, coronary artery disease, coronary artery bypass graft surgery, peripheral artery disease and/or cardiac angina. (C) Diabetes. (D) All-cause mortality. For CVD events and diabetes, subjects who had a history of CVD or diabetes at Visit 1 were excluded from the analysis. AD, airway-predominant disease; COPD, chronic obstructive pulmonary disease; RRS, relatively resistant smokers; SE, severe emphysema; ULE, upper lobe-predominant emphysema.
Survival curves by subtype are shown for all-cause mortality (figure 3) and for cause-specific mortality (online supplemental figure 3). Results of the survival models are presented in online supplemental table S6. In the univariable models, subjects in the SE cluster had the highest risks of all-cause, respiratory-related, CVD-related, cancer-related and other cause-related mortality relative to the RRS cluster (6, 50, 3, 3 and 2 times higher, respectively; p<0.0001) (online supplemental table S6). The risks for all-cause, respiratory and CVD mortality were also elevated for the ULE and AD clusters relative to RRS (p<0.05). In multivariable models adjusting for age, sex, race, smoking pack-years and BODE, statistical significance was maintained for the associations of the ULE, AD and SE clusters with all-cause mortality, the association of the SE cluster with respiratory mortality, the associations of the ULE and AD clusters with CVD mortality and the association of the ULE cluster with cancer mortality (p<0.05). When adjusting for GOLD, age, sex race, BMI, smoking pack-years and the BODE index, the all-cause mortality risk of the ULE, AD and SE clusters remained significantly elevated (p<0.05). The respiratory mortality risk of the SE cluster also remained elevated (p<0.05). On the other hand, the addition of GOLD as a covariate led to non-significantly elevated CVD mortality risk of the ULE and AD clusters, and the ULE cluster was no longer significantly associated with an elevated cancer mortality risk.
Supplemental material
Clusters’ associations to gene expression and protein biomarkers
Using blood RNA sequencing data from 2072 subjects at Visit 2, we identified significant associations to 3, 2,105 and 148 genes for the ULE, AD and SE clusters, respectively, with the RRS group as the reference. The Bland-Altman plots are shown in figure 4, and the complete set of association results is reported in online supplemental table 7. Compared with the RRS cluster, the ULE cluster was associated with the upregulation of the GPR15, AHRR and GPR55 genes, and GO pathway enrichment analysis results did not identify any significantly enriched pathways (table 2). The AD cluster had particularly strong differences in gene expression with 22 and 34 enriched pathways relative to the RRS and SE clusters, respectively. Compared with the RRS cluster, the AD cluster showed significant associations to pathways involved in innate immunity, cellular defence response, and NF-κB (nuclear factor kappa B) signalling. Relative to the SE cluster, the AD cluster demonstrated associations to processes involved in both innate and adaptive immunity (adjusted p-values <0.005). The SE cluster also had many differentially expressed genes, with significant pathway enrichment for positive regulation of synapse assembly and cell adhesion. The complete set of pathway enrichment results is reported in online supplemental table 8.
Supplemental material
Supplemental material

Bland-Altman (MA) plots of the log ratio versus mean gene expression for the differential expression analysis results between k-means clusters. The cluster following the ‘versus’ is the reference group. (A) ULE versus RRS. (B) AD versus RRS. (C) SE versus RRS. (D) AD versus ULE. (E) SE versus ULE. (F) SE versus AD. AD, airway-predominant disease; RRS, relatively resistant smokers; SE, severe emphysema; ULE, upper lobe-predominant emphysema.
Top 10 significantly differentially expressed genes and enriched GO terms between k-means clusters
Using SOMAscan plasma protein measurements at baseline from 1047 subjects, we tested for differential protein associations between clusters. Using the RRS group as the reference, we identified significant associations in adjusted models to 16, 65 and 219 proteins for the ULE, AD and SE clusters, respectively (FDR 10%) (online supplemental table 9). The most strongly associated proteins for the ULE cluster were related to mitochondrial function (ATP synthase peripheral stalk subunit OSCP and glucokinase regulatory protein) and cytoskeleton rearrangement (serine/threonine protein kinases MRCK-beta and PAK 6) (table 3). Top proteins associations for the AD cluster were primarily involved in fatty acid metabolism, such as elevated fatty acid-binding protein, leptin and retinoic acid receptor responder protein 2 and decreased apolipoprotein M. For the SE cluster, top associated proteins were related to innate immunity, such as bactericidal permeability-increasing protein, complement component C9 and protein S100-A12. The overlap of the protein associations between subtypes is shown in online supplemental figure 4.
Supplemental material
Supplemental material
Top five unique significantly differentially associated proteins between k-means clusters
In subjects in the SE cluster at Visit 1 that remained in the SE cluster at Visit 2, there were 80 and 64 significant protein biomarker associations to absolute and relative emphysema changes (online supplemental table 10). Of the 80 associations, the top five included decreased metalloproteinase inhibitor 3 (TIMP-3), PKC-G, secreted protein acidic and cysteine rich (ON), amyloid precursor protein and nidogen (online supplemental table S11). Of the 64 associations, the top five included decreased TIMP-3, IGFBP-3 (IGF Binding Protein-3), plasminogen activator inhibitor 1, nidogen and increased serine/threonine protein kinase Chk2 (Chk2) (online supplemental table S11). There was a total of 41 shared significant associations that were mostly related to inflammatory processes (toll-like receptor 4, mast/stem cell growth factor receptor kit, interleukin 10, interleukin 17-soluble receptor and toll-like receptor 4 (TLR4)/myeloid differentiation factor 2 (MD-2) complex).
Supplemental material
The sample sizes of subjects who stayed within RRS at Visit 2 were 646 for the gene expression analysis and 248 for the protein association analysis. The sample sizes of subjects who transitioned from RRS at Visit 1 to any other cluster at Visit 2 were 275 for the gene expression analysis and 81 for the protein association analysis. When comparing subjects who transitioned from RRS to those who stayed within RRS at Visit 2, no significant associations to genes or GO pathways were observed. In terms of significant protein associations for this same comparison, the protein spectrin alpha chain, non-erythrocytic 1 (UniProt ID=Q13813) was the only one to produce a significant result (beta coefficient 0.14, SE 0.03, FDR=0.05) (online supplemental table S12).
Supplemental material
Discussion
In this study, we demonstrated that k-means subgroups of smokers enriched for COPD have varying disease progression patterns, development of prospective comorbidities and distinct associations to plasma protein and blood transcriptomic biomarkers. The two clusters at the extremes of the lung health spectrum (the RRS and SE clusters) showed high cluster assignment stability between the two visits. Spirometric progression was sensitive to the progression metric being used (absolute vs relative) with the SE subtype showing the most rapid rate of FEV1 decline relative to baseline FEV1 level. Emphysema progression however was less sensitive to the use of absolute versus relative metrics of progression. In general, the SE cluster had the highest risk for prospective adverse health events, though the AD cluster had the highest risk of incident diabetes and the most distinct gene expression patterns.
A wide array of risk factors have been associated with spirometric decline, such as low BMI, higher baseline FEV1 and FVC, smoking exposure, bronchodilator reversibility, African-American race, female sex, previous history of exacerbations, CT-quantified emphysema, upper lobe-predominant emphysema and small airway abnormalities.1 2 39–43 Whereas previous studies have shown that mild-to-moderate COPD (GOLD 1–2) is associated with an increased loss in absolute FEV1,2 39 our study also investigated changes in FEV1 relative to baseline values and found that the SE cluster, which represents a subset of subjects with advanced disease, is associated with more rapid relative FEV1 decline. To our knowledge, such differences in the metrics of progression used to assess COPD progression have not been previously reported. This finding emphasises the fact that disease activity and disease severity are distinct concepts that should be considered when assessing patients with COPD.1 44
In contrast to FEV1 changes, less is known about the factors that are associated with emphysema progression.45–47 In our study, we evaluated emphysema changes by COPD subtype, investigated both absolute and relative changes and adjusted the analysis for age, sex, race, BMI, smoking pack-years and CT scanner types. We showed that relative changes were the highest in the SE cluster, which has more advanced baseline emphysema, low BMI and more COPD exacerbations.
In regard to prospective COPD events, prior reports have indicated that more severe airflow obstruction and COPD exacerbation history are associated with higher risks of COPD exacerbations and CVD.11 18–20 We demonstrated that when adjusted for covariates including airflow limitation and COPD exacerbation history, the SE cluster had three times higher risk of a COPD exacerbation, while the AD and ULE clusters had an HR of ~1.35 relative to the RRS group. The SE cluster was also associated with the highest risk of incident CVD, which may be explained by atherosclerosis or arterial stiffness mediated by inflammatory markers.48 Another novel finding from our study was that the AD cluster had the highest risk for the prospective development of diabetes, even after adjusting for BMI. This adds to the finding from the study by Hersh et al, which revealed that COPD with limited emphysema and high airflow obstruction is associated with diabetes in cross-sectional data.21 Our study provides further evidence linking airway-predominant COPD to diabetes and metabolic syndrome.
The age, dyspnoea and airflow obstruction (ADO) and BODE indices have been classically used to predict mortality in COPD, but less is known about the COPD characteristics that contribute to cause-specific mortality.49 50 CVD, airflow obstruction, low BMI, emphysema and poor exercise capacity were found to be associated with a high risk of all-cause mortality in COPD.18 51–53 We similarly observed that the SE cluster, which had these risk factors at baseline, had the highest risk of all-cause mortality. With regards to the CVD mortality, high Modified Medical Research Council Dyspnea Scale dyspnoea score, exacerbation history, low FEV1 and accelerated lung function decline have been shown to be contributors.54 55 In our paper, we showed that the SE, AD and ULE clusters had elevated risks of CVD-related mortality in unadjusted models, but when correcting for age, sex, race, BODE and smoking pack-years, only the AD and ULE clusters had significant risks, which indicates that airway disease and lobular emphysema distribution may be additional contributors to this risk. While most previously published COPD studies have examined the association with prospective cancer rather than prospective mortality due to cancer, some reports have indicated that COPD is associated with an elevated risk of both lung and extrapulmonary cancer mortalities.56 57 In our study, similar to CVD mortality, the ULE, AD and SE clusters had elevated cancer mortality risks, but after adjustments, only the ULE cluster had a significantly increased cancer mortality risk. Differential genetic susceptibility, delayed clearance of inhaled carcinogens and chronic inflammation may be potential mechanisms underlying these associations.57
COPD subtype-specific associations to transcriptomic and protein biomarkers have only been studied in a few studies of relatively small size.25 Furthermore, although COPD inflammation has a clear histology description,58 the primary biological factors that are distinct to each COPD subtype are still not fully understood. At the transcriptomic level, COPD has been associated with inflammation and sphingolipid metabolism,22–24 and our study demonstrates that it is the AD subtype that has the most distinct gene expression signature that is enriched for these pathways. Airway inflammation is a major factor in the pathogenesis of COPD, according to a number of studies.59–61 The inflammatory response in COPD involves amplification of both the innate and adaptive immune systems.58 However, although COPD inflammation has a clear histology description,58 the primary biological factors that are distinct to each COPD subtype are still not fully understood. Our work builds on previously published studies by demonstrating that, specifically, the airway disease cluster has the largest enrichment for genes and pathways related to inflammation, and the severe emphysema cluster has the most significant enrichment for innate immunity-related pathways. Dysregulation of adipokine metabolism has also been widely implicated in COPD and emphysema pathophysiology.62–64 In our study, we add to the existing literature by showing that the AD cluster, in particular, has elevated leptin levels. While adiponectin possesses anti-inflammatory properties,65 leptin plays an important role in upregulating the inflammatory system.66
While misclassifying subjects into their respective cluster at baseline is a potential limitation of k-means subtyping, it is also important to consider the sensitivity, specificity and reproducibility of spirometry and CT scans. From the existing literature, the coefficient of variation associated with repetitive measurements of FEV1 in patients with obstructive lung disease was shown to be ~0.04%–0.3% over a wide range of FEV1.67 A meta-analysis by Li et al showed that the sensitivity and specificity of CT scan on lung density were 0.80 and 0.77.68 Additionally, using data from Shaker et al, the coefficient of variation of emphysema measurements on CT scans can be estimated at 3.7%.69
This study has a number of strengths. Compared with previous publications, our study included a larger sample size and longer follow-up and investigated incident comorbidities in addition to lung health outcomes. Additionally, we included a well-phenotyped cohort of smokers across the full spectrum of disease severity, and we were able to test the association of subtypes to clinical, radiological and multi-omic molecular markers. When studying progression, we considered both absolute and relative changes in lung function and CT-quantified emphysema. Furthermore, this is to our knowledge the first study demonstrating that airway-predominant COPD is independently associated with incident diabetes risk and has particularly strong associations to inflammatory biomarkers.
One of the limitations of our study is that because of its observational design, the statistical associations observed may not reflect causal relationships. Our study sample was limited to subjects who survived the 5-year observation period and as a result, our findings are not representative of subjects with very advanced COPD and limited life expectancy. Many of the participants in our study were already receiving treatment for their disease. The effect of pharmacotherapy on the proteome was described in the literature.70–74 Although it is not well-documented that specific pharmacotherapy impacts the course of the disease, these medications may have influenced our findings. However, medication use data in COPDGene are limited to self-report and do not include important information on adherence. As a result, we have not performed comprehensive adjustment for the various medications patients were using. The findings from our study are not yet ready for clinical applications. Nevertheless, they represent an important step towards identifying subtype-specific molecular signatures, which will open the door for later studies on treatments that target distinct patient subtypes and subtype-specific biological pathways. Analyses that jointly model death and other aspects of disease progression would provide additional useful information. As further follow-up data from COPDGene are obtained, our hypotheses from this study can be validated over longer follow-up.
Conclusions
COPD-related subtypes defined by spirometric and radiological measures at baseline have different rates of disease progression and are differentially associated with prospective health outcomes. They also exhibit distinct biomarker profiles indicative of underlying biological differences. In the future, these subtypes could be used as the basis for targeted drug development, studies of differential treatment response or the enrolment of specific subgroups in clinical trials.
Data availability statement
Data are available in a public, open access repository.
Ethics statements
Patient consent for publication
Ethics approval
This study involves human participants and was approved by Brigham and Women’s Hospital (2007P000554). Participants gave informed consent to participate in the study before taking part.
Acknowledgments
COPD Gene Investigators—Core Units: Administrative Center: James D Crapo, MD (PrincipaI Investigator (PI)); Edwin K Silverman, MD, PhD (PI); Barry J Make, MD; Elizabeth A Regan, MD, PhD. Genetic Analysis Center: Terri H Beaty, PhD; Peter J Castaldi, MD, MSc; Michael H Cho, MD, MPH; Dawn L DeMeo, MD, MPH; Adel Boueiz, MD, MMSc; Marilyn G Foreman, MD, MS; Auyon Ghosh, MD; Lystra P Hayden, MD, MMSc; Craig P Hersh, MD, MPH; Jacqueline Hetmanski, MS; Brian D Hobbs, MD, MMSc; John E Hokanson, MPH, PhD; Wonji Kim, PhD; Nan Laird, PhD; Christoph Lange, PhD; Sharon M Lutz, PhD; Merry-Lynn McDonald, PhD; Dmitry Prokopenko, PhD; Matthew Moll, MD, MPH; Jarrett Morrow, PhD; Dandi Qiao, PhD; Elizabeth A Regan, MD, PhD; Aabida Saferali, PhD; Phuwanat Sakornsakolpat, MD; Edwin K Silverman, MD, PhD; Emily S Wan, MD; Jeong Yun, MD, MPH. Imaging Center: Juan Pablo Centeno; Jean-Paul Charbonnier, PhD; Harvey O Coxson, PhD; Craig J Galban, PhD; MeiLan K Han, MD, MS; Eric A Hoffman, Stephen Humphries, PhD; Francine L Jacobson, MD, MPH; Philip F Judy, PhD; Ella A Kazerooni, MD; Alex Kluiber; David A Lynch, MB; Pietro Nardelli, PhD; John D Newell, Jr, MD; Aleena Notary; Andrea Oh, MD; Elizabeth A Regan, MD, PhD; James C Ross, PhD; Raul San Jose Estepar, PhD; Joyce Schroeder, MD; Jered Sieren; Berend C Stoel, PhD; Juerg Tschirren, PhD; Edwin Van Beek, MD, PhD; Bram van Ginneken, PhD; Eva van Rikxoort, PhD; Gonzalo Vegas Sanchez Ferrero, PhD; Lucas Veitel; George R Washko, MD; Carla G Wilson, MS. PFT QA Center, Salt Lake City, Utah: Robert Jensen, PhD. Data Coordinating Center and Biostatistics, National Jewish Health, Denver, Colorado: Douglas Everett, PhD; Jim Crooks, PhD; Katherine Pratte, PhD; Matt Strand, PhD; Carla G Wilson, MS. Epidemiology Core, University of Colorado Anschutz Medical Campus, Aurora, Colorado: John E Hokanson, MPH, PhD; Erin Austin, PhD; Gregory Kinney, MPH, PhD; Sharon M Lutz, PhD; Kendra A Young, PhD. Version Date: 26 March 2021. Mortality Adjudication Core: Surya P Bhatt, MD; Jessica Bon, MD; Alejandro A Diaz, MD, MPH; MeiLan K Han, MD, MS; Barry Make, MD; Susan Murray, ScD; Elizabeth Regan, MD; Xavier Soler, MD; Carla G Wilson, MS. Biomarker Core: Russell P Bowler, MD, PhD; Katerina Kechris, PhD; Farnoush BanaeiKashani, PhD. COPD Gene Investigators—Clinical Centers: Ann Arbor, Virginia: Jeffrey L Curtis, MD; Perry G Pernicano, MD. Baylor College of Medicine, Houston, Texas: Nicola Hanania, MD, MS; Mustafa Atik, MD; Aladin Boriek, PhD; Kalpatha Guntupalli, MD; Elizabeth Guy, MD; Amit Parulekar, MD. Brigham and Women’s Hospital, Boston, MA: Dawn L DeMeo, MD, MPH; Craig Hersh, MD, MPH; Francine L Jacobson, MD, MPH; George Washko, MD. Columbia University, New York City, New York: R Graham Barr, MD, DrPH; John Austin, MD; Belinda D’Souza, MD; Byron Thomashow, MD. Duke University Medical Center, Durham, North Carolina: Neil MacIntyre, Jr, MD; H Page McAdams, MD; Lacey Washington, MD. HealthPartners Research Institute, Minneapolis, Minnesota: Charlene McEvoy, MD, MPH; Joseph Tashjian, MD. Johns Hopkins University, Baltimore, MD: Robert Wise, MD; Robert Brown, MD; Nadia N Hansel, MD, MPH; Karen Horton, MD; Allison Lambert, MD, MHS; Nirupama Putcha, MD, MHS. Lundquist Institute for Biomedical Innovation at Harbor UCLA Medical Center, Torrance, California: Richard Casaburi, PhD, MD; Alessandra Adami, PhD; Matthew Budoff, MD; Hans Fischer, MD; Janos Porszasz, MD, PhD; Harry Rossiter, PhD; William Stringer, MD. Michael E DeBakey VAMC, Houston, Texas: Amir Sharafkhaneh, MD, PhD; Charlie Lan, DO. Minneapolis VA: Christine Wendt, MD; Brian Bell, MD; Ken M. Kunisaki, MD, MS. Morehouse School of Medicine, Atlanta, GA: Eric L Flenaugh, MD; Hirut Gebrekristos, PhD; Mario Ponce, MD; Silanath Terpenning, MD; Gloria Westney, MD, MS. National Jewish Health, Denver, Colorado: Russell Bowler, MD, PhD; David A Lynch, MB. Reliant Medical Group, Worcester, Massachusetts: Richard Rosiello, MD; David Pace, MD. Temple University, Philadelphia, PA: Gerard Criner, MD; David Ciccolella, MD; Francis Cordova, MD; Chandra Dass, MD; Gilbert D’Alonzo, DO; Parag Desai, MD; Michael Jacobs, PharmD; Steven Kelsen, MD, PhD; Victor Kim, MD; A James Mamary, MD; Nathaniel Marchetti, DO; Aditi Satti, MD; Kartik Shenoy, MD; Robert M Steiner, MD; Alex Swift, MD; Irene Swift, MD; Maria Elena Vega-Sanchez, MD. University of Alabama, Birmingham, Alabama; Mark Dransfield, MD; William Bailey, MD; Surya P Bhatt, MD; Anand Iyer, MD; Hrudaya Nath, MD; J Michael Wells, MD. University of California, San Diego, California: Douglas Conrad, MD; Xavier Soler, MD, PhD; Andrew Yen, MD. University of Iowa, Iowa City, Iowa: Alejandro P Comellas, MD; Karin F Hoth, PhD; John Newell, Jr, MD; Brad Thompson, MD. University of Michigan, Ann Arbor, Michigan: MeiLan K Han, MD MS; Ella Kazerooni, MD MS; Wassim Labaki, MD MS; Craig Galban, PhD; Dharshan Vummidi, MD. University of Minnesota, Minneapolis, Minnesota: Joanne Billings, MD; Abbie Begnaud, MD; Tadashi Allen, MD. University of Pittsburgh, Pittsburgh, Pennsylvania: Frank Sciurba, MD; Jessica Bon, MD; Divay Chandra, MD, MSc; Joel Weissfeld, MD, MPH. University of Texas Health, San Antonio, San Antonio, Texas: Antonio Anzueto, MD; Sandra Adams, MD; Diego Maselli-Caceres, MD; Mario E Ruiz, MD; Harjinder Singh.
References
Supplementary materials
Supplementary Data
This web only file has been produced by the BMJ Publishing Group from an electronic file supplied by the author(s) and has not been edited for content.
Footnotes
PJC and AB contributed equally.
Contributors AB and PJC had full access to all the data in the study, take responsibility for the integrity of the data and the accuracy of the data analysis, had authority over manuscript preparation and the decision to submit the manuscript for publication. AB and PJC accept full responsibility for the work and/or the conduct of the study, had access to the data, and controlled the decision to publish. Study concept and design: AG, AB, PJC. Acquisition, analysis or interpretation of data: All authors. Drafting of the manuscript: AG, AB, PJC. Critical revision of the manuscript for important intellectual content: All authors. Statistical analysis: AG, ZX, PJC, AB. Obtained funding: AB, PJC, ES. Study supervision: All authors. All authors gave final approval of the version to be published.
Funding This work was supported by NHLBI K08 HL141601, K08 HL146972, R01 HL116931, R01 HL124233, R01 HL126596, R01 HL116473, U01 HL089897, R01 HL147326, R01 HL130512 and U01 HL089856. The COPDGene study (NCT00608764) is also supported by the COPD Foundation through contributions made to an Industry Advisory Committee comprising AstraZeneca, Bayer, Boehringer-Ingelheim, Genentech, GlaxoSmithKline, Novartis, Pfizer, Siemens and Sunovion.
Competing interests None declared.
Patient and public involvement Patients and/or the public were not involved in the design, conduct, reporting or dissemination plans of this research.
Provenance and peer review Not commissioned; externally peer reviewed.
Supplemental material This content has been supplied by the author(s). It has not been vetted by BMJ Publishing Group Limited (BMJ) and may not have been peer-reviewed. Any opinions or recommendations discussed are solely those of the author(s) and are not endorsed by BMJ. BMJ disclaims all liability and responsibility arising from any reliance placed on the content. Where the content includes any translated material, BMJ does not warrant the accuracy and reliability of the translations (including but not limited to local regulations, clinical guidelines, terminology, drug names and drug dosages), and is not responsible for any error and/or omissions arising from translation and adaptation or otherwise.