Article Text

Abstract
Background and objective Obesity and asthma impose a heavy health and economic burden on millions of people around the world. The complex interaction between genetic traits and phenotypes caused the mechanism between obesity and asthma is still vague. This study investigates the relationship among obesity-related polygenic risk score (PRS), obesity phenotypes and the risk of having asthma.
Methods This is a matched case–control study, with 4 controls (8288 non-asthmatic) for each case (2072 asthmatic). Data were obtained from the 2008–2015 Taiwan Biobank Database and linked to the 2000–2016 National Health Insurance Research Database. All participants were ≥30 years old with no history of cancer and had a complete questionnaire, as well as physical examination, genome-wide single nucleotide polymorphisms and clinical diagnosis data. Environmental exposure, PM2.5, was also considered. Multivariate adjusted ORs and 95% CIs were calculated using conditional logistic regression stratified by age and sex. Mediation analysis was also assessed, using a generalised linear model.
Results We found that the obese phenotype was associated with significantly increased odds of asthma by approximately 26%. Four obesity-related PRS, including body mass index (OR=1.07 (1.01–1.13)), waist circumference (OR=1.10 (1.04–1.17)), central obesity as defined by waist-to-height ratio (OR=1.09 (1.03–1.15)) and general–central obesity (OR=1.06 (1.00–1.12)), were associated with increased odds of asthma. Additional independent risk factors for asthma included lower educational level, family history of asthma, certain chronic diseases and increased PM2.5 exposure. Obesity-related PRS is an indirect risk factor for asthma, the link being fully mediated by the trait of obesity.
Conclusions Obese phenotypes and obesity-related PRS are independent risk factors for having asthma in adults in the Taiwan Biobank. Overall, genetic risk for obesity increases the risk of asthma by affecting the obese phenotype.
- Asthma
- Asthma Genetics
- Asthma Epidemiology
- Clinical Epidemiology
Data availability statement
Data may be obtained from a third party and are not publicly available. The data that support the findings of this study are available from the Taiwan Biobank and Ministry of Health and Welfare, Taiwan, but restrictions apply to the availability of these data, which were under approval for the current study and so are not publicly available. The linked data set used in this study had to be analysed in person in the Health and Welfare Data Science Center, Ministry of Health and Welfare, Taiwan.
This is an open access article distributed in accordance with the Creative Commons Attribution Non Commercial (CC BY-NC 4.0) license, which permits others to distribute, remix, adapt, build upon this work non-commercially, and license their derivative works on different terms, provided the original work is properly cited, appropriate credit is given, any changes made indicated, and the use is non-commercial. See: http://creativecommons.org/licenses/by-nc/4.0/.
Statistics from Altmetric.com
WHAT IS ALREADY KNOWN ON THIS TOPIC
Previous epidemiological studies have shown that obesity is associated with a higher risk of asthma and poor asthma control.
WHAT THIS STUDY ADDS
This study used the integrated cohort database with phenotypes, genetic and morbidity data to elucidate the relationship among obesity-related polygenic risk score, obesity traits and asthma risk.
HOW THIS STUDY MIGHT AFFECT RESEARCH, PRACTICE OR POLICY
Our findings may lead to practical advice for reducing the risk of asthma in individuals with a higher genetic susceptibility for obesity.
Introduction
Asthma and obesity impose a heavy health and economic burden on billions of people around the world.1–3 In recent decades, a considerable body of epidemiological studies have shown that obesity is associated with a higher risk of asthma and poor asthma control, and suggest that obesity precedes asthma.4–6 The mechanism linking obesity and asthma is not clear, but systematic inflammation, a mechanical effect and genetic factors are possible explanations for the association.7 8 One previous study from one large retrospective cohort also found obesity is significantly associated with decreased lung function in asthmatics, but the effect of genetic factors is not considered.9
Obesity and asthma are highly heritable traits that share genetic variants, leading to coexistence within the same person.10 11 Exploring the pleiotropy of genetic variants of obesity and asthma can not only better clarify the link between obesity and asthma, but is also beneficial to reduce the risk of incident asthma and improve the poor prognosis of asthma patients with obesity. Previous studies exploring the association between obesity-related genetic variants and asthma have reported several common characteristics. First, the candidate gene approach is the most common method for selecting single-nucleotide polymorphisms (SNPs). Limited research has assessed the obesity-related polygenic risk score (PRS) to explore its association with asthma risk; moreover, this approach has not been reported for Asian adults.12 Second, most studies have focused on children,13–15 and few have assessed adult participants, who might be affected by genetic traces and obesity phenotypes. Third, most studies have not addressed the impact of multiple confounders on the results, especially objective disease histories.16 Fortunately, the linkage between the Taiwan Biobank (TWB) and National Health Insurance Research Database (NHIRD) provides us with a unique opportunity to perform genome-wide association study (GWAS) analysis of asthma and the three obesity indicators—body mass index (BMI), waist circumference (WC) and waist-to-height ratio (WHtR). The linked data enabled us to explore the association between genetic variants for obesity-related traits and asthma risk in adults at three levels—SNPs, genes and overall genetic risk (PRS). Additionally, since we integrated data from the micro to macro level including the health behaviours questionnaire, physical examination, genome-wide SNPs, clinical diagnosis data and PM2.5 exposure data, we were able to explore the relationship among obesity-related genetic variants, obesity traits and asthma risk and adjust multiple confounders simultaneously.
There are two aims of the study. The first is to elucidate the relationship among obesity-related PRS, obesity phenotypes and the risk of having asthma via multivariable analysis, interaction tests and mediation analyses. The second aim is to identify what obesity-related SNPs affect the risk of having asthma and explain the role of these SNPs in biological pathways to explore the pathogenesis of asthma.
Methods
Patient and public involvement
This study obtained secondhand data; participants did not receive feedback on the results and were not involved in the study.
Data source
This is a matched case–control study. Participants’ phenotypic and genotype data were from the TWB database,17 and the data of asthma and other disease diagnoses were collected from the NHIRD between 2000 and 2016.18 19 Two data sets were linked using encrypted personal identification numbers through the Health and Welfare Data Science Center, Ministry of Health and Welfare. In accordance with the year and month of enrolment, the 2-year average PM2.5 concentration of each participant’s residential area was identified. Annual PM2.5 values were determined using a two-step spatiotemporal prediction model that included 76 air quality monitoring sites and 1882 Airbox microsensors. The detailed computation method was presented in another study.20
Participants
The study participants consisted of volunteers who were between 30 and 70 years of age with no history of cancer and were recruited from 2008 to 2015 into the TWB. The flowchart of study participants is shown in figure 1. Of the 24 000 participants, we excluded those persons were living on offshore islands (n=108), those for whom health behaviours data was unavailable (n=23) or the genetic data did not meet quality control (QC) standards (n=2957).
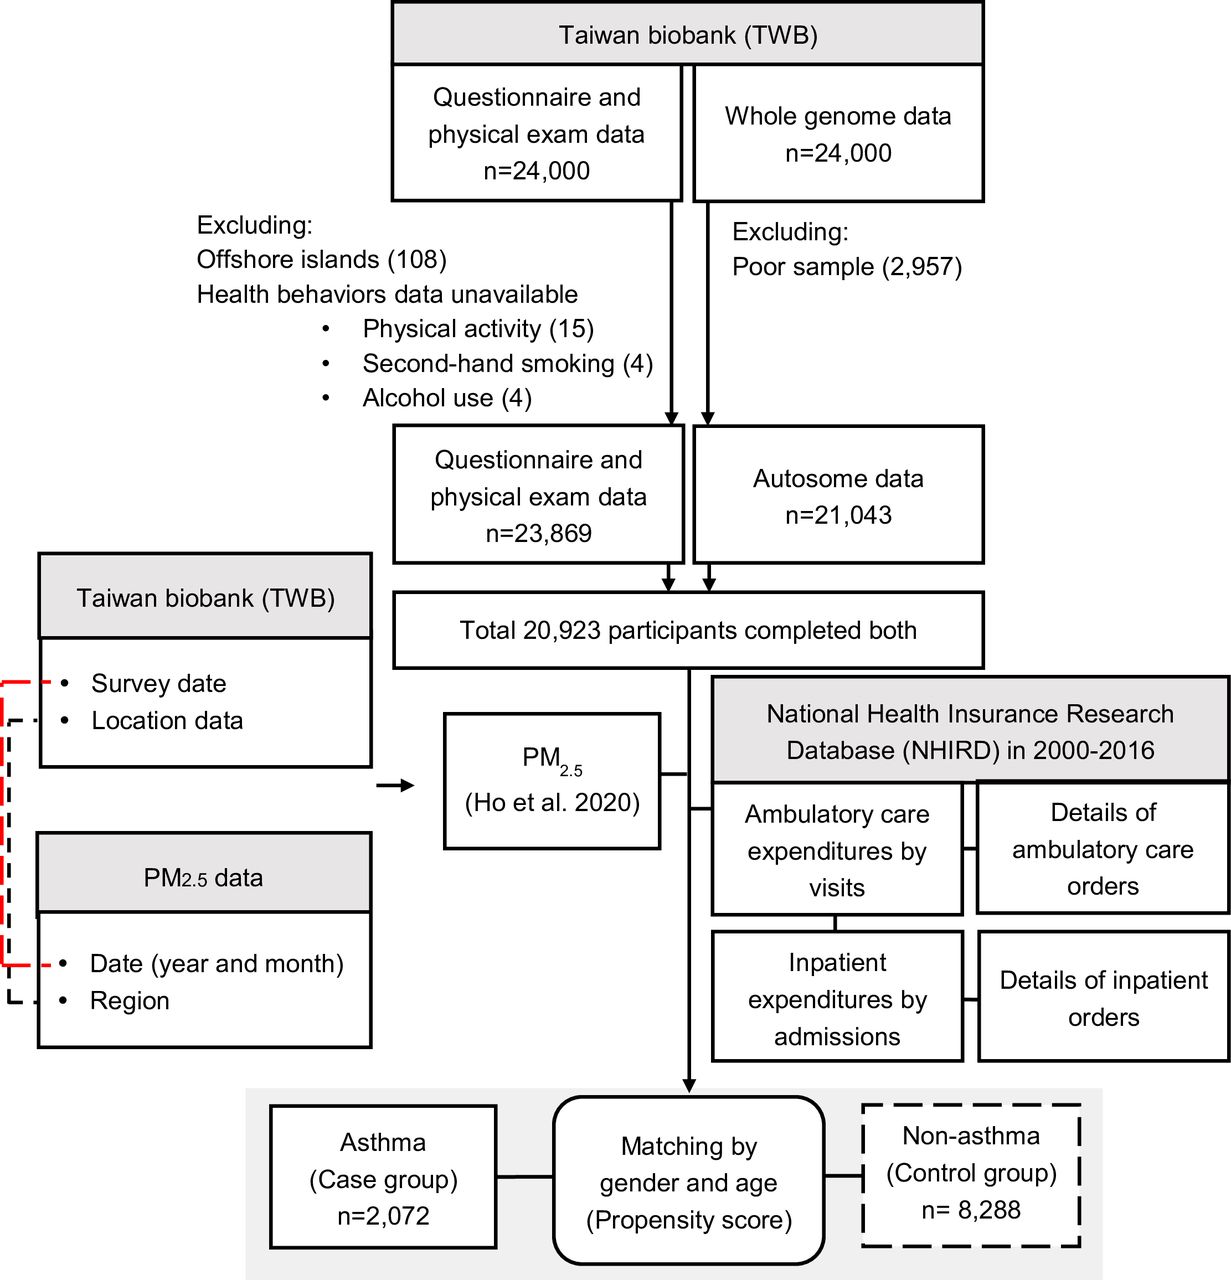
Participant flow chart.
Whole-genome genotyping analysis was performed using a customised Axiom‐Taiwan Biobank Array Plate (TWB chip: Affymetrix, Santa Clara, California, USA).21 The QC criteria for samples were as follows: genotype call rate (GCR)≥0.95, average heterozygosity within three SD of the mean, no chromosomal aberrations, identity by descent≤0.1875 and no divergent ancestry. The following criteria were used to determine the quality of SNPs: GCR≥0.95, minor allele frequency≥0.01 and Hardy-Weinberg equilibrium p≥8.185999e−08. All QC analyses were conducted using the PLINK V.1.9 (https://www.cog-genomics.org/plink/1.9/).22 A total of 21 043 participants and 606 086 autosomal SNPs met the QC standards. A QC flowchart is presented in figure 2.

Quality control flow chart. GCR, genotype call rate; HWE, Hardy-Weinberg equilibrium; IBD, identity by descent; MAF, minor allele frequency; QC, quality control; SNPs, single-nucleotide polymorphisms.
Participants diagnosed with asthma (ICD-9-CM/ ICD-10-CM code 493/J45) at least two times within a 1-year period between 2000 and 2016 were included in the case group. By contrast, participants without asthma formed the control group. Propensity score matching of asthmatics versus non-asthmatics was generated by 1:4 matching with age and sex. A total of 10 360 participants (asthma 2072; non-asthma 8288) were included in the analysis.
Obesity indicators
BMI, WC and WHtR from the TWB data were indicators for defining obesity in our study. BMI is a value calculated by height and weight and was stratified into four categories: underweight (<18.5 kg/m2), normal (18.5≤BMI<24 kg/m2), overweight (24≤BMI<27 kg/m2) and obese (≥27 kg/m2).23 WC≥90 cm for men and ≥80 cm for women means central obesity.23 WHtR is defined as WC divided by height, and the cut-off point for central obesity is 0.5.24
GWAS analysis
We used PLINK V.1.9 to conduct association tests. Quantitative traits (obesity indicators) and the disease trait (asthma) were analysed with linear and logistic regression under the additive, dominant and recessive genetic models and both were adjusted for age, sex and 18 ancestry principal components used to control for population stratification.25 The scree plot (online supplemental figure S1) of principal components analysis was drawn by R software V.3.6.3 (R Core Team, Vienna). Most studies only consider additive genetic effects, but testing different genetic effects in meta-analysis may help to detect less common genetic variants.26 We combined the results of three genetic models by fixed-effect meta-analysis, and the heterogeneity was evaluated according to Cochrane’s Q test.
Supplemental material
Analysis of obesity-related SNPs and asthma
We examined the association between obesity-related SNPs and the risk of asthma using logistic regression with adjustment for age and sex under three genetic models (PLINK V.1.9).27 To identify the genetic components shared between asthma and obesity, we used the R software’s CUMP package to identify pleiotropic SNPs.28 The information of SNPs was obtained from the SNP database (dbSNP, GRCH 37.p13: https://www.ncbi.nlm.nih.gov/snp) of the National Center for Biotechnology Information and the Taiwan Biobank V.3 (https://taiwanview.twbiobank.org.tw/index). Additionally, the expression quantitative trait loci information, a method to identify the effect of genetic variation on gene expression across human tissue (p value<10−4), was obtained from the Genotype-Tissue Expression (GTEx) portal database (https://www.gtexportal.org/home/).29
Over-representation enrichment analysis
To determine the biological pathways involved in obesity-related SNPs that are associated with asthma risk, we used the WebGestalt tool (http://www.webgestalt.org/) to assess gene ontology (GO) biological process functional and biological pathways (KEGG, Panther, Reactome and WikiPathways) with a significance threshold of 0.05.30
Polygenic risk score (PRS)
Polygenetic risk score (PRS), a method to calculate the effect of many genetic variants on an individual’s phenotype, is widely used to identify and predict an individual’s trait or disease risk31 32 and to study genetic pleiotropy between diseases or/and traits.33 A linkage disequilibrium (LD)‐based clumping procedure (R2 cut-off of 0.05 within a 500 kb window) was applied to the GWAS results to determine the most significant SNPs (p value<5×10⁻⁸) that were independent of each other. Then, PRS were calculated using the score procedure. A PRS was constructed for each individual by weighted sum of the number of allele 1 (usually minor) carried, by using the effect size: log (OR) for binary traits, or the beta coefficient for continuous traits. PRSs were standardised to mean=0 and SD=1 for the analysis. The procedure of clumping and score calculation was implemented in PLINK V.1.9.
Statistical analysis
Continuous and categorical variables are expressed as mean±SD and percentage, respectively. A conditional logistic regression was stratified by age and sex, and was used to analyse the association between obesity and asthma. We selected common sociodemographic variables and risk factors for asthma as covariates and used the stepwise regression method (selection criterion: α=0.10) to determine the covariates in the model. The model was checked by the 10% change-in-estimate method.34 Estimates of the receiver operating characteristic (ROC) curve were used for the area under the ROC curve (AUC) to evaluate the accuracy of predicting the risk of asthma. A generalised linear model with binary and normal distribution was used for mediation analysis to explore the relationship between PRS of obesity indictors (independent variable), obesity indictors (mediator) and asthma (dependent variable). The same covariates were adjusted for all models: PRS of asthma, education, at least one parent has (or had) asthma, at least one sibling has (or had) asthma, chronic obstructive pulmonary disease (COPD), depression, gastro-oesophageal reflux disease (GERD), hypertension and PM2.5. All analyses were performed by SAS V.9.4 (SAS Institute, Cary, North Carolina, USA) and drawn by R software V.3.6.3 (R Core Team, Vienna). A p value less than 0.05 indicates statistical significance.
Results
Baseline characteristics of the enrolled population
This case–control study included 10 360 participants, including 2072 asthma patients and 8288 non-asthmatic controls. The characteristics of the asthma and non-asthma groups are summarised in table 1. The prevalence of obesity calculated by BMI (25.1% vs 19.3%), WC (48.8% vs 40.6%) and WHtR (65.1% vs 56.7%) was significantly different between the groups. Moreover, compared with the non-asthmatic group, the asthma group had significantly higher proportions of low education (primary and below:9.17% vs 5.88%; junior/senior high school:40.1% vs 37.9%), light-intensity physical activity (77.9% vs 75.2%) and various medical histories, including hypertension (33.3% vs 25.0%), diabetes (20.0% vs 15.2%), hyperlipidaemia (16.1% vs 10.4%), COPD (28.9% vs 7.34%), depression (16.1% vs 10.4%) and GERD (8.93% vs 4.44%) and had significantly higher PM2.5 exposure (24.3±11.1 vs 21.9±9.85 μg/m3).
Characteristics of asthma and non-asthma participants in adults at 30–70 years, Taiwan Biobank
Obesity-related SNPs and their overlap with asthma-related SNPs
The meta-analysis identified 234 SNPs that met the p<5×10⁻⁸ threshold for genome-wide significance associated with BMI, 236 that were associated with WC and 263 that were associated with WHtR (online supplemental tables S1–S3). Overall, 32 BMI-related, 24 WC-related and 33 WHtR-related SNPs were associated with asthma (online supplemental table S4). We used cross-phenotypic association analyses to identify the loci shared between asthma and obesity. Among the obesity-related SNPs associated with an increased risk of asthma, we identified 41 SNPs shared by asthma and obesity. Of these, 13 SNPs contained information from the GTEx portal database (online supplemental table S5). These involved 15 genes, including MBL2, PIAS1 and HPSE2, which are expressed across various human tissues (online supplemental figure S2). In the over-representation enrichment analysis, we identified several possible biological pathways for the genes shared between asthma and obesity. For instance, MBL2 gene is involved in the complement cascade of innate immunity. PIAS1 plays a role in both interferon signalling, including the regulation of interferon-gamma (IFN-γ) signalling, JAK/STAT signalling pathway and IFN-γ signalling pathway in the immune system, and the transcriptional regulation of transcription factors (SUMOylation). HPSE2 is involved in glycosaminoglycan (heparin sulfate/heparin, HS-GAG) degradation. The top 10 GO terms and pathways are shown in online supplemental figures S3 and S4, respectively.
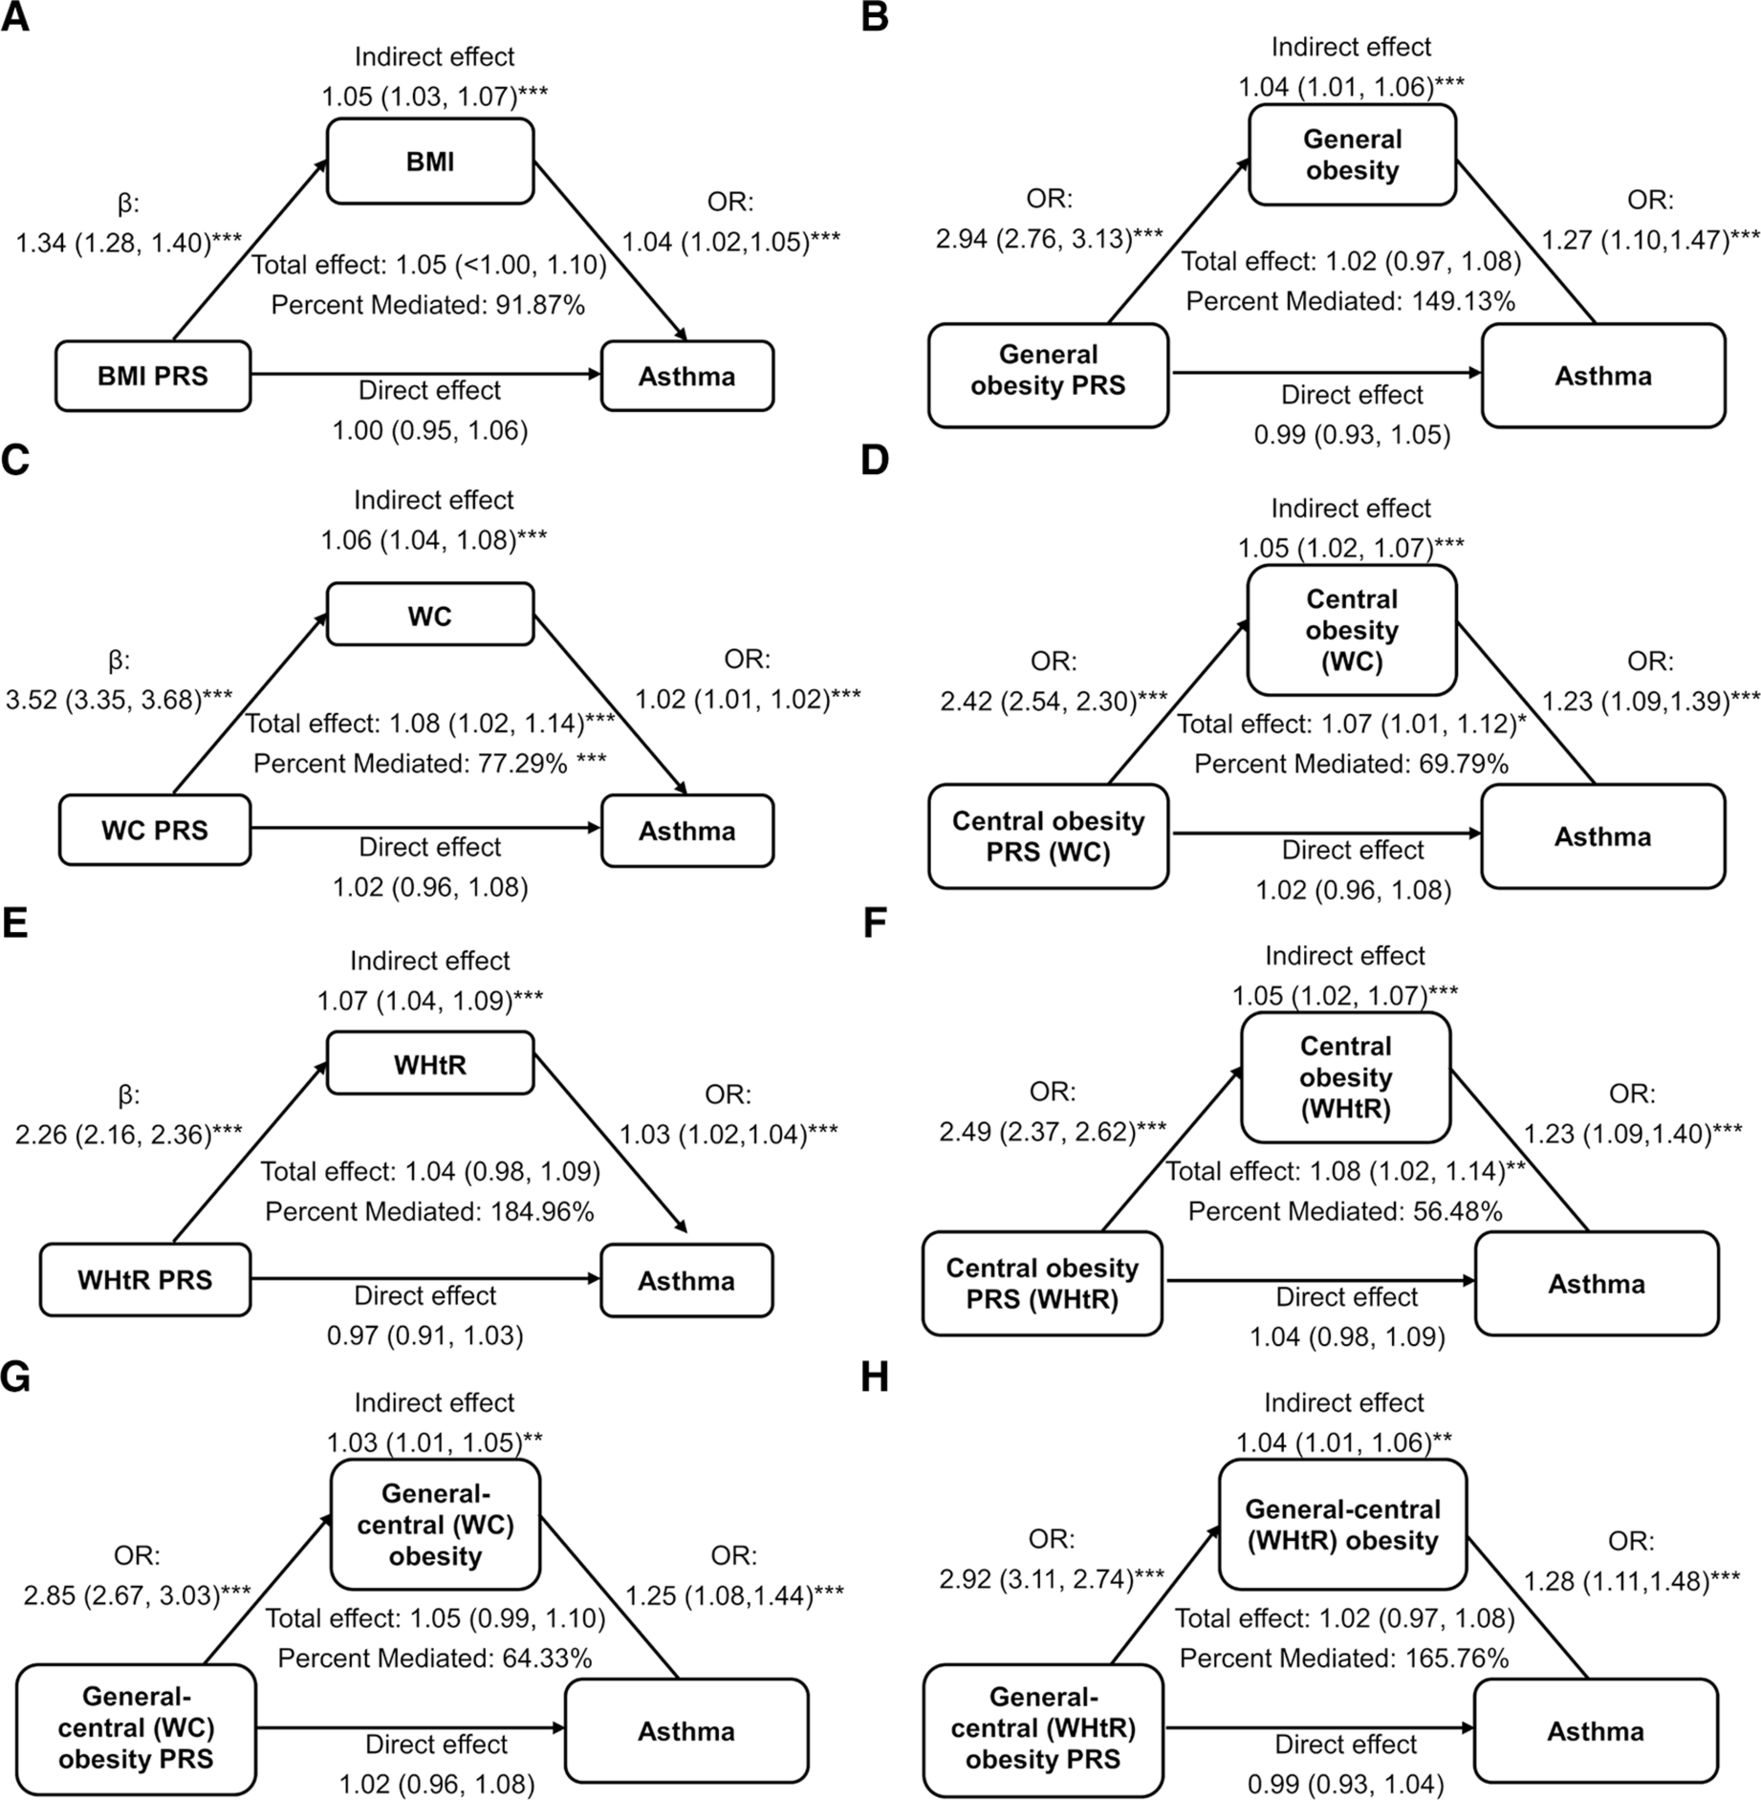
Mediation analysis using generalised linear models with binary and normal distribution of obesity-related PRS, obesity trait and asthma. Adjusted for age, sex, PRS of asthma, education, one of the parents has asthma, one of the siblings has asthma, chronic obstructive pulmonary disease, depression, gastro-oesophageal reflux disease, hypertension and PM2.5. ***p value <0.001. BMI, body mass index; PRS, polygenic risk score; WC, waist circumference; WHtR, waist-to-height ratio.
Asthma and obesity PRS
The PRS for asthma, BMI, WC and WHtR were calculated using 80 asthma-related SNPs (online supplemental table S6), 140 BMI-related SNPs (online supplemental table S7), 132 WC-related SNPs (online supplemental table S8) and 148 WHtR-related SNPs (online supplemental table S9), respectively. The mean PRS of asthma (0.63±0.95 vs −0.16±0.95), PRS of BMI (0.08±1.02 vs −0.02±1.00), PRS of WC (0.10±1.01 vs −0.02±1.00) and PRS of WHtR (0.07±1.00 vs −0.02±1.00) were significantly different between asthma patients and non-asthmatic controls (table 2). The ability of the PRS of asthma, BMI, WC and WHtR to predict asthma was evaluated using ROC curves, as shown in online supplemental figure S5.
Asthma-related and obesity-related PRS in asthma and non-asthma participants among adults aged 30–70 years, Taiwan Biobank
In addition to the obesity indicator PRS, we were also interested in obesity PRS; consequently, we further used discrete criteria to determine PRS for obesity. Obesity PRS includes general obesity PRS (BMI≥27 kg/m2), central obesity PRS (WC≥80 cm in women or ≥90 cm in men; WHtR≥0.05) and obesity PRS meeting both criteria for obesity. A comparison of this PRS between the two groups is presented in table 2, and online supplemental figure S6 shows the results of the ROC curve analysis for the accuracy of predicting asthma. The accuracies of the five obesity PRS in predicting asthma were comparable to those of the three obesity-indicator PRS.
Genetic variants, obesity traits and asthma
The covariate-adjusted conditional logistic regression model that identified the obese phenotype and obese-related PRS as risk factors for asthma is presented in table 3. In model 1, both general obesity (OR of BMI=1.32, 95% CI=1.14 to 1.52, p<0.001) and central obesity (OR of WC=1.26, 95% CI=1.12 to 1.41; OR of WHtR=1.27, 95% CI=1.13 to 1.44; p all<0.001) indicated significantly higher odds of asthma. In model 2, a one-standardised score increase in PRS of BMI and PRS of WC significantly increased the odds of asthma by 7% (95% CI=1.01 to 1.13, p=0.020) and 10% (1.04 to 1.17, p<0.001), respectively. A one-standardised score increase in PRS of WHtR increased the odds of asthma by 5% (0.99 to 1.11, p=0.103), but this increase was not statistically significant. However, when we used WHtR (0.5 as the cut-off point) to define central obesity, a one-standard-score increase in the PRS of central obesity significantly increased the odds of asthma by 9% (1.03 to 1.15, p=0.003). There was no significant interaction effect for obesity-related PRS×asthma PRS (not shown here). Additionally, lower education level, family history of asthma, disease history of COPD, history of depression, history of GERD, history of hypertension and increased PM2.5 are also independent risk factors for asthma. The details of the model for each indicator are shown in online supplemental tables S10 to S16. In the covariate-adjusted ROC curve, the AUC for predicting asthma was 0.82 (online supplemental figures S7–S9).
Associations between obesity and asthma in adults aged 30–70 years, Taiwan Biobank
We examined the relationship between the traits of obesity indicators, obesity-related PRS and asthma, as shown in figure 3. Obesity-related PRS is an indirect risk factor for asthma, with the link being fully mediated by traits of obesity. The indirect effects of BMI, WC and WHtR were 1.05 (1.03–1.07), 1.06 (1.04–1.08) and 1.07 (1.04–1.09), respectively. The indirect effects of general, central and general–central obesity were 1.04 (1.01–1.06), 1.05 (1.02–1.07) and 1.04 (1.01–1.06), respectively.
Discussion
We used the GWAS approach to scan the genomes from Taiwan adults to look for obesity-related and asthma-related SNPs and summarised multiple effects to estimate the PRS of obesity and asthma. As far as we know, no studies have found a relationship among obesity-related PRS, obesity traits and asthma risk by mediation analyses. Through a clinical or public health lens, identifying genetic variants related to both obesity and asthma might provide opportunities for preventing or treating asthma and obesity simultaneously, and establishment of a prediction model could be useful for disease management.
Several epidemiological and genetic studies have suggested that obesity is a risk factor for asthma. For example, Beuther and Sutherland performed a meta-analysis of prospective epidemiologic studies and found a dose–response relationship between body weight and asthma in adults.35 Bidirectional Mendelian randomisation studies in European adult suggested that BMI is causal factor in asthma, particularly in later-onset and non-atopic asthma.36 37 Our findings are similar to these observations, and our ROC analysis also suggested that obesity and obesity-related PRS have excellent discrimination in predicting asthma. Nevertheless, this finding requires further confirmation in a different cohort.
Using over-enrichment analysis, we also identified potential immunological mechanisms for the association between obesity and asthma. The MBL2 gene, regulated by rs11003136, involves the lectin pathway of complement activation. Complement is an ancient danger-sensing component of the innate immune system, which is activated through three independent pathways—the classical pathway, the alternative pathway and the lectin pathway. The low-molecular-weight anaphylactic toxins (AT) C3a and C5a produced during complement activation have many important proinflammatory and immunomodulatory properties, and regulate the development of Th2 immunity during allergen sensitisation.38 It is well known that the immune mechanism of asthma is predominantly mediated by Th2 cells. MBL is a component of the lectin pathway, and its concentration is regulated by a polymorphism in the promoter region of the MBL2 gene. Aittoniemi et al have demonstrated that carriage of −221 base pair promoter region variants (G>C) caused low MBL expression and increased the risk of asthma in the Finnish population.39 Our results found that allele T of rs11003136 was associated with increased asthma risk (OR (95% CI) of additive model=1.093 (1.015, 1.177); OR (95% CI) of recessive model=1.184 (1.005, 1.395)). The PIAS1 gene, which is regulated by rs4776990, is involved in both IFN signalling (IFN-γ signalling pathway, JAK/STAT signalling pathway and regulation of IFN-γ signalling) in the immune system and the SUMOylation of transcription factor pathways. IFN-γ, a Th1 cytokine primarily generated by natural killer and activated T cells, is crucial for the induction and regulation of a range of immune responses. Studies have reported that severe asthma is associated with higher IFN-γ levels.40 The cellular responses to IFN‐γ are mediated by the IFN-γ receptor (IFNGR), which comprises two chains. Both IFNGR chains lack intrinsic kinase/phosphatase activity and thus rely on JAK1, JAK2 and STAT1 for signal transduction to regulate gene expression, thereby mediating the biological functions of IFN-γ.41 42 Protein inhibitors of activated STATs (PIAS) are a class of negative regulators that affect IFN-γ signalling by inhibiting various steps in the IFN-γ cascade.42 O'Connell et al suggested that the IFN-γ-induced JAK/STAT-associated signalling pathway is insensitive to glucocorticoid action, an insensitivity that is reversed by STAT1 inhibition.43 PIAS1 is a negative regulator of STAT1. It blocks STAT1 from interacting with DNA and inhibits STAT1-mediated gene activation in response to interferons.44 SUMOylation is an important post-translational mechanism that affects transcriptional regulation by altering transcription factors and chromatin structures. SUMO3 and SUMO E3 ligase PIAS1 may mediate the crosstalk mechanism between androgen receptor SUMOylation and ubiquitination to modulate the androgen receptor cellular distribution and stability.45 Androgen receptor signalling stabilises Treg suppressive function to reduce allergen-induced type II airway inflammation and airway hyper-responsiveness.46 HPSE2 is regulated by rs10883230 and involves the HS- GAG degradation pathway. Increased extracellular matrix deposition in the airway wall is characteristic of airway remodelling. HS is a linear GAG that functions as an HS proteoglycan (HSPG). Ge et al demonstrated in a mouse model that HSPG influences the development of airway remodelling during chronic allergic asthma by promoting the recruitment of inflammatory cells and regulating the expression of proremodelling factors in the lung.47 Our results suggest that the AA/GA genotype of rs10883230, which regulates HPSE2, is associated with an increased asthma risk by 12%. Additionally, we found that five SNPs are involved in ALCAM gene expression and associated with asthma risk. ALCAM is a transmembrane protein highly expressed in dendritic cells. It combines with CD6, a receptor on T-cells, to form an immune synapse, mediating the activation and differentiation of T cells to regulate the immune response. There is evidence that ALCAM promotes the development of allergic asthma by stimulating T helper cell type 2 immune response.48 The ALCAM–CD6 pathway is a target for severe asthma.49 Our results reported that minor alleles of four SNPs (rs28588542-T, rs9857705-C, rs6769329-C and rs2399047-T) were associated with an 8% increase in asthma risk.
In addition to immunological mechanisms, a mechanical effect in which obesity narrows the airways and affects airway closure and hyper-responsiveness is a well-known explanation for the relationship between obesity and asthma. Abdominal and thoracic fat are more likely to contribute to lung function impairment than general obesity is, which is independent of the fat distribution. This is because they directly affect the mechanical expansion of the chest wall and diaphragm during forced inspiration.8 A recent study in a Chinese population identified a strong negative genetic correlation between central obesity and lung function.50 Our study also found that WC and WHtR (indicators of central obesity) are genetic mediators of asthma.
However, our results should be interpreted with caution due to the following limitations. First, the cross-sectional survey data cannot be used to infer a causal or temporal relationship between obesity and asthma. Several studies have confirmed that obesity may predispose individuals to asthma, but as our study design is not prospective, we should interpret results cautiously when exploring the association and mediated effect. Second, only adults who are 30–70 years old without a history of cancer were recruited in the TWB, so our results should not be extrapolated to all populations in Taiwan. Third, we do not control all factors related to obesity and asthma due to the limitations of the secondhand data. Forth, owing to their distinctive genetic backgrounds,51 obesity may have heterogeneous effects on different subtypes of asthma. However, we lacked the diagnosis of asthma subtypes, which prevented us from further exploring the relationship between obesity and different asthma subtypes. Additionally, we generated obesity and asthma PRS using the traditional PRS methods. Because LD is not considered in traditional PRS approaches, their predictive value is restricted. Adopting advanced PRS approaches, such LDpred,52–54 will be beneficial in future analyses to address the LD structural problem and improve power.
In conclusion, we found that adults with obesity have a significantly higher risk of asthma, and observed a significant positive relationship between the overall genetic risk for obesity and the risk of asthma. Furthermore, overall genetic risk for obesity increases the risk of asthma by affecting the obese phenotype.
Data availability statement
Data may be obtained from a third party and are not publicly available. The data that support the findings of this study are available from the Taiwan Biobank and Ministry of Health and Welfare, Taiwan, but restrictions apply to the availability of these data, which were under approval for the current study and so are not publicly available. The linked data set used in this study had to be analysed in person in the Health and Welfare Data Science Center, Ministry of Health and Welfare, Taiwan.
Ethics statements
Patient consent for publication
Ethics approval
This study involves human participants. This study was approved by the institutional review board (IRB) on Biomedical Science Research, Academia Sinica (AS-IRB01-17049). All data from human participants were obtained from the Taiwan Biobank database and National Health Insurance Research Database database, for which data sharing and data linkage were parts of the consent, so a waiver of consent was granted by the Academia Sinica IRB.This study obtained secondhand data; participants did not receive feedback on the results and were not involved in the study.
Acknowledgments
We are grateful to the Health and Welfare Data Science Center, Ministry of Health and Welfare for providing administrative and technical support.
References
Supplementary materials
Footnotes
Contributors T-CC, H-LH and J-SH designed the study. Y-JH and Y-CC reviewed the literature, refined the data and performed statistical analysis and wrote the draft of the manuscript. C-WC helped on preparing genetic data and quality control. H-CY, J-SH and C-HC provided statistical consulting and helped interpret the results. H-LH provided clinical suggestions and helped interpret the results. T-CC, H-LH and J-SH helped edit the manuscript. T-CC is the guarantor of the study. All authors have read and approved the final manuscript.
Funding This research was supported by a grant titled 'Obesity and asthma severity: Interactions among health behaviors, genetic polymorphism and environmental exposure' (grant number: AS-PH 109-01-2) from Academia Sinica. The funders had no role in study design, data collection and analysis, decision to publish or preparation of the manuscript.
Competing interests None declared.
Patient and public involvement Patients and/or the public were not involved in the design, or conduct, or reporting, or dissemination plans of this research.
Provenance and peer review Not commissioned; externally peer reviewed.
Supplemental material This content has been supplied by the author(s). It has not been vetted by BMJ Publishing Group Limited (BMJ) and may not have been peer-reviewed. Any opinions or recommendations discussed are solely those of the author(s) and are not endorsed by BMJ. BMJ disclaims all liability and responsibility arising from any reliance placed on the content. Where the content includes any translated material, BMJ does not warrant the accuracy and reliability of the translations (including but not limited to local regulations, clinical guidelines, terminology, drug names and drug dosages), and is not responsible for any error and/or omissions arising from translation and adaptation or otherwise.