


Abstract
This paper describes the Observing Protein and Energy Nutrition (OPEN) Study, conducted from September 1999 to March 2000. The purpose of the study was to assess dietary measurement error using two self-reported dietary instruments—the food frequency questionnaire (FFQ) and the 24-hour dietary recall (24HR)—and unbiased biomarkers of energy and protein intakes: doubly labeled water and urinary nitrogen. Participants were 484 men and women aged 40–69 years from Montgomery County, Maryland. Nine percent of men and 7% of women were defined as underreporters of both energy and protein intake on 24HRs; for FFQs, the comparable values were 35% for men and 23% for women. On average, men underreported energy intake compared with total energy expenditure by 12–14% on 24HRs and 31–36% on FFQs and underreported protein intake compared with a protein biomarker by 11–12% on 24HRs and 30–34% on FFQs. Women underreported energy intake on 24HRs by 16–20% and on FFQs by 34–38% and underreported protein intake by 11–15% on 24HRs and 27–32% on FFQs. There was little underreporting of the percentage of energy from protein for men or women. These findings have important implications for nutritional epidemiology and dietary surveillance.
Received for publication January 7, 2002; accepted for publication December 3, 2002.
Editor’s note: A related article appears on page 14, an invited commentary on these two articles is published on page 22, and the authors’ response to the commentary is on page 25.
Nutritional epidemiologists and nutritionists routinely carry out research and surveillance activities that rely on self-reported dietary information from questionnaires and interviews. Although scientists have long recognized that this information contains error, considerable uncertainty remains about its qualitative and quantitative characteristics. Understanding this error is critical to interpreting findings from nutritional epidemiology and surveillance research efforts.
Many widely cited reports on diet and disease use data from food frequency questionnaires (FFQs). The FFQ, designed to measure a person’s usual dietary intake over a defined period of time, is relatively inexpensive and easy to administer and is the exposure assessment tool of choice for large-scale nutritional epidemiologic studies. Over the years, investigators have recognized that the reported values from FFQs are subject to substantial error, both systematic and random, that can profoundly affect the results of epidemiologic studies. Realization of this problem has prompted the integration in larger epidemiologic investigations of calibration substudies that involve a more expensive and time-consuming “reference” instrument, such as food records or multiple 24-hour dietary recalls (24HRs), the primary assessment tool for dietary surveillance (1). However, a number of studies that have used the few unbiased biomarkers of dietary intake that exist, such as doubly labeled water (DLW) for total energy expenditure and urinary nitrogen for protein intake, suggest significant bias generally in the direction of underreporting for FFQs, 24HRs, and food records (2–5). Such findings raise concerns about using these “reference” instruments to calibrate FFQs or measure population intakes.
The Observing Protein and Energy Nutrition (OPEN) Study assessed the structure of dietary measurement error in FFQs and 24HRs by using DLW and urinary nitrogen as biomarkers of total energy expenditure and protein intake, respectively. This paper describes the study design, methods, and findings of intakes as assessed by DLW, urinary nitrogen, FFQs, and 24HRs. The companion paper in this issue of the Journal (6) describes findings related to the impact of measurement error on nutritional epidemiology.
MATERIALS AND METHODS
Overview of recruitment and study design
A sample of 14,968 households with telephone numbers listed in the white pages of the directory and with a household member 40–69 years of age living in the Washington, DC, suburban area of Montgomery County, Maryland, was purchased from a commercial company. From September 1999 to March 2000, a random sample of 5,000 of these households was mailed letters notifying them of the study in advance of a telephone recruitment call. The goal was to recruit 500 men and women. Excluded were those who had diabetes, congestive heart failure, kidney failure requiring dialysis, fluid retention, malabsorption, hemophilia, or any condition requiring supplemental oxygen. Additional reasons for exclusion included not reading English well, being pregnant, being on a weight loss/liquid diet, and having formal nutrition training.
Data were collected by the company Westat at a clinic in Rockville, Maryland. Participants attended three visits, as described in figure 1. After the initial telephone contact and recruitment, participants were mailed an introductory letter and an FFQ to complete. If they agreed to do so, they were scheduled for a visit 1 appointment. They were instructed not to eat or drink 3 hours before the clinic visit. At visit 1, participants completed the informed consent, had their FFQs reviewed, and had their height and weight measured. A baseline spot urine specimen was obtained, followed by dosing with DLW. Participants remained in the clinic to provide spot urine specimens 2, 3, and 4 hours after DLW dosing. Participants aged ≥60 years also provided a blood specimen because of the possibility of delayed bladder emptying (7). During the 5–6 hours in the clinic, participants completed a Physical Activity Questionnaire (from the National Health and Nutrition Examination Survey, 1999–2000 (8)) and a structured 24HR and received instructions for collecting two 24-hour urine specimens. At the end of visit 1, participants received $50.
Visit 2 was scheduled 11–14 days after visit 1. Between these visits, at least 9 days apart, participants collected two 24-hour urine specimens. At visit 2, participants provided a fasting blood specimen (stored for future analyses), provided two spot urine specimens (1 hour apart) to complete the DLW protocol, and were weighed. Participants then completed a Health Questionnaire that included a dietary screener questionnaire, questions about smoking, the Fear of Negative Evaluation Scale (9), and Stunkard body image models (10) followed by three questions asking 1) how they perceived themselves, 2) which model was healthiest, and 3) which model they would most like to be. Participants received $50 for this 1.5-hour visit.
Visit 3 occurred approximately 3 months after visit 1. Before this visit, participants were mailed a second FFQ to complete and bring to the clinic. At this visit, participants’ weight was measured, they were administered a second 24HR, and they completed a Supplemental Questionnaire, consisting of the Three-Factor Eating Questionnaire (11), the Marlowe-Crowne Social Desirability Questionnaire (12–14), and questions about dieting/weight loss. Participants received $100 as a final payment.
Within the main study, a small substudy was conducted to determine the error variance in DLW. Fourteen men and 11 women in the main study agreed to be dosed with DLW a second time at visit 2 (visit 2A for substudy participants). As in visit 1, spot urine specimens were obtained at specified intervals. Substudy participants made an additional clinic visit (2B) approximately 2 weeks later to provide fasting blood specimens and two spot urine specimens. They were paid $75 for participating in the substudy.
This study was approved by the National Cancer Institute’s Special Studies Institutional Review Board.
24HR
The 24HR used in the OPEN Study was a standardized five-pass method, developed by the US Department of Agriculture (15) for use in national dietary surveillance. This method consists of 1) a “Quick List” pass in which the respondent is asked to list everything eaten or drunk the previous day; 2) a “Forgotten Foods” pass in which a standard list of food/beverages, often forgotten, is read to prompt recall; 3) a “Time and Occasion” pass in which the time of and the name for the eating occasion are collected; 4) a “Detail” pass in which detailed descriptions and portion sizes are collected and the time interval between meals is reviewed to check for additional foods; and 5) the “Final” pass, one last opportunity to remember foods consumed.
The recall data were collected in person on paper by using highly standardized probes, food models, and coding. Interviewers were required to have at least a bachelor’s degree in health, nutrition, or home economics, and they participated in 32 hours of formal training for this study. For each food reported, interviewers referred to standardized probes regarding additions and food types. National Health and Nutrition Examination Survey, 1999–2000, food models were used (8). The recall data were linked to a nutrient database, the Food Intake Analysis System, version 3.99, based on the Continuing Survey of Food Intakes by Individuals (16).
FFQ
The FFQ used in this study was the Diet History Questionnaire, developed and evaluated at the National Cancer Institute (17–21). This 36-page booklet queries the frequency of intake for 124 individual food items over the past 12 months and asks the portion size of most of these items by providing a choice of three ranges. For 44 foods, from one to seven additional embedded questions are asked about factors such as seasonal intake, food type (e.g., low fat, diet, caffeine free), and/or fat uses or additions. The Diet History Questionnaire also includes six questions about use of low-fat foods, four summary questions, and 10 dietary supplement questions. A copy of the instrument used in the OPEN Study is available at the following Internet Web site: http://riskfactor.cancer.gov/DHQ/index.html.
DLW
DLW studies were performed by using a five-urine-specimen protocol, with total body water measured with the plateau method (22). DLW was given orally at a dose of approximately 2 g of 10 atom percent 18O labeled water and 0.12 g of 99.9 atom percent deuterium labeled water per kilogram of estimated total body water along with a subsequent 50-ml water rinse of the dose bottle. Subjects ingested nothing for 1 hour but were then allowed to drink 200–400 ml of juice, a liquid replacement meal, or coffee during the next 2 hours. Volume of liquids consumed and time of consumption were recorded. Urine specimens were collected 2, 3, and 4 hours after the dose was administered; the 2-hour specimen was discarded.
Total body water was determined by stable isotope dilution. The urinary isotopic enrichment 3 and 4 hours after the dose was measured by using mass spectrometry for both isotopes. The isotope dilution spaces (kilograms) were calculated according to Coward and Cole (23). The ratio of deuterium to 18O dilution spaces averaged 1.038 ± 0.018. Total body water was calculated as the average of the deuterium dilution space divided by 1.041 and the oxygen dilution space divided by 1.007 to correct for in vivo isotope exchange (24). Test-retest measurements were performed 2 weeks apart for 25 substudy participants; the within-subject coefficient of variation for total body water was 1.8 percent.
Total energy expenditure was measured by DLW. Used were the initial urine isotopic enrichments determined 3 and 4 hours after dosing and the final urine enrichments in two urine specimens collected about 14 days after the dose was given (except in 10 of the subjects (9 percent of those >60 years of age) for whom blood enrichments were used instead of 3- and 4-hour urine values because urine specimens were less than 98 percent equilibrated). Total energy expenditure was calculated according to Racette et al. (24) and by using the modified Weir equation, assuming a respiratory quotient of 0.86. Repeat isotopic analyses were performed on specimens from 25 participants. The reproducibility of total energy expenditure resulted in a coefficient of variation of 5.1 percent.
For isotope analyses of biologic specimens, urine specimens were mixed with 200 mg of dry carbon black and were filtered through a 0.45-µm filter. Plasma specimens analyzed for deuterium were additionally passed through a 50-kD exclusion filter. Because a 1.4 percent exchange of hydrogen isotopes was observed on these filters, results were corrected for this exchange. For deuterium analysis, a 0.8-µl aliquot of urine was injected into a chromium reduction furnace (H/D Device; Thermoquest, San Jose, California); the resulting hydrogen gas was introduced into a dual inlet mass spectrometer (Delta S; Thermoquest) (25). Samples were analyzed in duplicate, and precisions were 0.6 and 1.0 per mil (one part per thousand change in the ratio of the heavy to light isotope, i.e., (Rsample/Rstandard – 1) × 1,000, where R is the molar ratio of heavy to light isotope abundance) at low and high abundances, respectively. A 1 per mil change in enrichment corresponds to the addition of 2 mol of 18O-hydride or 0.16 mol of deuterium oxide to 106 mol of water. For the 18O analysis (23), a 1-ml aliquot of urine was placed in a 3-ml red-top Vacutainer (Becton, Dickinson and Company, Franklin Lakes, New Jersey) and was equilibrated at 25.0°C for ≥16 hours with 1 ml of standard-temperature-and-pressure carbon dioxide. Carbon dioxide was chromatographed to separate it from air and was introduced into a continuous flow (26) isotope ratio mass spectrometer (Delta Plus; Thermoquest) for analysis. Analyses were performed in duplicate, and precisions were 0.17 and 0.4 per mil at low and high abundances, respectively.
Total energy expenditure measures were excluded because of unacceptable internal agreement, failure to isotopically equilibrate on dosing day, isotopic dilution space ratios outside the range of 1.00–1.08, lack of tracer in the final urine specimen due to high water turnover, or missing specimens.
24-hour urine specimens
Participants received written and verbal instructions on how to collect 24-hour urine specimens and take para-aminobenzoic acid (PABA) tablets (PABAcheck; Laboratories for Applied Biology, London, United Kingdom). On the first morning of collection, participants were asked to discard their first urine specimen and to collect all specimens for the next 24 hours, up to and including the first urine specimen of the next day. They were instructed to take one of three 80-mg PABA tablets at each main meal on the day of the collection to verify completeness. During each collection period, participants recorded 1) time of start and finish, 2) time that the PABAcheck tablets were taken, 3) lost specimens, and 4) medications/supplements taken. Participants were asked to eat and drink normally. All 24-hour urine samples were mixed and weighed before aliquoting into two 25-ml glass bottles. Samples were stored at 20°C until further analysis. All urine collections were aliquoted within 1 day of completion.
Urine PABA concentrations were measured in duplicate by using the colorimetric technique (27). Collections for which PABA recovery was less than 70 percent were considered incomplete and were removed from further analyses (28). Samples containing 70–85 percent PABA were also considered incomplete, but the content of analytes was proportionally adjusted to 93 percent PABA recovery (29).
All samples in excess of 110 percent recovery by the colorimetric technique (n = 123) were analyzed by using high-performance liquid chromatography (30) to distinguish between PABA and acetaminophen, a drug commonly taken by participants. Because the amounts of acetaminophen taken are very large compared with PABA, recoveries in the expected range are generally not affected. Used were a Phenomenex Luna 5 µm C18 Column (Phenomenex, Torrance, California); a mobile phase of 15 percent acetonitrile, 85 percent 0.02 M potassium dihydrogen orthophosphate buffer at a flow rate of 1 ml/minute; and ultraviolet detection at a wavelength of 290 nm. The PABA retention time was 7.5 minutes, and the internal standard (3-Hydroxybenzoic acid) was 12.5 minutes. In the absence of agreed cutoffs for completeness by high-performance liquid chromatography, samples for which recovery was less than 78 percent were excluded, as suggested elsewhere (31). Samples with greater than 110 percent were clear outliers and were also excluded.
Total urinary nitrogen was measured by using the Kjeldahl technique (Tecator 1015 digestor and Kjeltec 1035 analyser; Foss UK Ltd., Warrington, Cheshire, United Kingdom). Urinary potassium and sodium were measured by using flame photometry (IL 943; Instrumentation Laboratories, Warrington, Cheshire, United Kingdom) but are not reported here.
Definition of under- or overreporters
Total energy expenditure and urinary nitrogen represent true usual intake plus within-person random variation. Total energy expenditure is an unbiased measure of true energy intake (32) among persons in energy balance (maintaining weight). Approximately 81 percent of nitrogen intake is excreted in the urine (33, 34). Therefore, urinary nitrogen divided by 0.81 provides an unbiased estimate of nitrogen intake. Because approximately 16 percent of protein is nitrogen (35), nitrogen intake multiplied by 6.25 provides an unbiased protein biomarker.
We log-transformed all measurements to make DLW and urinary nitrogen measurement error additive and homoscedastic and to create approximately normal distributions. For unbiased dietary assessment instruments, the log ratio of reported to biomarker measurements would have a mean of zero and a variance equal to the sum of within-person variation in dietary instrument and biomarker measurements. Therefore, values above or below the 95 percent confidence interval of the log ratio of reported intakes to biomarker measurements indicate the presence of reporting bias, and they define over- or underreporters (refer to the Appendix for details). Missing measurements on any instrument were assumed to be missing at random. Therefore, the within-person random variation and the 95 percent confidence interval were calculated by using the method of maximum likelihood with all information, providing more efficient estimates than analyses limited to participants for whom data were complete.
RESULTS
Of the 925 initial telephone calls made to potential respondents, 88 (10 percent) respondents were ineligible. Of the 837 eligible participants, 614 (73 percent) agreed to participate; of these, 484 (79 percent) attended a scheduled visit 1 and were dosed with DLW. All but two completed the study; however, 484 participants were included in the analyses because some usable data were obtained before they exited the study. For 33 participants in the main study and one in the substudy, total energy expenditure information was unusable. Of 968 possible urinary nitrogen specimens, six were not collected and 27 were unusable because field errors led to inadequate urine volume data. Of the remaining 935 analyzable urine specimens, 274 (29.3 percent) had less than 85 percent or 78 percent recovery from the colorimetric or high-performance liquid chromatography analyses, respectively. Fifty-one of the unusable urine specimens for which recovery by colorimetric analysis was 70–85 percent were adjusted up and were used in the analyses. Thus, 23.9 percent of analyzable urine specimens were lost; total loss (including urine specimens not collected or without adequate volume) was 25.8 percent.
Table 1 shows demographic and other characteristics of the 484 participants who began the study. Participants were approximately evenly distributed by gender and age. The sample was predominately non-Hispanic White. Approximately 91 percent of men and 78 percent of women had an education beyond high school. Seventy-eight percent of men and 61 percent of women were overweight or obese (body mass index (kg/m2) of ≥25) (36).
Tables 2 and 3 show, for men and women, respectively, the geometric means, medians, and interquartile ranges for intakes of energy, protein, and protein density as assessed by biomarkers and self-reported dietary assessment instruments. For men, underreporting of energy (based on mean intakes) compared with total energy expenditure was 12–14 percent on 24HRs and 31–36 percent on FFQs. Underreporting of protein compared with protein biomarker was 11–12 percent for 24HRs and 30–34 percent for FFQs. However, protein density was similar in all of the assessments for men. For women, underreporting of energy compared with total energy expenditure was 16–20 percent for 24HRs and 34–38 percent for FFQs. Protein underreporting ranged from 11–15 percent for 24HRs to 27–32 percent for FFQs. Women’s protein density was slightly overestimated on 24HRs and FFQs.
Raw correlations between total energy expenditure and reported energy intake from the mean of two 24HRs were 0.39 for men and 0.24 for women. For the first FFQ, the comparable correlations were 0.19 and 0.10. Raw correlations between protein biomarker and reported protein intake from the mean of two 24HRs were 0.41 for men and 0.26 for women. For the first FFQ, the comparable correlations were 0.33 and 0.22.
Figures 2 and 3 (a, b, d, and e) display graphically, by dietary assessment instrument for men and women, the distribution of the log ratio of intake (energy intake or protein intake) to biomarkers (total energy expenditure or protein biomarker). The dotted lines represent the 95 percent confidence interval of the ratio: those below the line are defined as underreporters and those above as overreporters. The solid straight line represents perfect reporting compared with the biomarker. The proportion of persons defined as underreporters is indicated by Pr (95 percent confidence interval in parentheses). Approximately 21 percent of men and 22 percent of women underreported energy on the 24HRs compared with 50 percent of men and 49 percent of women on the FFQ. For protein, the comparable percentages for men and women were 13 percent and 10 percent for the 24HR and 39 percent and 29 percent for the FFQ. The curved or sloped line represents a cubic smoothing spline fitting the data points in the figure, showing that as total energy expenditure or protein intake increased, so too did underreporting. Figures 2 and 3 (c and f) show the joint distribution of underreporting of energy and protein for the 24HRs and FFQ. For the 24HRs, approximately 9 percent of men and 7 percent of women underreported both energy and protein; for the FFQ, these values were 35 percent of men and 23 percent of women.
For energy and protein, we determined the proportion of underreporters on both dietary assessment instruments (data not shown). Approximately14 percent of men and 13 percent of women underreported energy on both the 24HR and the FFQ. For protein, 8 percent of men and 4 percent of women were underreporters on both instruments.
Table 4 shows the percentage of underreporters by categories of age and body mass index. For both energy and protein, no clear age trends emerged. However, underreporting tended to increase with body mass index.
Tables 5 and 6 show, for men and women, respectively, intakes of nutrients other than energy or protein according to the 24HRs and the FFQs. For the FFQ compared with the 24HRs, lower reported intakes of fat were noticeable for men and women. Although carbohydrate intake was also lower on the FFQ compared with the 24HRs, the extent of the difference was not as great. The generally lower reporting on the FFQs versus the 24HRs was fairly consistent for other nutrients, but to varying extents. For vitamin C, vitamin A, and magnesium, the 24HRs and FFQs performed similarly. However, neither fat nor carbohydrate density differed greatly between the 24HRs and FFQ.
DISCUSSION
The problem of energy underreporting in dietary assessment instruments for adults has been noted in numerous studies and was reviewed recently (2, 3). Most previous studies were small (<40 subjects) and compared total energy expenditure with reported intakes on food records. Such studies were conducted in various subsamples under a variety of conditions. In 34 studies with at least 10 subjects, reporting bias (reported intake – total energy expenditure/total energy expenditure × 100 percent) on food records ranged from –59 percent (in a diet-resistant group) to 24 percent (among “large eaters”) (3). All but one of these studies showed underreporting, with a mean across studies of about –21 percent. The six studies comparing reported intakes from 24HRs with total energy expenditure showed underreporting in the range of –3 percent to –26 percent, with an average of approximately –18 percent (3). The OPEN Study found underreporting to be slightly less (about –10 percent for men and –14 percent for women), with our highly standardized recall and a large, highly educated sample.
Both 24HRs and food records are used to validate/calibrate FFQs and to correct for measurement error in epidemiologic studies, and the implications of our findings regarding the impact of measurement error and energy adjustment on nutritional epidemiology are presented in the companion paper (6). Underreporting on 24HRs is also of concern because 24HRs are used in dietary surveillance. We showed that underreporting of energy was somewhat greater than that of protein, indicating a bias toward more underreporting of fat, carbohydrate, and alcohol. Data suggest that underreporters report consuming less of all food groups but that the degree of underreporting can vary between foods (37), making it difficult to use biomarker data for any single nutrient or food group to adjust intakes of others.
The Diet History Questionnaire is an FFQ that has undergone several years of research and development (17–21), motivated by an interest in improving upon FFQs available in the 1990s. It has been shown to be comparable to or better than the Willett or Block FFQs (20, 21) when a checklist or four 24HRs are used as reference instruments and to have reasonable data quality and response rates (19). However, underreporting was a significant problem for the Diet History Questionnaire, and comparing it with 24HRs indicates that assessing fat intake is an important concern. The instrument queries fat use in detail, yet it does not seem able to accurately reflect that information. Either this specific FFQ, like others, might be improved further or we must accept the limitations of all FFQs. The question is whether the benefits of FFQs outweigh the limitations for answering questions about diet and disease.
An important consideration is whether biomarkers collected mostly over one season adequately reflect long-term intake as queried on FFQs. We analyzed 24HRs taken in different seasons in cross-sectional national survey data (Continuing Survey of Food Intakes by Individuals 1994–1996) by region and gender, and we found no seasonal fluctuations in energy or protein intakes, justifying the use of these biomarker measurements to represent usual intakes.
Our data also show that underreporting tends to increase with increased intake. The more respondents require or consume, the more difficult it is to report consumption accurately perhaps because remembering more foods or bigger portion sizes is challenging or because of societal pressure to consume less. Similarly, as many other studies show, increasing body mass index is associated with underreporting. Full investigation of demographic and psychosocial characteristics that might be associated with underreporting is the subject of another analysis.
Since DLW measures total energy expenditure, it would be important to adjust the data for long-term weight change to enable total energy expenditure to truly be an unbiased measure of usual energy intake. Doing so over the 2-week DLW period, however, may introduce only more random error given that a rather small amount of within-person week-to-week fluctuation in energy balance can be explained by contemporary changes in weight (38). Over the 3-month study period, which included the holiday season for most, participants gained weight on average (1.1 kg for men, 0.5 kg for women). Adjusting for this weight gain resulted in a greater degree of underreporting. However, using this brief period may not have adequately represented long-term weight change, especially so in the OPEN Study, given protocol differences in fasting conditions between visits 1 and 3.
Second administrations of both the 24HR and FFQ, 3 months after the first, showed greater underreporting, which questions the ability of respondents to maintain their enthusiasm to provide consistent quality data with multiple administrations of long instruments. The 24HR generally took 30–60 minutes to complete; the Diet History Questionnaire required about 60 minutes (19). These times reflect the amount of detail required to measure diet well, but either this time commitment or the previous exposure led participants to complete instruments differently with each administration.
The findings from the OPEN Study indicate that nutritional epidemiologists need to carefully reconsider the implications of underreporting and measurement error in their research. Are absolute or energy-adjusted intakes the relevant exposures of interest, and why? We measure energy so poorly, yet energy adjustment minimizes underreporting for protein. The companion paper (6) investigates how energy adjustment works for protein, but how this translates to non-energy-producing nutrients is unknown. Clearly, further elucidating these issues will boost support for nutritional epidemiology.
APPENDIX
For a given self-reporting instrument (FFQ or 24HR) and dietary component (energy intake, protein intake), let Fij be the reported intake and Mij the corresponding biomarker measurement for subject i, i = 1, … ,n and repeat measure j. Let k denote the number of repeat dietary measurements and m the number of repeat biomarker measurements, and let  and
and  denote their respective geometric means. If subject i is an accurate reporter, then the log-ratio log
  has the expected value 0 with the 95 percent confidence interval
 ,
,  ,
,
where  and
and  denote the within-person variation for reported and biomarker measurements, respectively, on the log scale. Variances
  and
and  can be estimated as one half the sample variance of (log Fi1 – log Fi2) and (log Mi1 – log Mi2), respectively.
Values above or below the 95 percent confidence interval of the log ratio were taken to indicate over- or underreporters, respectively. On the original scale, over- or underreporters correspond to those whose values of the ratio  were above or below the interval
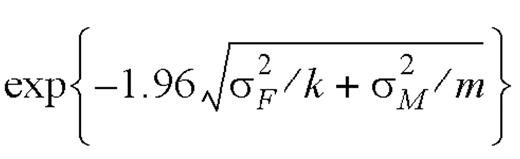 ,
, 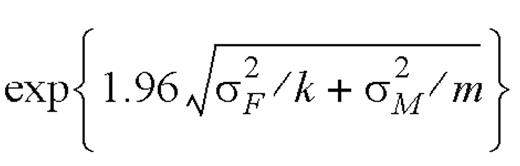 .
.
In defining ratio  for a particular self-reporting instrument (FFQ or 24HR) and dietary component (energy or protein), k and m are specified as follows: k = 1 for FFQ (Diet History Questionnaire 1), k = 2 for 24HR (mean of recalls), m = 1 for energy (total energy expenditure), and m = 2 for protein (using mean of protein biomarker). We used intakes from FFQ 1 because this questionnaire seemed to have the highest data quality and the average of the two 24HRs to better assess usual intakes.
Reprint requests to Dr. Amy F. Subar, National Cancer Institute, DCCPS, ARP, 6130 Executive Boulevard, MSC 7344, EPN 4005, Bethesda, MD 20892-7344 (e-mail: subara@mail.nih.gov).
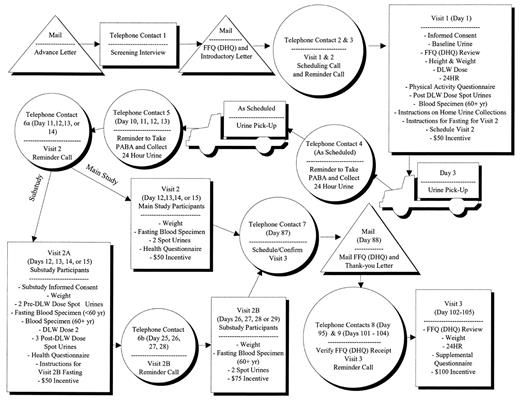
FIGURE 1. Study flow and activities, the Observing Protein and Energy Nutrition (OPEN) Study, Maryland, September 1999–March 2000. FFQ, food frequency questionnaire; DHQ, Diet History Questionnaire; DLW, doubly labeled water; 24HR, 24-hour dietary recall; yr, year; PABA, para-aminobenzoic acid.
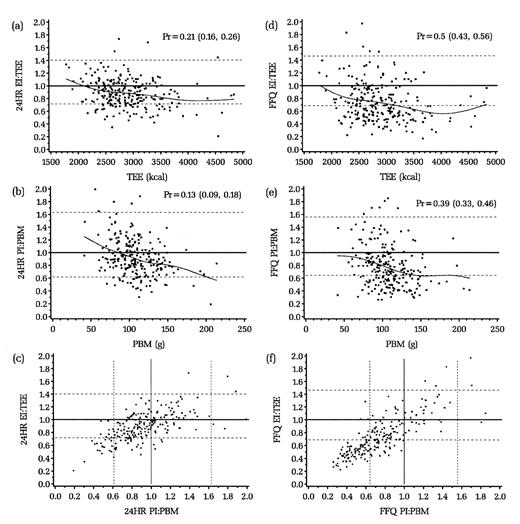
FIGURE 2. Men: Reported energy intake (EI):total energy expenditure (TEE) against TEE for 24-hour dietary recalls (24HR) (a) or the food frequency questionnaire (FFQ) (d); reported protein intake (PI):protein biomarker (PBM) against PBM for 24HR (b) and FFQ (e); and EI:TEE against PI:PBM for 24HR (c) and FFQ (f), the Observing Protein and Energy Nutrition (OPEN) Study, Maryland, September 1999–March 2000. Solid lines, expected ratio for valid reporting (points above the line, overreporters; points below the line, underreporters); dotted lines, 95% confidence interval for accurate reporting (EI:TEE and PI:PBM); curved lines, a cubic smoothing spline fit to the data points. Pr, proportion (95% confidence interval) for underreporters. Two respondent observations—one in (a), one in (f), and these same two in (d)—were outside the range of the axes of the plots and were excluded.
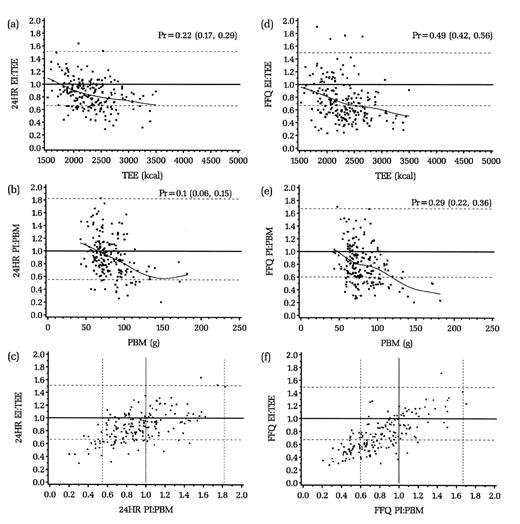
FIGURE 3. Women: Reported energy intake (EI):total energy expenditure (TEE) against TEE for 24-hour dietary recalls (24HR) (a) or the food frequency questionnaire (FFQ) (d); reported protein intake (PI):protein biomarker (PBM) against PBM for 24HR (b) and FFQ (e); and EI:TEE against PI:PBM for 24HR (c) and FFQ (f), the Observing Protein and Energy Nutrition (OPEN) Study, Maryland, September 1999–March 2000. Solid lines, expected ratio for valid reporting (points above the line, overreporters; points below the line, underreporters); dotted lines, 95% confidence interval for accurate reporting (EI:TEE and PI:PBM); curved lines, a cubic smoothing spline fit to the data points. Pr, proportion (95% confidence interval) for underreporters.
Characteristics of the sample in the OPEN* Study, Maryland, September 1999–March 2000†
| Men (n = 261) | Women (n = 223) | ||||
| No. | % | No. | % | ||
| Age (years) | |||||
| 40–49 | 96 | 36.8 | 88 | 39.5 | |
| 50–59 | 90 | 34.5 | 82 | 36.8 | |
| 60–69 | 75 | 28.7 | 53 | 23.8 | |
| Race/ethnicity | |||||
| Non-Hispanic White | 226 | 86.6 | 173 | 77.6 | |
| Non-Hispanic Black | 7 | 2.7 | 23 | 10.3 | |
| Hispanic | 7 | 2.7 | 4 | 1.8 | |
| Other/unknown | 21 | 8.1 | 23 | 10.3 | |
| Education | |||||
| <High school | 3 | 1.2 | 5 | 2.2 | |
| High school | 18 | 6.9 | 38 | 17.0 | |
| Some college or college graduate | 144 | 55.2 | 117 | 52.5 | |
| Postgraduate | 95 | 36.4 | 58 | 26.0 | |
| Other/unknown | 1 | 0.4 | 5 | 2.2 | |
| Body mass index (kg/m2) | |||||
| <25.0 | 57 | 21.8 | 86 | 38.6 | |
| 25.0–29.9 | 127 | 48.7 | 72 | 32.3 | |
| ≥30.0 | 77 | 29.5 | 65 | 29.2 | |
| Smoking status | |||||
| Current | 23 | 8.8 | 29 | 13.0 | |
| Former | 88 | 33.7 | 60 | 26.9 | |
| Never | 150 | 57.5 | 132 | 59.2 | |
| Unknown | 0 | 0.0 | 2 | 0.9 | |
* OPEN, Observing Protein and Energy Nutrition.
† Some percentages do not total 100 because of rounding.
Nutrient intakes based on biomarkers and self-reported dietary assessment instruments (men), the OPEN* Study, Maryland, September 1999–March 2000
| Nutrient | No. | Geometric mean | 95% CI* | 25th percentile | Median | 75th percentile |
| Energy (kcal) | ||||||
| TEE* | 245 | 2,849 | 2,788, 2,912 | 2,553 | 2,813 | 3,146 |
| 24HR* 1 | 261 | 2,512 | 2,416, 2,610 | 2,085 | 2,577 | 3,108 |
| 24HR 2 | 260 | 2,436 | 2,338, 2,537 | 1,989 | 2,466 | 3,032 |
| DHQ* 1 | 260 | 1,959 | 1,863, 2,061 | 1,537 | 1,955 | 2,550 |
| DHQ 2 | 259 | 1,818 | 1,727, 1,914 | 1,409 | 1,870 | 2,347 |
| Protein (g) | ||||||
| PBM* 1† | 192 | 104.2 | 100.3, 108.2 | 88.7 | 102.8 | 124.3 |
| PBM 2 | 202 | 103.8 | 99.9, 107.9 | 88.1 | 106.0 | 125.8 |
| 24HR 1 | 261 | 91.7 | 87.6, 96.1 | 71.9 | 94.1 | 118.9 |
| 24HR 2 | 260 | 92.9 | 88.2, 97.9 | 71.5 | 95.0 | 124.9 |
| DHQ 1 | 260 | 73.0 | 69.1, 77.1 | 56.5 | 73.9 | 98.0 |
| DHQ 2 | 259 | 69.0 | 65.3, 73.0 | 51.4 | 74.7 | 93.1 |
| Protein density (%) | ||||||
| Biomarker 1‡ | 180 | 14.6 | 14.1, 15.2 | 12.7 | 14.9 | 17.1 |
| Biomarker 2 | 189 | 14.6 | 14.1, 15.1 | 12.8 | 14.8 | 17.1 |
| 24HR 1 | 261 | 14.6 | 14.1, 15.1 | 11.9 | 14.5 | 17.8 |
| 24HR 2 | 260 | 15.3 | 14.7, 15.8 | 12.6 | 15.5 | 18.3 |
| DHQ 1 | 260 | 14.9 | 14.5, 15.3 | 13.4 | 15.4 | 17.0 |
| DHQ 2 | 259 | 15.2 | 14.8, 15.6 | 13.6 | 15.5 | 17.1 |
* OPEN, Observing Protein and Energy Nutrition; CI, confidence interval; TEE, total energy expenditure; 24HR, 24-hour dietary recall; DHQ, Diet History Questionnaire; PBM, protein biomarker.
†Protein biomarker = urinary nitrigen/0.81 (converts urinary nitrogen to dietary nitrogen) × 6.25 (converts dietary nitrogen to dietary protein).
‡Biomarker for protein density = PBM × 4 kcal (kcal per g of protein)/TEE × 100%.
Nutrient intakes based on biomarkers and self-reported dietary assessment instruments (women), the OPEN* Study, Maryland, September 1999–March 2000
| Nutrient | No. | Geometric mean | 95% CI* | 25th percentile | Median | 75th percentile |
| Energy (kcal) | ||||||
| TEE* | 206 | 2,277 | 2,226, 2,329 | 2,031 | 2,283 | 2,526 |
| 24HR* 1 | 223 | 1,919 | 1,833, 2,009 | 1,565 | 1,937 | 2,438 |
| 24HR 2 | 222 | 1,814 | 1,732, 1,899 | 1,497 | 1,808 | 2,275 |
| DHQ* 1 | 222 | 1,514 | 1,438, 1,594 | 1,173 | 1,516 | 1,991 |
| DHQ 2 | 221 | 1,405 | 1,333, 1,481 | 1,088 | 1,384 | 1,838 |
| Protein (g) | ||||||
| PBM* 1† | 174 | 77.5 | 74.4, 80.8 | 63.9 | 77.1 | 93.5 |
| PBM 2 | 150 | 77.3 | 73.9, 80.8 | 63.0 | 74.7 | 91.8 |
| 24HR 1 | 223 | 69.2 | 65.3, 73.2 | 54.2 | 72.2 | 90.3 |
| 24HR 2 | 222 | 65.6 | 61.8, 69.6 | 50.1 | 67.7 | 89.6 |
| DHQ 1 | 222 | 56.6 | 53.5, 59.8 | 43.9 | 56.4 | 76.4 |
| DHQ 2 | 221 | 52.7 | 49.9, 55.7 | 39.8 | 51.8 | 70.1 |
| Protein density (%) | ||||||
| Biomarker 1‡ | 160 | 13.7 | 13.1, 14.3 | 11.4 | 13.9 | 16.3 |
| Biomarker 2 | 140 | 13.6 | 13.0, 14.2 | 11.2 | 13.8 | 16.1 |
| 24HR 1 | 223 | 14.4 | 13.9, 15.0 | 12.3 | 14.9 | 17.4 |
| 24HR 2 | 222 | 14.5 | 13.9, 15.1 | 12.0 | 14.3 | 17.4 |
| DHQ 1 | 222 | 15.0 | 14.5, 15.4 | 13.1 | 15.1 | 17.2 |
| DHQ 2 | 221 | 15.0 | 14.6, 15.4 | 13.1 | 15.0 | 17.2 |
* OPEN, Observing Protein and Energy Nutrition; CI, confidence interval; TEE, total energy expenditure; 24HR, 24-hour dietary recall; DHQ, Diet History Questionnaire; PBM, protein biomarker.
†Protein biomarker = urinary nitrigen/0.81 (converts urinary nitrogen to dietary nitrogen) × 6.25 (converts dietary nitrogen to dietary protein).
‡Biomarker for protein density = PBM × 4 kcal (kcal per g of protein)/TEE × 100%.
Percentage of respondents classified as underreporters by age and body mass index, the OPEN* Study, Maryland, September 1999–March 2000
| Average 24HR*,† | FFQ* 1‡ | ||||
| Men | Women | Men | Women | ||
| Energy underreporters (%)§ | |||||
| Total | 20.8 | 22.3 | 49.6 | 49.0 | |
| Age (years) | |||||
| 40–49 | 16.7 | 18.8 | 40.0 | 48.8 | |
| 50–59 | 25.9 | 23.4 | 65.0 | 46.8 | |
| 60–69 | 20.3 | 26.5 | 44.6 | 53.1 | |
| Body mass index (kg/m2) | |||||
| <25 | 13.3 | 12.7 | 31.7 | 44.3 | |
| 25–29.9 | 17.4 | 22.4 | 49.1 | 56.7 | |
| ≥30 | 33.3 | 35.0 | 66.2 | 46.7 | |
| Protein underreporters (%)§ | |||||
| Total | 13.2 | 9.8 | 39.2 | 28.7 | |
| Age (years) | |||||
| 40–49 | 9.3 | 7.6 | 26.7 | 25.3 | |
| 50–59 | 21.1 | 13.4 | 57.3 | 29.9 | |
| 60–69 | 9.1 | 8.5 | 34.9 | 32.6 | |
| Body mass index (kg/m2) | |||||
| <25.0 | 8.6 | 3.7 | 22.4 | 25.6 | |
| 25.0–29.9 | 13.3 | 8.6 | 40.0 | 31.0 | |
| ≥30.0 | 16.9 | 20.8 | 53.1 | 30.8 | |
* OPEN, Observing Protein and Energy Nutrition; 24HR, 24-hour dietary recall; FFQ, food frequency questionnaire.
†Average of the two 24HRs.
‡Intakes from FFQ 1 were used because this questionnaire seemed to have the highest data quality.
§ Underreporters were defined as respondents whose values were below the 95% confidence interval of the log ratio of reported intakes to biomarker measurements (refer to the Appendix for details).
Intakes of nutrients without biomarkers for dietary assessment instruments (men), the OPEN* Study, Maryland, September 1999–March 2000
| Nutrient | 24HR* 1 (n = 261) | 24HR 2 (n = 260) | DHQ* 1 (n = 260) | DHQ 2 (n = 259) | |||||||
| Median | 25th, 75th percentiles | Median | 25th, 75th percentiles | Median | 25th, 75th percentiles | Median | 25th, 75th percentiles | ||||
| Carbohydrate (g) | 325.3 | 255.9, 408.5 | 317.5 | 242.7, 391.6 | 246.6 | 191.2, 329.8 | 235.8 | 174.1, 302.7 | |||
| Carbohydrate (% kcal) | 52.2 | 43.2, 58.2 | 51.1 | 44.4, 58.7 | 52.0 | 46.7, 58.4 | 51.4 | 45.6. 57.7 | |||
| Fat (g) | 88.1 | 63.6, 114.5 | 82.5 | 59.6, 115.6 | 65.4 | 49.0, 84.8 | 64.8 | 45.1, 84.8 | |||
| Fat (% kcal) | 31.4 | 25.7, 37.6 | 31.8 | 25.6, 37.5 | 31.1 | 25.7, 35.5 | 31.4 | 26.6, 36.2 | |||
| Saturated fat (g) | 28.1 | 18.7, 39.9 | 25.1 | 16.5, 39.1 | 21.3 | 14.7, 28.4 | 20.4 | 14.0, 28.0 | |||
| Monounsaturated fat (g) | 32.8 | 23.4, 44.0 | 31.0 | 21.8, 44.2 | 25.5 | 18.5, 33.4 | 25.0 | 17.0, 32.3 | |||
| Polyunsaturated fat (g) | 18.0 | 11.8, 25.7 | 18.3 | 12.0, 27.0 | 14.2 | 10.7, 19.4 | 13.6 | 10.2, 18.6 | |||
| Cholesterol (mg) | 239 | 157, 378 | 235 | 143, 355 | 194 | 137, 259 | 186 | 133, 256 | |||
| Dietary fiber (g) | 22.1 | 15.3, 29.0 | 21.0 | 15.0, 28.2 | 17.4 | 13.2, 24.4 | 16.6 | 12.4, 22.9 | |||
| Vitamin A (mcg RE*) | 1,045 | 588, 1,733 | 962 | 530, 1,623 | 1,064 | 746, 1,611 | 1,052 | 702, 1,527 | |||
| Vitamin E (mg α-TE*) | 10.3 | 7.0, 14.4 | 10.0 | 6.9, 14.9 | 8.5 | 6.6, 12.1 | 8.3 | 5.9, 11.3 | |||
| Vitamin C (mg) | 103.1 | 55.9, 177.2 | 112.4 | 59.0, 197.6 | 116.4 | 77.0, 179.5 | 114.8 | 72.0, 171.5 | |||
| Thiamin (mg) | 1.96 | 1.47, 2.63 | 1.98 | 1.51, 2.69 | 1.59 | 1.22, 2.07 | 1.50 | 1.07, 1.97 | |||
| Riboflavin (mg) | 2.23 | 1.61, 2.94 | 2.11 | 1.63, 2.89 | 1.88 | 1.42, 2.45 | 1.78 | 1.25, 2.40 | |||
| Niacin (mg) | 29.2 | 21.4, 36.2 | 28.8 | 22.0, 37.7 | 23.8 | 18.6, 31.3 | 23.3 | 17.4, 29.7 | |||
| Folate (mcg) | 456 | 346, 611 | 458 | 327, 617 | 292 | 211, 412 | 283 | 197, 383 | |||
| Vitamin B6 (mg) | 2.39 | 1.68, 3.11 | 2.38 | 1.66, 3.11 | 1.97 | 1.49, 2.78 | 1.86 | 1.37, 2.57 | |||
| Calcium (mg) | 920 | 593, 1,233 | 848 | 584, 1,189 | 739 | 546, 1,030 | 692 | 487, 930 | |||
| Iron (mg) | 19.3 | 14.1, 26.5 | 19.6 | 13.9, 26.7 | 16.3 | 12.3, 20.9 | 14.7 | 11.2, 20.1 | |||
| Magnesium (mg) | 363 | 290, 469 | 365 | 280, 468 | 324 | 254, 428 | 324 | 235, 414 | |||
| Phosphorus (mg) | 1,504 | 1,182, 1,951 | 1,441 | 1,155, 1,913 | 1,220 | 947, 1,593 | 1,198 | 835, 1,532 | |||
| Zinc (mg) | 13.4 | 9.9, 18.8 | 13.5 | 9.7, 19.3 | 11.7 | 8.7, 15.1 | 11.6 | 8.1, 14.7 | |||
* OPEN, Observing Protein and Energy Nutrition; 24HR, 24-hour dietary recall; DHQ, Diet History Questionnaire; RE, retinol equivalents; α-TE, alpha-tocopherol equivalents.
Intakes of nutrients without biomarkers for dietary assessment instruments (women), the OPEN* Study, September 1999–March 2000
| Nutrient | 24HR* 1 (n = 223) | 24HR 2 (n = 222) | DHQ* 1 (n = 222) | DHQ 2 (n = 221) | |||||||
| Median | 25th, 75th percentiles | Median | 25th, 75th percentiles | Median | 25th, 75th percentiles | Median | 25th, 75th percentiles | ||||
| Carbohydrate (g) | 255.4 | 193.7, 320.2 | 235.1 | 186.8, 297.4 | 204.9 | 165.1, 262.3 | 188.1 | 148.9, 244.9 | |||
| Carbohydrate (% kcal) | 53.2 | 44.7, 60.0 | 53.4 | 44.0, 61.1 | 55.4 | 49.6, 61.2 | 55.0 | 48.9, 60.5 | |||
| Fat (g) | 67.9 | 45.7, 96.0 | 65.5 | 44.5, 86.8 | 50.1 | 35.4, 69.0 | 44.0 | 33.5, 63.9 | |||
| Fat (% kcal) | 31.3 | 25.3, 39.0 | 31.6 | 25.5, 37.9 | 29.6 | 25.1, 34.6 | 30.1 | 24.6, 34.2 | |||
| Saturated fat (g) | 22.5 | 15.2, 31.9 | 19.6 | 12.5, 28.6 | 15.7 | 10.7, 23.5 | 14.6 | 10.5, 20.5 | |||
| Monounsaturated fat (g) | 25.1 | 16.9, 37.6 | 24.2 | 15.9, 33.7 | 18.4 | 12.9, 25.6 | 16.5 | 12.2, 23.9 | |||
| Polyunsaturated fat (g) | 13.9 | 8.6, 22.4 | 13.6 | 8.8, 21.5 | 10.8 | 8.1, 15.4 | 10.0 | 7.0, 15.0 | |||
| Cholesterol (mg) | 196.7 | 109.4, 3,34.1 | 180.6 | 99.3, 294.3 | 145.3 | 99.0, 211.7 | 132.5 | 95.0, 201.1 | |||
| Dietary fiber (g) | 16.6 | 11.2, 23.0 | 16.4 | 10.9, 22.8 | 15.8 | 11.6, 20.5 | 14.7 | 11.5, 19.7 | |||
| Vitamin A (mcg RE*) | 910 | 500, 1,636 | 798 | 452, 1,495 | 1,114 | 722, 1,675 | 1,139 | 730, 1,586 | |||
| Vitamin E (mg α-TE*) | 8.3 | 5.5, 12.4 | 7.7 | 5.6, 11.3 | 7.4 | 5.5, 10.8 | 6.7 | 5.0, 9.9 | |||
| Vitamin C (mg) | 96.5 | 48.5, 172.2 | 101.3 | 54.7, 174.3 | 126.0 | 81.1, 187.2 | 129.5 | 83.2, 173.7 | |||
| Thiamin (mg) | 1.50 | 1.19, 2.05 | 1.45 | 1.13, 2.00 | 1.30 | 0.96, 1.63 | 1.18 | 0.92, 1.54 | |||
| Riboflavin (mg) | 1.88 | 1.38, 2.44 | 1.66 | 1.30, 2.27 | 1.52 | 1.20, 2.00 | 1.39 | 1.05, 1.82 | |||
| Niacin (mg) | 21.0 | 15.5, 28.9 | 20.7 | 13.9, 27.8 | 17.9 | 13.7, 24.1 | 17.0 | 12.8, 21.8 | |||
| Folate (mcg) | 379 | 267, 499 | 349 | 246, 493 | 274 | 196, 376 | 254 | 184, 328 | |||
| Vitamin B6 (mg) | 1.73 | 1.15, 2.42 | 1.60 | 1.16, 2.21 | 1.67 | 1.18, 2.14 | 1.54 | 1.15, 1.97 | |||
| Calcium (mg) | 771 | 504, 1,045 | 671 | 46, 982 | 614 | 460, 905 | 556 | 418, 779 | |||
| Iron (mg) | 14.9 | 11.0, 20.5 | 13.4 | 10.1, 18.3 | 13.0 | 9.7, 16.1 | 11.9 | 9.2, 16.0 | |||
| Magnesium (mg) | 279 | 221, 377 | 271 | 210, 357 | 278 | 225, 352 | 260 | 206, 341 | |||
| Phosphorus (mg) | 1,182 | 914, 1,490 | 1,143 | 816, 1,430 | 985 | 781, 1,267 | 868 | 693, 1,202 | |||
| Zinc (mg) | 10.1 | 7.1, 14.1 | 8.8 | 6.5, 12.9 | 8.5 | 6.6, 11.4 | 7.9 | 6.2, 10.7 | |||
* OPEN, Observing Protein and Energy Nutrition; 24HR, 24-hour dietary recall; DHQ, Diet History Questionnaire; RE, retinol equivalents; α-TE, alpha-tocopherol equivalents.
References
Willett WC, Sampson L, Stampfer MJ, et al. Reproducibility and validity of a semiquantitative food frequency questionnaire.
Hill RG, Davies PSW. The validity of self-reported energy intake as determined using the doubly labeled water technique.
Trabulsi J, Schoeller DA. Evaluation of dietary assessment instruments against doubly labeled water, a biomarker of habitual energy intake.
Black AE, Bingham SA, Johansson G, et al. Validation of dietary intakes of protein and energy against 24 urinary N and DLW energy expenditure in middle-aged women, retired men and post-obese subjects: comparisons with validation against presumed energy requirements.
Black AE, Cole TJ. Biased over- or under-reporting is characteristic of individuals whether over time or by different assessment methods.
Kipnis V, Subar AF, Midthune D, et al. Structure of dietary measurement error: results of the OPEN biomarker study.
Blanc S, Colligan AS, Trabulsi J, et al. Influence of delayed isotopic equilibration in urine on the accuracy of the (2)H(2)(18)O method in the elderly.
Physical activity questionnaire from the 1999–2000 National Health and Nutrition Examination Survey. (http://www.cdc.gov/nchs/data/nhanes/spq-pa.pdf). Accessed December 19, 2002.
Leary MR. A brief version of the Fear of Negative Evaluation Scale. Personality
Stunkard AJ, Sorensen T, Schulsinger F. Use of the Danish adoption register for the study of obesity and thinness. In: Kety SS, Rowland LP, Sidman RL, et al, eds. Genetics of neurological and psychiatric disorders. New York, NY: Raven Press, 1983:115–20.
Stunkard AJ, Messick S. The three-factor eating questionnaire to measure dietary restraint, disinhibition and hunger.
Crowne DP, Marlowe D. A scale of social desirability independent of psychopathology.
Strahan R, Gerbasi KC. Short, homogeneous versions of the Marlowe-Crowne social desirability scale.
Fischer DG, Fick C. Measuring social desirability: short forms of the Marlowe-Crowne social desirability scale.
Moshfegh AJ, Raper N, Ingwersen I, et al. An improved approach to 24-hour dietary recall methodology.
Tippett KS, Cypel YS, eds. Design and operation: the Continuing Survey of Food Intakes by Individuals and the Diet and Health Knowledge Survey 1994–96, Continuing Survey of Food Intakes by Individuals 1994–96. Beltsville, MD: US Department of Agriculture, Agricultural Research Service, 1997. (Nationwide Food Surveys report no. 96-1). (NTIS accession no. PB98-137268).
Subar AF, Thompson FE, Smith AF, et al. Improving food frequency questionnaires: a qualitative approach using cognitive interviewing.
Subar AF, Midthune D, Kulldorff M, et al. Evaluation of alternative approaches to assign nutrient values to food groups in food frequency questionnaires.
Subar AF, Ziegler RG, Thompson FE, et al. Is shorter always better? Relative importance of questionnaire length and cognitive ease on response rates and data quality for two dietary questionnaires.
Subar AF, Thompson FE, Kipnis V, et al. Comparative validation of the Block, Willett, and National Cancer Institute food frequency questionnaires: the Eating at America’s Table Study.
Thompson FE, Subar AF, Brown CC, et al. Cognitive research enhances accuracy of food frequency questionnaire reports: results of an experimental validation study.
Schoeller DA. Isotope dilution methods. In: Borntorp P, Brodoff BN, eds. Obesity. Philadelphia, PA: Lippincott Co, 1992:80–8.
Coward A, Cole T. Precision and accuracy of the doubly labeled water energy expenditure by multipoint and two-point methods.
Racette SB, Schoeller DA, Luke AH, et al. Relative dilution spaces of 2H- and 18O-labeled water in humans.
Schoeller DA, Colligan AS, Shriver T, et al. Use of an automated reduction system for hydrogen isotope ratio analysis of physiologic fluids applied to doubly labeled water.
Schoeller DA, Luke AH. Rapid 18O analysis of CO2 samples by continuous flow isotope ratio mass spectrometry.
Bingham SA, Williams DRR, Cole TJ, et al. Reference values for analytes of 24 h urine samples known to be complete.
Bingham S, Cummings JH. The use of 4-aminobenzoic acid as a marker to validate the completeness of 24 h urine collections in man.
Johansson G, Bingham S, Vahter M. A method to compensate for incomplete 24 h urine collections in nutritional epidemiology studies.
Berg JD, Chesner I, Lawson N. Practical assessment of the NBT-PABA pancreatic function test using HPLC determination of p-aminobenzoic acid in urine.
Jakobsen J, Ovesen L, Fagt S, et al. Para-aminobenzoic acid used as a marker for completeness of 24 hour urine: assessment of control limits for a specific HPLC method.
Schoeller DA. Measurement error energy expenditure in free-living humans by using doubly labeled water.
Kipnis V, Midthune D, Freedman LS, et al. Empirical evidence of correlated biases in dietary assessment instruments and its implications.
Bingham SA, Cummings JH. Urine nitrogen as an independent validatory measure of dietary intake: a study of nitrogen balance in individuals consuming their normal diet.
Matthews DE. Proteins and amino acids. In: Shils ME, Olson JA, Shike M, et al, eds. Modern nutrition in health and disease. 9th ed. Baltimore, MD: Williams & Wilkins Company, 1999:11–48.
Clinical guidelines on the identification, evaluation, and treatment of overweight and obesity in adults: the evidence report. NHLBI obesity education initiative. Bethesda, MD: US Department of Health and Human Services, Public Health Service, National Institutes of Health, National Heart, Lung, and Blood Institute, 1998. (NIH publication no. 98-4083).
Krebs-Smith SM, Graubard B, Kahle LL, et al. Low energy reporters vs others: a comparison of reported food intakes.

