


Abstract
The advent of macrolides has led to therapeutic advances in the treatment of Mycobacterium avium complex lung disease (MAC-LD). The aim of this study was to elucidate the treatment outcomes of macrolide-containing regimens.
We performed a systematic review and meta-analysis of published studies reporting treatment outcomes of macrolide-containing regimens for MAC-LD using the Medline, Embase, and Cochrane Library databases through 31 July 2016. The rates of treatment success, default from treatment, and adverse events of macrolide-containing regimens were assessed. Treatment success was defined as either 12 months of sustained culture negativity while on therapy or achievement of culture conversion and completion of the planned treatment without relapse.
In total, 16 studies involving 1462 patients were included. The rate of treatment success was 60.0% (95% confidence interval [CI], 55.1%–64.8%). The proportion of patients who defaulted from the treatment was 16.0% (95% CI, 12.3%–19.7%). When a thrice-weekly dosing schedule was available, the default rate was 12.0% (95% CI, 8.9%–15.0%). Adverse events necessitating treatment discontinuation or dosage modification of macrolides were observed in 6.4% of patients (95% CI, 3.2%–9.5%), and decreased auditory acuity was the most common adverse event.
Treatment outcomes of macrolide-containing regimens are relatively poor in terms of both the treatment success and default rates. The default rate could be reduced if a thrice-weekly dosing schedule is available. Clinicians should be aware of decreased auditory function as the most common adverse event associated with macrolide-containing regimens.
Nontuberculous mycobacteria (NTM) are ubiquitous microorganisms that can be isolated from the environment, including the water and soil. NTM may cause asymptomatic infection, but they can also cause symptomatic disease in humans and the most common manifestation is lung disease [1]. The prevalence of NTM lung disease (NTM-LD) is increasing in both countries with an intermediate tuberculosis (TB) burden [2] as well as those with a low TB burden [3]. More than two-thirds of NTM-LD is caused by Mycobacterium avium complex (MAC) [2, 3], which encompasses Mycobacterium avium, Mycobacterium intracellulare, Mycobacterium chimaera, Mycobacterium arosiense, Mycobacterium bouchedurhonense, and other species [4]. However, most of these species are still reported as MAC or M. avium-intracellulare [5].
MAC lung disease (MAC-LD) is classified into 2 types: fibrocavitary disease and nodular bronchiectatic disease [1]. Fibrocavitary disease is prevalent among patients with a smoking history or chronic obstructive pulmonary disease, and nodular bronchiectatic disease is usually diagnosed in nonsmoking middle-aged women. Although nodular bronchiectatic disease shows a more indolent course than fibrocavitary disease, about half of these patients require treatment within 3 years because of radiologic deterioration and symptom worsening [6].
Historically, the treatment of MAC-LD mainly depended on anti-TB drugs such as isoniazid, rifampin, and ethambutol [1]. However, relapse after therapy was common when treated with these drugs [1], and in vitro susceptibility tests for these drugs had poor correlation with in vivo susceptibility [7]. In the 1990s, clarithromycin, a newer macrolide, was introduced into the treatment regimens. Azithromycin, an azalide that alluded to macrolide because of its close similarity to macrolides, was also adopted [1]. The adoption of macrolides resulted in therapeutic advances [1]. In a current guideline, the administration of macrolides with rifampin and ethambutol is recommended as the first-line regimen for MAC-LD [1].
The treatment outcomes of currently recommended regimens have not been fully elucidated. Studies of treatment outcomes have used different definitions of treatment success, and this variation in definitions has led to inconsistent treatment outcomes. In addition, the rates of treatment compliance and adverse events have not been clearly reported. The aim of this study was to verify the treatment outcomes of macrolide-containing regimens. We also evaluated the rates of treatment default and adverse events during treatment.
METHODS
This study was performed in accordance with the Preferred Reporting Items for Systematic Reviews and Meta-Analyses (PRISMA) statement [8]. A protocol was registered with the PROSPERO database (CRD4201758573).
Search Strategy and Selection Criteria
We conducted a literature search of the Medline, Embase, and Cochrane databases using Medical Subject Headings (MeSH) terms and text words related to MAC-LD and its treatment. The key terms were “Mycobacterium avium,” “Mycobacterium intracellulare,” “Mycobacterium avium complex,” “macrolide,” “azithromycin,” “clarithromycin,” “rifampin,” “rifabutin,” and “ethambutol.” The literature was restricted to publication in English until 31 July 2016.
The titles and abstracts in all reference lists were reviewed by 2 independent investigators (N. K. and J. P.), and the studies that reported the treatment outcomes of MAC-LD became the subjects of a full-text review.
The inclusion criteria for data extraction were as follows. First, all study patients could be diagnosed with MAC-LD using the criteria suggested by the American Thoracic Society (ATS)/Infectious Diseases Society of America (IDSA) [1]: Mycobacterium avium or M. intracellulare was confirmed from a submitted respiratory specimen or tissue with respiratory symptoms and typical radiologic features on a chest radiograph or high-resolution computed tomography image, and other diagnoses were excluded. Second, all study patients were treated with macrolide-containing regimens, which comprised newer macrolides such as clarithromycin or azithromycin with companion drugs. Third, the treatment outcomes of the included patients were accessible and included sputum culture results.
We only included randomized controlled trials (RCTs) and observational studies published in peer-reviewed journals. We excluded studies with <10 patients, with patients infected by human immunodeficiency virus (HIV), with pediatric patients, with patients refractory to previous treatment, with macrolide monotherapy, with a mean treatment duration <6 months, and with insufficient information about treatment outcomes. Conference abstracts, editorials, and reviews were also excluded.
Definition of Treatment Outcomes
We defined treatment success as 12 months of sustained culture negativity while on treatment as suggested by the ATS/IDSA [1]. We also accepted those studies that defined treatment success as 10 months of sustained culture negativity [9]. Based on the assumption that patients with MAC-LD should achieve culture conversion within 12 months [1] and that the treatment duration is usually extended to 18–24 months [9], treatment success was also defined as achievement of culture conversion and completion of the planned treatment without relapse while on treatment. If patients discontinued the treatment before 6–12 months of therapy or were lost to follow-up for any reason, we considered them to have defaulted from the treatment. An adverse event was defined as an event that resulted in discontinuation or a decrease in the dosage of macrolides as well as ascertainment in the medical record that the culprit of the adverse event was a macrolide.
Data Extraction and Quality Assessment
Two investigators (N. K. and J. P.) independently retrieved data from the selected studies. Discrepancies were resolved by reaching a consensus with discussion. The following variables were extracted: study design, study period, country of study, patient characteristics (mean or median age, sex ratio, history of treatment, and proportion of fibrocavitary or nodular bronchiectatic disease), detailed treatment protocol (drugs used, dosage, administration schedule, and treatment duration), and treatment outcome (number of patients who initiated medical treatment, who defaulted before completing at least 6–12 months of treatment, and who experienced adverse reactions that were caused by a macrolide and necessitated a dosage decrease or discontinuation).
We assessed the risk of bias and methodological quality of all included studies. The Cochrane Collaboration tool for methodological assessment of quality was used for the RCTs [10]. The items were as follows: random sequence generation, allocation concealment, blinding of participants and personnel, blinding of outcome assessment, incomplete outcome data, and selective reporting. Studies other than RCTs were evaluated with the Newcastle-Ottawa Scale [11] as previously recommended [10]. Because all included studies except 1 [12] were based on a single arm without a control group, the scale was modified with reference to a previous report that described treatment outcomes of single-arm studies [13]. The indicators of high-quality studies were high representativeness of patients with MAC-LD, ascertainment of macrolide use, baseline results of macrolide susceptibility tests, confirmation of MAC through mycobacterial culture, explicit treatment outcome assessment by culture results, adequate treatment duration (intention to treat for ≥12 months), and adequacy of follow-up after initiation of treatment (loss of follow-up of <30%). Quality assessment was initially performed by 1 investigator (N. K.), and the results were reviewed by the other investigator (J. P.).
Statistical Analysis
We calculated the proportion of patients who achieved treatment success, defaulted from treatment, and discontinued or decreased the dosage of macrolides because of adverse events.
Variance stabilization was allowed using Freeman-Tukey double arcsine transformation, and pooled estimates with 95% confidence intervals (CIs) for the proportion were obtained using a DerSimonian and Laird random-effects analysis [14]. Heterogeneity across the studies was estimated with the I2 statistic [15] and Cochran Q [16]. To minimize heterogeneity, subgroup analyses stratified by study design, ethnicity, disease type, availability of injectable drugs, history of prior anti-TB or -MAC treatment, and dosing schedule were performed. Potential for publication bias was assessed using funnel plots and Egger test [17]. Stata version 13.0 software (StataCorp, College Station, Texas) was used for all statistical analyses.
RESULTS
Study Selection
We identified a total of 3551 records through the literature search. After removal of duplicate articles, the titles and abstracts of 2889 references were screened. Of these, 106 articles were selected for a full-text review. After the full-text review, 16 studies [12, 18–32] that described the treatment outcomes of macrolide-containing regimens were chosen for the meta-analysis. An additional 6 studies [33–38] that recorded the outcomes of non-macrolide-containing regimens were retained for supplementary analysis comparing their treatment outcomes with those of the macrolide-containing regimens (Figure 1).
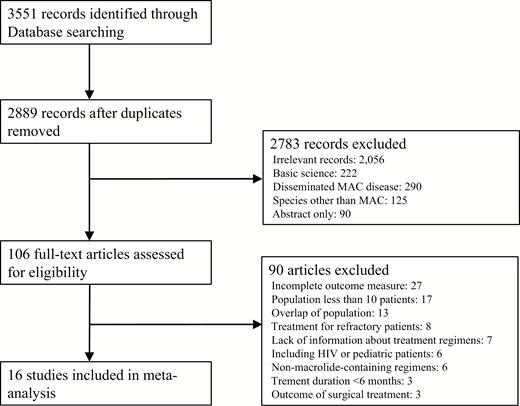
Preferred Reporting Items for Systematic Reviews and Meta-Analyses (PRISMA) flowchart for inclusion of studies in the meta-analysis. Abbreviations: HIV, human immunodeficiency virus; MAC, Mycobacterium avium complex.
Characteristics of Included Studies
The 16 studies comprised 2 RCTs [12, 24], 6 prospective cohort studies [18–20, 22, 23, 27], and 8 retrospective cohort studies [21, 25, 26, 28–32]. The study period ranged from 1990 to 2012 (Table 1). Five studies were conducted in Japan [12, 22, 24, 25, 30], 4 in the United States [20, 21, 23, 31], 3 in the Republic of Korea [26–28], 2 in France [18, 19], 1 in Canada [32], and 1 in Brazil [29]. The mean age of the patients ranged from 55.4 years [18] to 69.0 years [12], and the proportion of female patients ranged from 40.5% [26] to 93.5% [21]. Two studies [21, 25] excluded patients with preexisting lung diseases while other studies included such patients. Eleven studies [18–20, 22–24, 26–30] included patients with a history of previous anti-TB or anti-MAC treatment. Patients from 4 studies [18, 19, 29, 32] were treated with a regimen that differed from the current recommendation [1], although a macrolide was included. The median duration of treatment ranged from 12.0 months [12] to 28.4 months [7]. Three studies [23, 28, 31] included patients treated with a thrice-weekly regimen as well as patients treated with a daily regimen. The dosage of clarithromycin ranged from 400 to 2000 mg/day, and that of azithromycin ranged from 250 to 600 mg/day. Six studies [23, 27–29, 31, 32] used the definition of treatment success suggested by the ATS/IDSA [1].
Characteristics of Studies Included in the Meta-analysis
| No. of Drugs Used | Author, Publication Year | Study Period | Region | Study Design | Sample Size, No. | Treatment Regimen | Definition of Culture Conversion |
|---|---|---|---|---|---|---|---|
| 2 | Dautzenberg, 1995 [19] | 1990–1992 | France | Prospective cohort | 45 | CLR + CLOF | Persistently negative cultures by month 6–12 |
| 3 | Roussel, 1998 [18] | 1992–1994 | France | Prospective cohort | 50 | CLR + minocycline + CLOF | Persistently negative cultures after a minimum of 6 mo of treatment |
| Huang, 1999 [21] | 1995–1997 | United States | Retrospective cohort | 24 | CLR + EMB + RFP or Rfb | Negative cultures | |
| Hasegawa, 2009 [25] | 1999–2004 | Japan | Retrospective cohort | 38 | CLR + EMB + RFP | Negative cultures | |
| Fujita, 2012 [12] | 2001–2004 | Japan | Randomized controlled | 27 | CLR + EMB + RFP or GFX + RFP + EMB | 3 consecutive negative cultures | |
| Ito, 2014 [30] | 2007–2011 | Japan | Retrospective cohort | 72 | CLR + EMB + RFP | 3 consecutive negative cultures | |
| Jarand, 2016 [32] | 1990–2009 | Canada | Retrospective cohort | 143 | CLR or AZM + EMB + CLOF or RFP | Negative cultures | |
| 3 + optional use of injectable drugs | Kobashi, 2007 [24] | 1998–2004 | Japan | Randomized controlled | 146 | CLR + EMB + RFP ± SM | 3 consecutive negative cultures within 6 mo |
| Kim, 2011 [26] | 2005–2008 | Republic of Korea | Retrospective cohort | 57 | CLR + EMB + RFP ± SM | 3 consecutive negative cultures during the treatment period | |
| Koh (Kwon), 2012 [27] | 2000–2009 | Republic of Korea | Prospective cohort | 330 | CLR + EMB + RFP ± SM | 3 consecutive negative cultures within 6 mo | |
| Koh (Shin), 2012 [28] | 2010–2011 | Republic of Korea | Retrospective cohort | 114 | CLR + EMB + RFP ± SM (daily or thrice-weekly) | 3 consecutive negative cultures | |
| Wallace, 2014 [31] | 2000–2012 | United States | Retrospective cohort | 207 | CLR or AZM + EMB + RFP ± SM (daily or thrice-weekly) | ≥3 consecutive negative cultures over a minimum of 3 mo | |
| 4 | Wallace, 1996 [20] | 1992–994 | United States | Prospective cohort | 50 | CLR + EMB + RFP or Rfb + SM | 3 consecutive negative cultures |
| Griffith, 2001 [23] | ND | United States | Prospective cohort | 103 | AZM + EMB + RFP or Rfb + SM (daily or thrice-weekly) | 3 consecutive negative cultures | |
| de Mello, 2013 [29] | 1993–2011 | Brazil | Retrospective cohort | 45 | CLR + EMB + RFP + AMK, CLR + EMB + FQ + Terizodon CLR + EMB + AMK + FQ | Negative cultures | |
| 5 | Tanaka, 1999 [22] | 1992–1997 | Japan | Prospective cohort | 46 | CLR + EMB + RFP + initial KM and subsequent OFX or LFX | Consecutive negative cultures during a 3-mo period |
Abbreviations: AMK, amikacin; AZM, azithromycin; CLOF, clofazimine; CLR, collectin receptor; EMB, ethambutol; FQ, fluoroquinolone; GFX, gatifloxacin; KM, kanamycin; LFX, levofloxacin; OFX, ofloxacin; RFP, rifampin; Rfb, rifabutin; SM, streptomycin.
Study Quality
The risk of bias was assessed separately according to the study design. The 2 RCTs [12, 24] had a low risk of bias in terms of random sequence generation, allocation concealment, incomplete outcome data, and selective reporting. However, blinding of outcome assessment was not fulfilled in either study, and blinding of the participants and study personnel was not reported in 1 of them [12]. Nine studies [18, 20–23, 25, 28, 30, 31] had a low risk of bias in all aspects. Five studies [19, 26, 27, 29, 32] did not report the results of macrolide susceptibility testing, and 1 [29] of these studies did not include detailed follow-up data after treatment.
Treatment Outcomes of Macrolide-Containing Regimens
The treatment outcomes of 1462 patients from 16 studies were assessed, and 869 patients met the criteria for treatment success. The weighted proportion of treatment success was 60.0% (95% CI, 55.1%–64.8%). The heterogeneity of the effect estimate (I2) was 69.4% of the variance, and the P value (Cochran Q test) was <.001 (Figure 2). The treatment outcomes of non-macrolide-containing regimens from 7 studies [12, 33–38] were also assessed, and the weighted proportion of treatment success among 270 patients was 53.6% (95% CI, 38.0%–69.3%). The heterogeneity of the effect estimate (I2) was 86.5% of the variance, and the P value (Cochran Q test) was <.001.
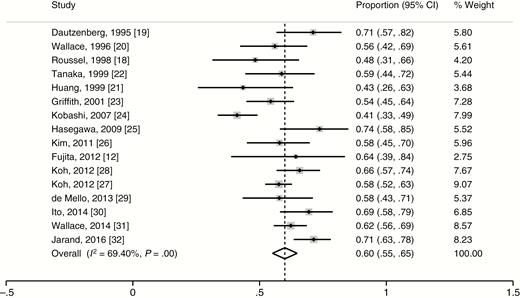
Weighted proportion of treatment success for selected studies. Abbreviation: CI, confidence interval.
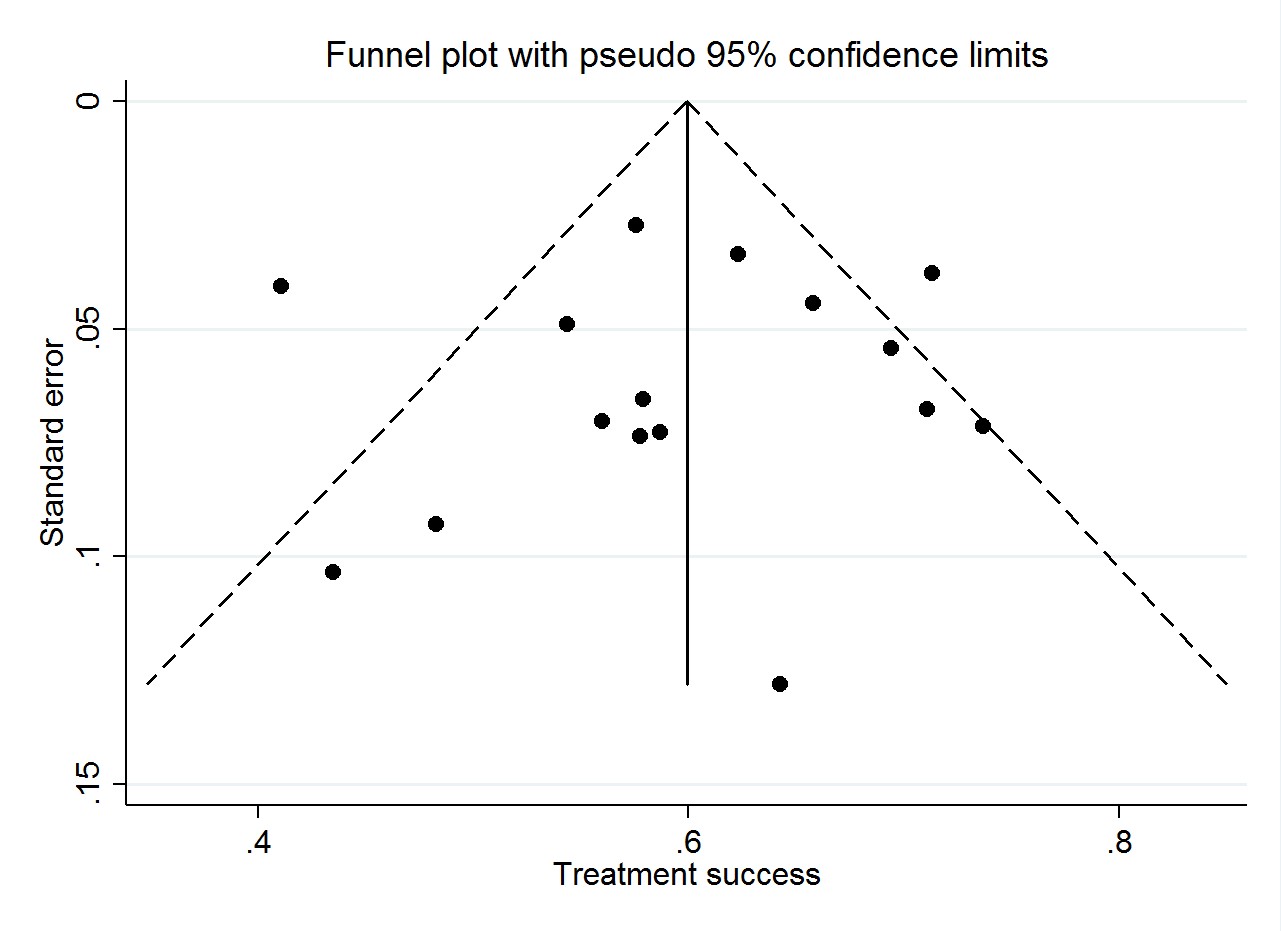
In the subgroup analyses within the macrolide-containing regimens, the treatment success rate of patients from the RCTs [12, 24] (43.2% [95% CI, 35.6%–50.8%]) was lower than that of the other observational studies [18–23, 25–32] (61.9% [95% CI, 59.3%–64.5%]). The treatment success rate was 65.7% (95% CI, 58.3%–73.1%) when ≤3 drugs were used [12, 18, 19, 21, 25, 30, 32], 56.9% (95% CI, 48.8%–65.0%) when injectable drugs could be used at the discretion of physicians in addition to 3-drug regimens [24, 26–28, 31], and 56.2% (95% CI, 49.9%–62.4%) when ≥4 drugs were used [20, 22, 23, 29]. Patients with nodular bronchiectasis [25, 31] had a treatment success rate of 66.3% (95% CI, 55.7%–76.9%). Because no study included only patients with fibrocavitary disease, we calculated the treatment outcomes in studies with a proportion of patients with fibrocavitary disease of >50% of the total patients [20, 29]. In those studies, the treatment success rate was 56.8% (95% CI, 46.0%–66.8%). The treatment success rate for the patients with a history of anti-TB or anti–MAC-LD treatment [18–20, 22–24, 26–30] was 58.0% (95% CI, 52.4%–63.5%), while that of treatment-naive patients was 65.6% (95% CI, 54.1%–77.2%) [12, 21, 25, 32] (Table 2). The P value of .971 was derived from Egger test. The symmetry of the funnel plot (Supplementary Figure 1) and the result of Egger test showed no evidence of publication bias.
Subgroup Analysis of Macrolide-Containing Regimens
| Subgroup, by Analysis | Studies, No. | Proportion of Treatment Success (95% CI) | P Value | Heterogeneity | |
|---|---|---|---|---|---|
| I2, % | P Value | ||||
| Study design | |||||
| Randomized controlled trials | 2 | 0.43 (.36–.51) | <.01 | 98.8 | <.01 |
| Nonrandomized controlled trials | 14 | 0.62 (.58–.66) | <.01 | 48.6 | .02 |
| Total | 16 | 0.60 (.55–.65) | <.01 | 69.4 | <.01 |
| No. of drugs used | |||||
| ≤3 | 7 | 0.66 (.58–.73) | <.01 | 49.7 | .06 |
| 3 + optional use of injectable drugs | 5 | 0.57 (.49–.65) | <.01 | 81.6 | <.01 |
| ≥4 | 4 | 0.56 (.50–.62) | <.01 | 0.0 | .96 |
| Total | 16 | 0.60 (.55–.65) | <.01 | 69.4 | <.01 |
| Availability of injectable drugs | |||||
| Available | 9 | 0.57 (.52–.62) | <.01 | 63.8 | <.01 |
| Nonavailable | 7 | 0.66 (.58–.73) | .002 | 49.7 | .06 |
| Total | 16 | 0.60 (.55–.65) | <.01 | 69.4 | <.01 |
| Disease type | |||||
| Nodular bronchiectatic patients only | 2 | 0.66 (.56–.77) | <.01 | 51.7 | .18 |
| Fibrocavitary dominant (>50% of population) | 2 | 0.57 (.47–.67) | <.01 | 0.0 | .86 |
| Mixed type | 12 | 0.59 (.53–.65) | <.01 | 75.1 | <.01 |
| Total | 16 | 0.60 (.55–.65) | <.01 | 69.4 | <.01 |
| Prior antituberculosis or anti-MAC treatment | |||||
| Included | 11 | 0.58 (.52–.64) | <.01 | 66.7 | <.01 |
| Excluded | 4 | 0.66 (.54–.77) | <.01 | 57.4 | .07 |
| Total | 15 | 0.60 (.54–.65) | <.01 | 71.1 | <.01 |
| Ethnicity | |||||
| Asian | 8 | 0.60 (.53–.69) | <.01 | 76.5 | <.01 |
| Non-Asian | 8 | 0.60 (.54–.66) | <.01 | 58.3 | .02 |
| Total | 16 | 0.60 (.55–.65) | <.01 | 69.4 | <.01 |
| Dose administration | |||||
| Daily treatment | 13 | 0.60 (.53–.66) | <.01 | 73.5 | <.01 |
| Daily and thrice-weekly treatment | 3 | 0.61 (.55–.67) | <.01 | 36.0 | .21 |
| Total | 16 | 0.60 (.55–.65) | <.01 | 69.4 | <.01 |
Abbreviations: CI, confidence interval; MAC, Mycobacterium avium complex.
Default From Treatment and Adverse Events Caused by Macrolide-Containing Regimens
The proportion of patients who defaulted from treatment was calculated from 1185 patients of 12 studies [18–23, 25–28, 31, 32]. The pooled estimate of the default rate was 16.0% (95% CI, 12.3%–19.7%) with substantial heterogeneity (I2 = 63.5%, P < .01 [Cochran Q test]). In the subgroup analysis, the patients who were treated with daily drug administration [18–22, 25–27, 32] had a default rate of 19.0% (95% CI, 13.2%–24.7%). The default rate of patients who were treated thrice weekly [23, 28, 31] was 12.0% (95% CI, 8.9%–15.0%) without heterogeneity across the studies (I2 = 0.0%, P = .81 [Cochran Q test]) (Supplementary Figure 2).
Adverse events related to macrolide were reported in 7 studies involving 344 patients [12, 18–20, 22, 23, 26]. The proportion of patients who discontinued or decreased the dosage of macrolides because of adverse events related to the macrolides was 6.4% (95% CI, 3.2%–9.5%) with moderate heterogeneity (I2 = 30.5%, P = .20 [Cochran Q test]) (Figure 3). Among all 26 patients with adverse events, the most common manifestation was decreased auditory acuity (11 patients), followed by gastrointestinal disturbance (7 patients), hepatitis (6 patients), skin rash (1 patient), and arrhythmia (1 patient).
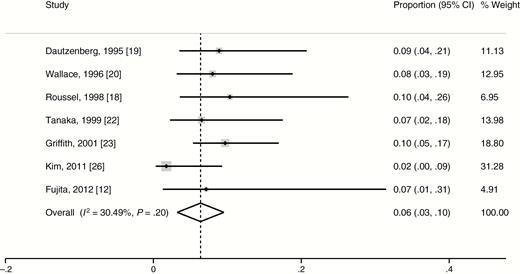
Weighted proportion of adverse events for selected studies. Abbreviation: CI, confidence interval.
DISCUSSION
Since the 1990s, the use of newer macrolides has been recommended for the treatment of MAC-LD [1, 9]. Contrary to anti-TB drugs, which were historically used for MAC-LD, clarithromycin and azithromycin have shown a favorable correlation between in vitro and clinical activity against MAC [1]. Because macrolide monotherapy is associated with the emergence of macrolide resistance, current guidelines recommend the use of macrolides with companion drugs such as rifampin, ethambutol, and streptomycin [1, 9]. However, the treatment outcomes of macrolide-containing regimens have not been clearly elucidated.
The scarcity of RCTs of treatments for MAC-LD has made it difficult to elucidate the effectiveness of macrolide-containing regimens. Furthermore, the variation of definitions of treatment success has led to inconsistent results. For example, some studies [23, 31] defined a favorable outcome as 12 months of culture negativity while undergoing treatment, whereas other studies used the definition of “alive and cured at 5 years after treatment” [39, 40]. The inconsistent definition of treatment outcomes has resulted in widely variable treatment success rates of macrolide-containing regimens ranging from 31% to 84%.
To more accurately elucidate the treatment outcomes of MAC-LD, we performed a meta-analysis of RCTs and observational studies using strict criteria of treatment success: either 12 months of sustained culture negativity while undergoing therapy or achievement of culture conversion and completion of the planned treatment without relapse. The treatment success rate of macrolide-containing regimens was 60.0%. Many studies [22, 25, 28] reported treatment outcomes after excluding patients who discontinued the treatment within 6–12 months after treatment initiation. When we excluded those patients from our analysis, the treatment success rate increased to 73.8% (95% CI, 65.7%–81.9%). In subgroup analysis, the number of drugs used showed an inverse correlation with treatment success rate, although there was no statistical significance. The severity of diseases that needed more drugs could confound a true correlation between numbers of drugs used and treatment outcomes.
We also calculated the treatment outcomes of previously used non-macrolide-containing regimens. Because most studies of non-macrolide-containing regimens were published before the mid-1990s and contained insufficient information on treatment outcomes, only 7 studies could be included in the present meta-analysis. The treatment success rate was 53.6% across the studies that used non-macrolide-containing regimens. Although a direct comparison of this success rate with that of the macrolide-containing regimens was not possible because of the absence of a common comparator [41], the treatment success rate of macrolide-containing regimens (60.0%) does not seem to be much higher than that of non-macrolide-containing regimens (53.6%). The observation that about half of the untreated MAC-LD patients, whose stable status did not necessitate treatment, achieved spontaneous culture conversion [42] suggests that the treatment itself might be not as effective as expected.
A long duration of treatment with multiple drugs is inevitably accompanied by considerable rates of treatment default. Treatment of multidrug-resistant TB is one example of this clinical scenario [43]. In the present analysis, the overall default rate was 16.0%. The subgroup analysis of studies with a thrice-weekly dosing schedule as an available option showed a 12.0% default rate. This result supports the current recommendation of a thrice-weekly treatment regimen for nodular bronchiectatic disease.
A large percentage of patients with NTM-LD are aged ≥50 years, and these elderly patients are prone to adverse effects associated with macrolide [1]. Our analysis showed a 6.4% rate of macrolide-associated adverse events that required treatment discontinuation or dosage adjustment. Interestingly, the most common adverse event was decreased auditory acuity, although detailed analysis on their severity could not be made; this is contrary to the belief that the most common adverse event might be gastrointestinal problems [1]. In fact, the relationship between hearing impairment and macrolide use for MAC treatment has been already elucidated in HIV patients [44, 45]. Thus, clinicians should carefully evaluate the auditory function of patients with NTM-LD undergoing treatment with macrolides.
Our study has several limitations. First, we confirmed moderate or substantial heterogeneity among the studies. The inclusion of observational studies should introduce heterogeneity because of the increased likelihood of methodological diversity [10]. Second, we planned to resolve unanswered questions about MAC treatment such as the superiority of clarithromycin vs azithromycin and of rifabutin vs rifampin as well as the role of injectable drug [1]. However, these analyses could not be performed because no head-to-head comparison trials were available.
In conclusion, the treatment outcomes of macrolide-containing regimens were relatively poor, with a success rate of 60.0% and default rate of 16.0%. The default rate could be reduced if a thrice-weekly dosing schedule is available. Clinicians should be aware of decreased auditory function as the most common adverse event associated with macrolide-containing regimens. Stronger, shorter, and safer treatment regimens are warranted for the treatment of MAC-LD.
Supplementary Data
Supplementary materials are available at Clinical Infectious Diseases online. Consisting of data provided by the authors to benefit the reader, the posted materials are not copyedited and are the sole responsibility of the authors, so questions or comments should be addressed to the corresponding author.
Notes
Author contributions. Study concept and design: N. K., E. K., C. H. L., and J. J. Y. Literature search: N. K., J. P. Data collection and interpretation: N. K., J. P., E. K., C. H. L., and J. J. Y. Statistical analysis: N. K., E. K., C. H. L., and J. J. Y. Manuscript writing: N. K., J. P., E. K., C. H. L., S. K. H., and J. J. Y. Critical revision of manuscript: C. H. L. and S. K. H. Study supervision: C. H. L., S. K. H., and J. J. Y.
Financial support. This work was supported by the Seoul National University College of Medicine Research Fund (grant number 2320160070).
Potential conflicts of interest. All authors: No reported conflicts of interest. All authors have submitted the ICMJE Form for Disclosure of Potential Conflicts of Interest. Conflicts that the editors consider relevant to the content of the manuscript have been disclosed.
References


Comments