


Abstract
Before 1945, Streptococcus pneumoniae caused more than 90% of cases of pneumonia in adults. After 1950, the proportion of pneumonia caused by pneumococcus began to decline. Pneumococcus has continued to decline; at present, this organism is identified in fewer than fewer10%–15% of cases. This proportion is higher in Europe, a finding likely related to differences in vaccination practices and smoking. Gram-negative bacilli, Staphylococcus aureus, Chlamydia, Mycoplasma, and Legionella are each identified in 2%–5% of patients with pneumonia who require hospitalization. Viruses are found in 25% of patients, up to one-third of these have bacterial coinfection. Recent studies fail to identify a causative organism in more than 50% of cases, which remains the most important challenge to understanding lower respiratory infection. Our findings have important implications for antibiotic stewardship and should be considered as new policies for empiric pneumonia management are developed.
Pneumonia, at first called “the special enemy of old age” [1] by Osler and later, by a more mature Osler, “the friend of the aged” [2], has long been with humankind and shows little likelihood of going away. In the preantibiotic era, Streptococcus pneumoniae was the overwhelmingly predominant cause of pneumonia, but this is clearly no longer the case. Despite its prevalence and importance—pneumonia affects about 2% of all elderly persons each year [3]—and despite newly available techniques for diagnosis, at the present time and in the majority of cases, the causative organism(s) remain(s) uncertain.
How does such an evolution occur? For recognized or unrecognized reasons, there may be changes in the actual incidence of a disease. Rheumatic fever began to decline in the late 1920s, well before the introduction of antibiotics, and auxotrophic strains of Neisseria gonorrhoeae that made acute arthritis an everyday occurrence in public hospitals in the early 1980s have largely disappeared. Newly discovered organisms may cause disease, and new diagnostic techniques may increase recognition of already-identified diseases. Raised awareness of a condition may lead to more diagnostic testing and increased documentation.
Here, we document the declining role of S. pneumoniae and the increasing recognition of other pathogens in the etiology of community acquired pneumonia (CAP) in adults.
LITERATURE ANALYSIS
A PubMed search of the English-language literature through December 2015 was performed using the following search term: (pneumonia[title]) AND (etiolog* OR aetiolog* OR cause OR microbiolog* OR “Streptococcus pneumoniae”[Mesh] OR bacteria OR culture*) NOT (children OR infant* OR pediatric* OR randomized OR nosocomial[title] OR organizing[title] OR interstitial[title] OR healthcare[title] OR ventilator[title] OR Case Reports[ptyp]). The references of included studies were also searched for candidate articles. We included studies that applied validated pneumococcal tests to ≥50% of patients. The following were considered evidence of pneumococcal infection: S. pneumoniae cultured from a sterile site or from a lower respiratory tract specimen (ie, not a nasopharyngeal specimen), including recovery after mouse intraperitoneal inoculation; pneumococcal antigen detection in urine; and polymerase chain reaction (PCR) testing of pleural fluid. Studies that focused on a specific population (eg, the elderly or immunocompromised) were excluded. See Supplementary Material for details. We identified 31 studies (21120 patients) from the United States and Canada published between 1917 and 2015 and 37 studies (21166 patients) from Europe. We included all publications that met our inclusion criteria [4–71] (Table 1).
Frequency of Streptococcus pneumoniae in Community-Acquired Pneumonia in Included Studies
| Study | Location | Year(s) ofStudy | No. ofPatientsa | Pneumococcal Community-Acquired Pneumonia | |
|---|---|---|---|---|---|
| n | % | ||||
| United States/Canada | |||||
| Avery 1917 [4] | United States | NR | 529 | 454 | 85.8 |
| Cecil 1922 [5] | United States | 1920 | 1000 | 834 | 83.4 |
| Sutliff 1933 [6] | United States | NR | 1067 | 996 | 93.3 |
| Bullowa 1937 [7] | United States | 1928–1936 | 4416 | 3591 | 81.3 |
| Cecil 1938 [8] | United States | 1928–1938 | 560 | 531 | 94.8 |
| Warner 1945 [9] | United States | 1943–1944 | 150 | 139 | 92.7 |
| Warner 1948 [10] | United States | 1944–1946 | 202 | 172 | 85.1 |
| Dowling 1948 [11] | United States | NR | 2500 | 2453 | 98.1 |
| Tillotson 1969 [12] | United States | 1967 | 149 | 84 | 56.4 |
| Fiala 1969 [13] | United States | 1966–1967 | 193 | 107 | 55.4 |
| Fekety 1971 [14] | United States | 1965–1966 | 100 | 62 | 62.0 |
| Dorff 1973 [15] | United States | 1969–1970 | 148 | 79 | 53.4 |
| Moore 1977 [16] | United States | 1971–1972 | 154 | 65 | 42.2 |
| Oseasohn 1978 [17] | United States | 1971–1972 | 187 | 171 | 91.4 |
| 1972–1973 | |||||
| Miller 1978 [18] | United States | 1975 | 54 | 26 | 48.1 |
| Ebright 1980 [19] | United States | 1973 | 106 | 38 | 35.8 |
| Boerner 1982 [20] | United States | NR | 89 | 32 | 36.0 |
| Dans 1984 [21] | United States | 1979–1980 | 147 | 51 | 34.7 |
| Marrie 1985 [22] | Canada | 1981–1982 | 138 | 13 | 9.4 |
| Larsen 1984 [23] | United States | 1981–1982 | 217 | 52 | 24.0 |
| Fang 1990 [24] | United States | 1986–1987 | 359 | 55 | 15.3 |
| Farr 1991 [25] | United States | 1984–1986 | 245 | 45 | 18.4 |
| Bates 1992 [26] | United States | 1985 | 154 | 9 | 5.8 |
| Mundy 1995 [27] | United States | 1990 | 205 | 31 | 15.1 |
| Marston 1997 [28] | United States | 1991 | 2776 | 351 | 12.6 |
| Fine 1999 [29] | United States, Canada | 1991–1994 | 1551 | 158 | 10.2 |
| Park 2001 [30] | United States | 1994–1996 | 389 | 46 | 11.8 |
| Yang 2005 [31] | United States | 2001–2003 | 131 | 30 | 22.9 |
| Restrepo 2008 [32] | United States | 1999–2002 | 730 | 60 | 8.2 |
| Musher 2013 [33] | United States | 2011–2012 | 215 | 19 | 8.8 |
| Jain 2015 [34] | United States | 2010–2012 | 2259 | 115 | 5.1 |
| Europe | |||||
| Hug 2001 [35] | Switzerland | 1998–1998 | 293 | 30 | 10.2 |
| Garbino 2002 [36] | Switzerland | 1997–1999 | 318 | 40 | 12.6 |
| Genne 2006 [37] | Switzerland | 1999–2000 | 67 | 25 | 37.3 |
| Piso 2012 [38] | Switzerland | 2007–2008 | 139 | 39 | 28.1 |
| Stralin 2010 [39] | Sweden | 1999–2002 | 235 | 74 | 31.5 |
| Johansson 2010 [40] | Sweden | 2004–2005 | 184 | 53 | 28.8 |
| Pareja 1992 [41] | Spain | NR | 165 | 12 | 7.3 |
| Almirall 1993 [42] | Spain | 1990–1991 | 105 | 13 | 12.4 |
| Lorente 2000 [43] | Spain | 1996–1998 | 110 | 40 | 36.4 |
| Almirall 2000 [44] | Spain | 1993–1995 | 232 | 27 | 11.6 |
| Gutierrez 2005 [45] | Spain | 1999–2001 | 493 | 101 | 20.5 |
| Andreo 2006 [46] | Spain | 2000 | 107 | 35 | 32.7 |
| Briones 2006 [47] | Spain | 2000–2004 | 959 | 290 | 30.2 |
| Fernandez Alvarez 2007 [48] | Spain | 1995–1998 | 258 | 14 | 5.4 |
| 2003–2006 | 229 | 17 | 7.4 | ||
| 1999–2002 | 268 | 11 | 4.1 | ||
| Falguera 2009 [49] | Spain | 1995–2005 | 3272 | 972 | 29.7 |
| Cilloniz 2011 [50] | Spain | 1996–2008 | 3523 | 613 | 17.4 |
| Sorde 2011 [51] | Spain | 2007–2008 | 474 | 177 | 37.3 |
| Capelastegui 2012 [52] | Spain | 2006–2007 | 700 | 170 | 24.3 |
| Viasus 2013 [53] | Spain | 2010–2011 | 747 | 118 | 15.8 |
| Tudose 2010 [54] | Romania | 2008–2010 | 120 | 11 | 9.2 |
| Roysted 2016 [55] | Norway | 2007–2008 | 374 | 75 | 20.1 |
| Boersma 1991 [56] | Netherlands | 1987–1989 | 87 | 34 | 39.1 |
| Bohte 1995 [57] | Netherlands | 1991–1993 | 334 | 90 | 26.9 |
| Endeman 2008 [58] | Netherlands | 2004–2006 | 201 | 60 | 29.9 |
| Huijts 2014 [59] | Netherlands | 2008–2009 | 1057 | 332 | 31.4 |
| Ruf 1989 [60] | Germany | 1984–1985 | 442 | 68 | 15.4 |
| Kothe 2008 [61] | Germany | 2003–2005 | 2647 | 130 | 4.9 |
| Levy 1988 [62] | France | 1983–1984 | 116 | 30 | 25.9 |
| Lehtomaki 1988 [63] | Finland | 1983–1984 | 106 | 26 | 24.5 |
| Hohenthal 2008 [64] | Finland | 1999–2004 | 384 | 107 | 27.9 |
| Leesik 2006 [65] | Estonia | 1996–1998 | 439 | 54 | 12.3 |
| White 1981 [66] | England | 1974–1980 | 210 | 24 | 11.4 |
| Bewick 2012 [67] | England | 2008–2010 | 920 | 366 | 39.8 |
| Ostergaard 1993 [68] | Denmark | NR | 254 | 39 | 15.4 |
| Marekovic 2008 [69] | Croatia | NR | 80 | 23 | 28.8 |
| Blasi 1993 [70] | Italy | 1991–1992 | 108 | 10 | 9.3 |
| Logroscino 1999 [71] | Italy | 1994–1996 | 409 | 36 | 8.8 |
Abbreviation: NR, not reported.
aSee Supplementary Material for details on inclusion criteria.
PREANTIBIOTIC ERA
In the preantibiotic era, S. pneumoniae caused approximately 90% of all cases of pneumonia [4, 72–74] (Figure 1A). Streptococcus pyogenes, Klebsiella, Haemophilus influenzae, and Staphylococcus aureus were identified in the remaining cases; in fewer than 5%, no bacterial cause could be found. In the preantibiotic era, no antibiotic would have interfered with a bacteriologic diagnosis, and, compared to current practice, clinicians made greater efforts to obtain sputum samples for culture. Of course, pneumonia due to influenza virus had been recognized for quite some time [75]. Modern studies of patients who died in the 1918 influenza epidemic suggest that most of those deaths were, in fact, associated with secondary bacterial infection [76]. Outbreaks of pneumonia, thought to be viral and later identified as adenoviral [77], occurred in young adults, especially in military settings where crowding and physical and mental exhaustion were prevalent.
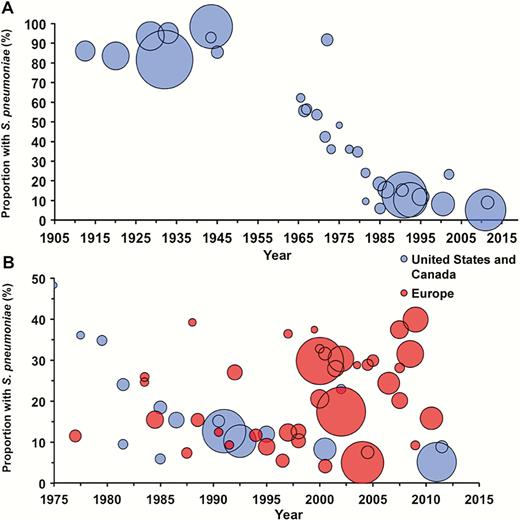
A, Frequency of Streptococcus pneumoniae as a cause of community-acquired pneumonia, United States/Canada. B, Comparison of the frequency of S. pneumoniae between the United States/Canada (blue) and Europe (red). The area of each circle is proportional to the number of patients in each study. For both figures, the year is the reported (or estimated) midyear of investigation (see Supplementary Material for details).
In the late 1930s, a pneumonia that behaved differently from pneumococcal pneumonia was attributed to an “atypical agent” [78, 79], subsequently called Eaton agent [80, 81] and eventually identified as Mycoplasma pneumoniae [82]. Recognized cases, documented by culture, nearly always occurred in children, teenagers, and young adults (eg, military recruits [80]). Older adults were largely unaffected [83, 84], an observation that later came to be overlooked when diagnosis began to rely on serologic techniques. As a result, Mycoplasma pneumonia came to be greatly overdiagnosed. During World War II, an Armed Forces Commission, established to investigate outbreaks of pneumonia in military forces, identified the following 4 kinds of pneumonia: pneumococcal, mycoplasmal, influenzal, and acute respiratory disease of recruits, later shown to be adenoviral [85]. Nevertheless, pneumococcus was still regarded as the principal cause. In fact, through its 12th (1967) edition, the Cecil-Loeb Textbook of Medicine covered the subject of pneumonia under the rubric “Bacterial diseases: pneumococcal pneumonia” [86]. Although other causes were cited, “pneumococcal pneumonia … [remained] the most important of all pneumonias, not only in numerical terms, but because … [it was] the prototype of all the bacterial pneumonias” [86].
EARLY ANTIBIOTIC ERA THROUGH 1990
Pneumococcus
Our literature search revealed no pneumonia studies reporting the etiologic spectrum from 1947 through 1964. In 1965–1966, a report from Johns Hopkins Hospital [14] implicated pneumococcus in 62% of cases. No cause was found in 34%, and no case was attributed to H. influenzae, but chocolate agar was not used routinely to culture sputum until the 1970s. In 1971–1972, at the same hospital [16], an “aggressive” approach to diagnosis identified pneumococcus in 30% of cases. Haemophilus influenzae was cultured from sputum in 29%. However, because only 1 patient was bacteremic, the authors stated that the “others can not critically be called Haemophilus pneumonia.” By 1979–1980 and 1990–1991, reports from Johns Hopkins Hospital implicated pneumococcus in 35% [21] and 15% [27] of cases, respectively.
Anaerobic Flora
In the 1970s attention was directed toward anaerobic flora of the mouth and upper respiratory tract as a potential cause of pneumonia. In 1898 Veillon implicated anaerobic bacteria in lung infection [87]; their importance as the most common agents in lung abscess was subsequently emphasized by Smith [88] and confirmed by Cohen [89]. Further development of anaerobic bacteriology by Bartlett, Gorbach, and Finegold [90], together with the use of transtracheal aspiration, showed the importance of these organisms as a cause of pneumonia, especially in patients whose lifestyle suggested aspiration and who presented with a subacute syndrome of respiratory infection characterized by putrid sputum, lung abscess, and/or empyema.
Normal Respiratory Flora
Some adults who present with acute bacterial pneumonia were also shown to be infected by normal facultative or anaerobic organisms [90–98]. More recent reports on the etiology of pneumonia fail to mention these organisms, probably reflecting the failure to use transtracheal aspiration and/or anaerobic microbiology. Microscopic examination of good-quality sputum from patients with pneumonia may show large numbers of gram-positive cocci together with other organisms. Such findings suggest that so-called normal respiratory flora, including the Streptococcus anginosus group, Streptococcus mitis, and/or mixed respiratory flora, may cause a substantial proportion of cases of pneumonia when no recognized respiratory pathogen is identified.
Legionella
An outbreak of pneumonia in 1977 [99] led to identification of Legionella [100]. Implication of Legionella in other outbreaks [101] was soon followed by recognition of this organism as a cause of sporadic pneumonia, both in hospitals [102] and in the community [103, 104]. The relation to water sources [105, 106] and the association with geographical locations [104] was also documented.
Haemophilus influenzae
In 1983, Musher et al [107] showed that H. influenzae commonly caused pneumonia in older men, identifying 30 cases at a single hospital in a 2-year period. Haemophilus from 26 of these patients was nontypable; only 1 of these had associated bacteremia. Four patients had H. influenzae type b in their sputum, of whom 3 were bacteremic.
Chlamydia
In 1986, Grayston et al identified Chlamydia pneumoniae as an important cause of pneumonia in university students [108, 109]. As with Mycoplasma, this organism was not found commonly in older adults with pneumonia, raising question about more recent studies that have used only serologic techniques to implicate it as a common cause of pneumonia in hospitalized adults.
Viruses
During the 1980s, viral cultures of respiratory secretions increasingly documented a causative role for respiratory viruses in pneumonia. The potential importance of parainfluenza [14] and respiratory syncytial viruses [110] in adults was recognized; rhinovirus, coronavirus [111], and human metapneumovirus [112] were added later. Thus, by the end of the 1980s, most microorganisms that are currently known to cause CAP had been identified.
A landmark prospective study of CAP patients admitted to a private hospital, a university hospital, and a veterans’ hospital in Pittsburgh in 1986–1987 [24] used classic bacteriologic techniques and identified pneumococcus in only 15% of cases, followed by Haemophilus in 11%. Serologic studies were positive for Mycoplasma or Chlamydia in 8%. Legionella was detected by antibody rise, immunofluorescence, and/or culture in 7%. Viruses were not sought. No cause was found in one-third of cases. The authors emphasized the decline of pneumococcus as a cause of pneumonia in the antibiotic era.
ANTIBIOTIC ERA WITH NEW TECHNIQUES, 1990–2010
After 2000, new techniques greatly increased the ability to identify respiratory pathogens. Tests to detect antigens of S. pneumoniae and Legionella in urine reliably increased recognition of the role played by these agents [67, 113–117]. Detection of capsular polysaccharides [118] or other pneumococcal constituents such as DNA that encode lytA in sputum or nasal secretions [119] appeared to increase the diagnostic yield. However, these and other nonstandardized techniques may also lead to overdiagnosis [120], and further validation is required before they can be used in diagnosis. There is, however, little question that the availability of PCR has revolutionized our understanding of the role of respiratory viruses in pneumonia in adults.
More recent studies in the United States, that were designed to select a convenience sample of patients or to include patients in a pharmaceutical study (but not a complete evaluation of successive admissions), detected pneumococcus in 10%–14% of adults hospitalized for CAP [121,122] (Figure 1A). During the same period, a greater proportion of cases have been attributed to pneumococcus in Europe than in the United States (Table 2). Lim et al [123] reported an etiologic agent in 75% of cases, including pneumococcus in 48% and “atypical organisms,” principally Chlamydia and Mycoplasma, in 18%. Nearly one-third of pneumococcal diagnoses were made serologically by rises in antibody to various pneumococcal constituents or by counterimmunoelectrophoresis (CIE) to detect capsular polysaccharides in sputum. However, these serologic tests have not been validated, and CIE is regularly positive in sputum that does not contain pneumococci (D. Musher and C. Stager, unpublished). If these serologic results are excluded, pneumococcus was found in 34% of cases. Diagnoses of Chlamydia and Mycoplasma were only made serologically. Interestingly, an earlier study by these same investigators [124] in which no special serologic techniques were used identified an etiologic agent in 54% of cases, with pneumococcus in 30%, Haemophilus in 8%, and “atypical organisms” in 1%. European investigators [125, 126] used only traditional microbiology and detection of pneumococcal cell wall antigen in urine to implicate S. pneumoniae in 37%–38% of cases of CAP.
Etiology of Community-Acquired Pneumonia in Europe, 2001–2010
| Pathogen | Percentage of Patients | ||
|---|---|---|---|
| Englanda [123] | Swedenb [40] | Netherlandsc [126] | |
| Streptococcus pneumoniae | 48 | 38 | 37 |
| Haemophilus | 7 | 11 | 0 |
| Staphylococcus aureus | 1 | 1 | 1 |
| Gram-negative rods | 1 | 1 | 4 |
| Legionella | 3 | 1 | 4 |
| Mycoplasma or Chlamydia | 18 | 8 | 7 |
| Virus | 18 | 29 | 5 |
| No pathogen | 25 | 11 | 44 |
aStandard microbiology, urine pneumococcal antigen (UAg), and serologic tests for pneumococcus and “atypical” organisms.
bStandard microbiology, UAg, polymerase chain reaction on nasopharyngeal swabs and sputum.
cStandard microbiology, UAg, serology for “atypical” organisms.
Our present study shows a marked decline in the frequency with which pneumococcus causes pneumonia in the United States/Canada but no such decline in Europe (Figure 1B). An important limitation of our findings is between-study heterogeneity in patient population, severity of illness, microbiologic tests performed, and the thoroughness of diagnostic testing. We attempted to minimize the latter 2 factors by including only studies that performed pneumococcal testing in a significant proportion of cases. For studies that provided sufficiently granular data, we calculated the frequency of pneumococcal pneumonia by limiting the denominator to only those patients who underwent such testing. Also, we chose a case definition of pneumococcal pneumonia that emphasizes validated microbiologic tests that have been in clinical practice for decades. While an in-depth qualitative analysis is beyond the scope of this article, we provide preliminary evidence to suggest differences between the United States/Canada and Europe with respect to the relative frequency of pneumococcus as a cause of pneumonia.
Factors that contribute to this difference might include the widespread use of pneumococcal polysaccharide vaccine [127] and the decreased rate of cigarette smoking among adults in the United States [128]. The nearly universal administration of pneumococcal conjugate vaccine to US children beginning in 2000 further explains the decline [3]. In Europe and other parts of the world where pneumococcal vaccines have been recommended for routine use for adults and where the incidence of cigarette smoking remains high, pneumococcus remains responsible for a higher proportion of cases of CAP (Figure 1B) [40, 123, 126, 129–131]. Reliance on serologic techniques has probably led to overdiagnosis of Mycoplasma and Chlamydia [132]. As noted above, earlier studies that used culture for diagnosis suggested that these organisms only occasionally infect older adults. These findings have important implications for comparing results of CAP studies or following guidelines for management written on either side of the Atlantic.
STUDIES AFTER 2010
An intensive investigation of the causes of pneumonia included all patients hospitalized for pneumonia at a Veterans Affairs (VA) medical center from July 5, 2011 to June 30, 2012 [33]. Blood culture, urine pneumococcal and Legionella antigen, PCR for 15 respiratory viruses (but not Mycoplasma or Chlamydia), and serum procalcitonin were each performed in more than 95% of cases. Sputum was studied in 70%. Of 259 patients admitted from the emergency department with CAP, 44 (17%) were thought to be uninfected, an observation with important implications for reconciling quality improvement measures that relate to promptness of antibiotic therapy. Of the remaining 215 patients (Table 3), 29% had documented bacterial infection; S. pneumoniae was detected in only 9% of the 215 patients. PCR identified a respiratory virus in 23%. Bacterial and viral coinfection occurred in 6% of cases. Despite an intense search for an etiologic agent, the cause remained unknown in 55%.
Etiology of Community-Acquired Pneumonia, Studies Since 2010
| Pathogen | Percentage of Patients | ||
|---|---|---|---|
| Houston [33] | Centers for Disease Control and Prevention [34] | Netherlands [136] | |
| Bacteria | 29 | 15 | 30 |
| Streptococcus pneumoniae | 9 | 5 | 16 |
| Haemophilus | 6 | <1 | 7 |
| Staphylococcus aureus | 5 | 2 | 3 |
| Pseudomonas | 3 | <1 | 2 |
| Legionella | 1 | 1 | 1 |
| Mycoplasma, Chlamydia | – | <3 | 1 |
| Other | 6 | 3 | 3 |
| Nocardia | 1 | 0 | 0 |
| Mycobacteria | 2 | 1 | <1 |
| Fungi (Pneumocystis) | 3 | 1 | 2 |
| Viruses | 20 | 27 | 3 |
| Rhinovirus | 13 | 9 | – |
| Coronavirus | 3 | 2 | – |
| Human metapneumovirus | 2 | 4 | – |
| Influenza | 1 | 6 | 3 |
| Parainfluenza | 2 | 3 | – |
| Respiratory syncytial virus | 2 | 3 | – |
| No pathogen | 55 | 62 | 66 |
Two subsequent studies (Table 3) yielded similar results. The Centers for Disease Control and Prevention’s EPIC study [34] of more than 2000 patients at 8 medical centers reported an even lower proportion of pneumococcal pneumonia (5% vs 9%) and all bacterial pneumonia (15% vs 29%) than Musher et al [33]. Routine use of PCR for Mycoplasma and Chlamydia confirmed [132] that these organisms are very uncommon causes of CAP leading to hospitalization of adults, suggesting that serologic tests have contributed to marked overdiagnosis. Two more recent studies identified Mycoplasma as a cause of pneumonia in 6% of cases; however, 1 included 50% [133] and the other [134] included 25% of patients with a PORT (Patient Outcomes Research Team) score of ≤2. Such patients are generally not hospitalized and would not have been included in the VA study or the EPIC study.
Using a serotype-specific enzyme-linked immunosorbent assay (ELISA) on urine [135], a Dutch pneumococcal vaccine trial [136] identified pneumococcus in 16% of CAP in the control (nonvaccinated) group, consistent with the higher incidence of pneumococcus in Europe, although lower than some of the other European studies cited above [40, 123, 126]. The finding in these 3 studies [33, 34, 136] of Legionella, Pseudomonas, or S. aureus as a cause of 1%, ≤3%, or ≤5% of pneumonias, respectively, has important implications for the selection of empiric antibiotics used to treat CAP.
Perhaps the most important observation in these 3 studies was the failure to identify a cause for pneumonia in more than 50% of cases. The VA study [33] attempted to use clinical scenarios with support from laboratory and radiologic studies to distinguish bacterial from nonbacterial (largely viral) pneumonia. The investigators defined a likely bacterial pneumonia as 3 or more of the following: hyperacute presentation; septic shock; white blood cell count >15000 or <6000 with increased band forms; dense segmental or lobar consolidation; absence of upper respiratory symptoms; biphasic illness with upper respiratory symptoms followed by a sudden deterioration; or an elevated procalcitonin level. Likely nonbacterial pneumonia had none of these findings plus 2 or more of the following: exposure to sick contact(s); upper respiratory symptoms; patchy infiltrates; and a low serum procalcitonin level. About 58% of patients with no identifiable cause stratified to likely bacterial disease and 15% to likely viral disease; 27% could not be categorized. The authors hypothesized that so-called normal respiratory flora play a prominent etiologic role in patients whose syndrome suggested likely bacterial pneumonia and in whom all other tests failed to reveal a recognized pathogen.
TECHNIQUES TO IDENTIFY S. PNEUMONIAE CURRENTLY UNDER STUDY
A serotype-specific urinary ELISA increases the diagnostic yield for pneumococcus by 15%–20% [135]. Unfortunately, the available test only detects strains in the 13-valent conjugate pneumococcal vaccine, many of which have greatly declined in incidence [137]. Therefore, a new set of antigens needs to be studied and the method validated before it will provide useful information in the future.
Albrich et al [138] used a quantitative PCR on nasopharyngeal swabs to detect pneumococcal lytA in human immunodeficiency virus (HIV)–infected South African patients with pneumonia. Patients who met criteria for pneumococcal infection had 1000-fold greater counts than patients without nonpneumococcal CAP and 100000-fold greater counts than HIV-infected controls without CAP. To our knowledge, this work has not been validated in a study from a developed country. A quantitative, multiplex PCR detects 40 pneumococcal serotypes [139] but has yet to be studied as a diagnostic tool for CAP.
A recent study from the United Kingdom identified an etiologic agent by quantitative PCR in 87% of CAP patients, including S. pneumoniae in 36%, H. influenzae in 40%, Moraxella in 14%, S. aureus in 10%, Klebsiella in 4%, Pseudomonas in 3%, and Mycoplasma or Legionella in <2% each [140]. This technique appears to be either overly sensitive or nonspecific since 2 or more bacterial pathogens were found in 32% of cases and Moraxella was found in 14%. A respiratory virus was detected in 30% of cases but alone (without a bacterial respiratory pathogen) in only 6%.
CONCLUSION
In conclusion, principal trends in determining etiologic agents in pneumonia include the following: a marked but unexplained decline in the prevalence of pneumococcal disease; continued recognition of pneumococcus as the most commonly identified bacterial pathogen, especially in critically ill patients; a greater frequency of pneumococcus in Europe compared to the United States; a greatly increased role for respiratory viruses; detection of Mycoplasma and Legionella in a far smaller proportion of cases than had been reported in 1990–2010; and, perhaps most importantly, failure to establish an etiologic diagnosis in more than 50% patients. The principal challenges for the future appear to be to create a balance between overly sensitive and sufficiently sensitive diagnostic techniques, to identify an etiologic agent in the one-half of cases that now go undiagnosed, and to investigate the role of so-called normal respiratory flora in causing pneumonia. All these factors need to be considered as guidelines for management of community acquired pneumonia are formulated.
Supplementary Data
Supplementary materials are available at Clinical Infectious Diseases online. Consisting of data provided by the authors to benefit the reader, the posted materials are not copyedited and are the sole responsibility of the authors, so questions or comments should be addressed to the corresponding author.
Note
Potential conflicts of interest. All authors: No reported conflicts of interest. All authors have submitted the ICMJE Form for Disclosure of Potential Conflicts of Interest. Conflicts that the editors consider relevant to the content of the manuscript have been disclosed.
References


Comments