Article

Kinetics of Glycoxidation of Bovine Serum Albumin by Glucose, Fructose and Ribose and Its Prevention by Food Components

by
Izabela Sadowska-Bartosz
1,*,
Sabina Galiniak
1 and
Grzegorz Bartosz
1,2
1
Department of Biochemistry and Cell Biology, University of Rzeszów, Zelwerowicza 4, 35-601 Rzeszów, Poland
2
Department of Molecular Biophysics, University of Łódź, Pomorska 141/143, 90-236 Łódź, Poland
*
Author to whom correspondence should be addressed.
Molecules 2014, 19(11), 18828-18849; https://doi.org/10.3390/molecules191118828
Submission received: 12 October 2014 / Revised: 9 November 2014 / Accepted: 12 November 2014 / Published: 17 November 2014
(This article belongs to the Section Medicinal Chemistry)

Abstract

:
The aim of this study was to compare the kinetics of the glycoxidation of bovine serum albumin (BSA) as a model protein by three sugars: glucose, fructose and ribose, using fluorometric measurements of the content of advanced glycation end products (AGEs), protein-bound fructosamine, dityrosine, N'-formylkynurenine, kynurenine, tryptophan, the content of advanced oxidation protein products (AOPP), protein carbonyl groups, as well as thiol groups. Moreover, the levels of glycoalbumin and AGEs were determined by using an enzyme-linked immunosorbent assay. Based on the kinetic results, the optimal incubation time for studies of the modification of the glycoxidation rate by additives was chosen, and the effects of 25 compounds of natural origin on the glycoxidation of BSA induced by various sugars were examined. The same compounds were found to have different effects on glycoxidation induced by various sugars, which suggests caution in extrapolation from experiments based on one sugar to other sugars. From among the compounds tested, the most effective inhibitors of glycoxidation were: polyphenols, pyridoxine and 1-cyano-4-hydroxycinnamic acid.

1. Introduction

In the body, proteins are subject to a variety of enzymatic and non-enzymatic modifications. One of the unavoidable consequences of metabolism is the non-enzymatic reaction of proteins with reducing sugars (glycation or Maillard reaction). Protein glycation is initiated by a nucleophilic addition reaction between the free amino group from a protein, lipid or nucleic acid and the carbonyl group of reducing saccharides. This reaction forms a reversible Schiff base, which rearranges over a period of days to produce ketoamine or Amadori products. The Amadori products undergo dehydration and rearrangements followed by other reactions, such as cyclization, oxidation and dehydration, to form more stable advanced glycation end products (AGEs) [1]. AGE formation takes place under normal physiologic conditions, but is accelerated in hyperglycemia [2,3]. Glycation alters the structure and functional properties of proteins, which adversely affects cellular metabolism. The accumulation of glycation products is observed in human and animal tissues during aging and is associated with various diseases, including, first of all, diabetes and diabetic nephropathy, microangiopathy and atherosclerosis [4,5]. The serum levels of AGEs have been found to be elevated also in cystic fibrosis [6] and neurodegenerative diseases, such as Alzheimer’s disease, Parkinson’s disease [7], Creutzfeldt–Jacob disease [8], as well as amyotrophic lateral sclerosis [9]. Glycation has been well-studied for many proteins, both short- (e.g., human hemoglobin) and long-lived (such as collagen and lens crystallin). It should be mentioned that many studies have been done on bovine serum albumin (BSA), which has high (76%) sequence homology to human serum albumin [10].
The main glycating sugar, present in the body at the highest concentration, is d-glucose. However, d-fructose is more reactive, which leads to enhanced glycation in fructosemia [11]. Fructose is a common monosaccharide that is found naturally in its free form in honey, fruits and other plant material and in a bound form as a component of sucrose. When taken orally, fructose is absorbed in the small intestine and efficiently adsorbed in the liver; as a consequence, there is no big postprandial increase in the blood fructose concentration. Diabetic patients have elevated serum and urinary fructose levels. Serum fructose concentrations in patients with diabetes are 12.0 ± 3.8 μM, while in healthy subjects, values of 8.1 ± 1.0 μM are found (p < 0.001) [12].
d-ribose is a pentose occurring in every cell type and is a component of such important molecules as riboflavin, adenine nucleotides and ribonucleic acids. Ribose has the ability to react with proteins to produce glycated derivatives. The body contains about 16 mg of ribose per liter of blood (~100 μM) [13]; another study reported the concentration of free ribose in human blood plasma to be 7 μM (0–17 μM) [14]. Ribose (0.01–0.1 mM) is present also in the cerebrospinal fluid [13].
Glycation can be catalyzed by metals and is usually associated with the generation of reactive oxygen species (ROS) and oxidation; the combination of both processes is often referred to as glycoxidation.
The possibility of reducing glycation and tissue AGEs is an approachable target for delaying or preventing the onset of diabetic complications. Although synthetic compounds are powerful drugs that inhibit AGEs formation or break cross-links, they can also have severe side effects. For example, aminoguanidine and other hydrazine drugs, such as hydralazine, isoniazid and gentamicins, are either toxic or show adverse side effects, because of the depletion of essential carbonyls, such as pyridoxal phosphate (vitamin B6) [15]. Therefore, it is critical to develop effective and safe agents to protect diabetic individuals from complications [16]. The treatment of diabetes mellitus will benefit from on-going screening and development of novel compounds that offer combined antioxidant and anti-glycation properties [17]. Such studies are being performed employing conditions close to physiological ones [18,19]. Prevention of glycoxidation is also important for the food industry to avoid the formation of AGEs in food processing [20].
The aim of this paper was to compare the effect of chosen compounds of natural origin, in particular polyphenols, on the glycoxidation of BSA by three different sugars. In preliminary experiments, the kinetics of glycoxidation was studied in order to find optimal conditions for the examination of the effects of potential inhibitors on the rate of glycation. The conditions of the experiments were far from physiological, both in terms of BSA concentration, which was lower by an order of magnitude than that in the blood plasma, and especially in terms of sugar concentrations, which were at least two orders of magnitude higher than the physiological ones. However, as the amount of product formed in a chemical reaction is an integral of the rate constant and concentrations of substrates over time, increased substrate concentrations allow for obtaining appropriate amounts of a product in a shorter time. Thus, a several-day incubation provides amounts of glycoxidation products equivalent to those formed over several weeks or months in vivo. However, extrapolation to the in vivo situation may not be straightforward, due to the homeostatic systems of the body. Nevertheless, results obtained in model experiments permit preliminary screening for potential inhibitors of glycoxidation.

2. Results

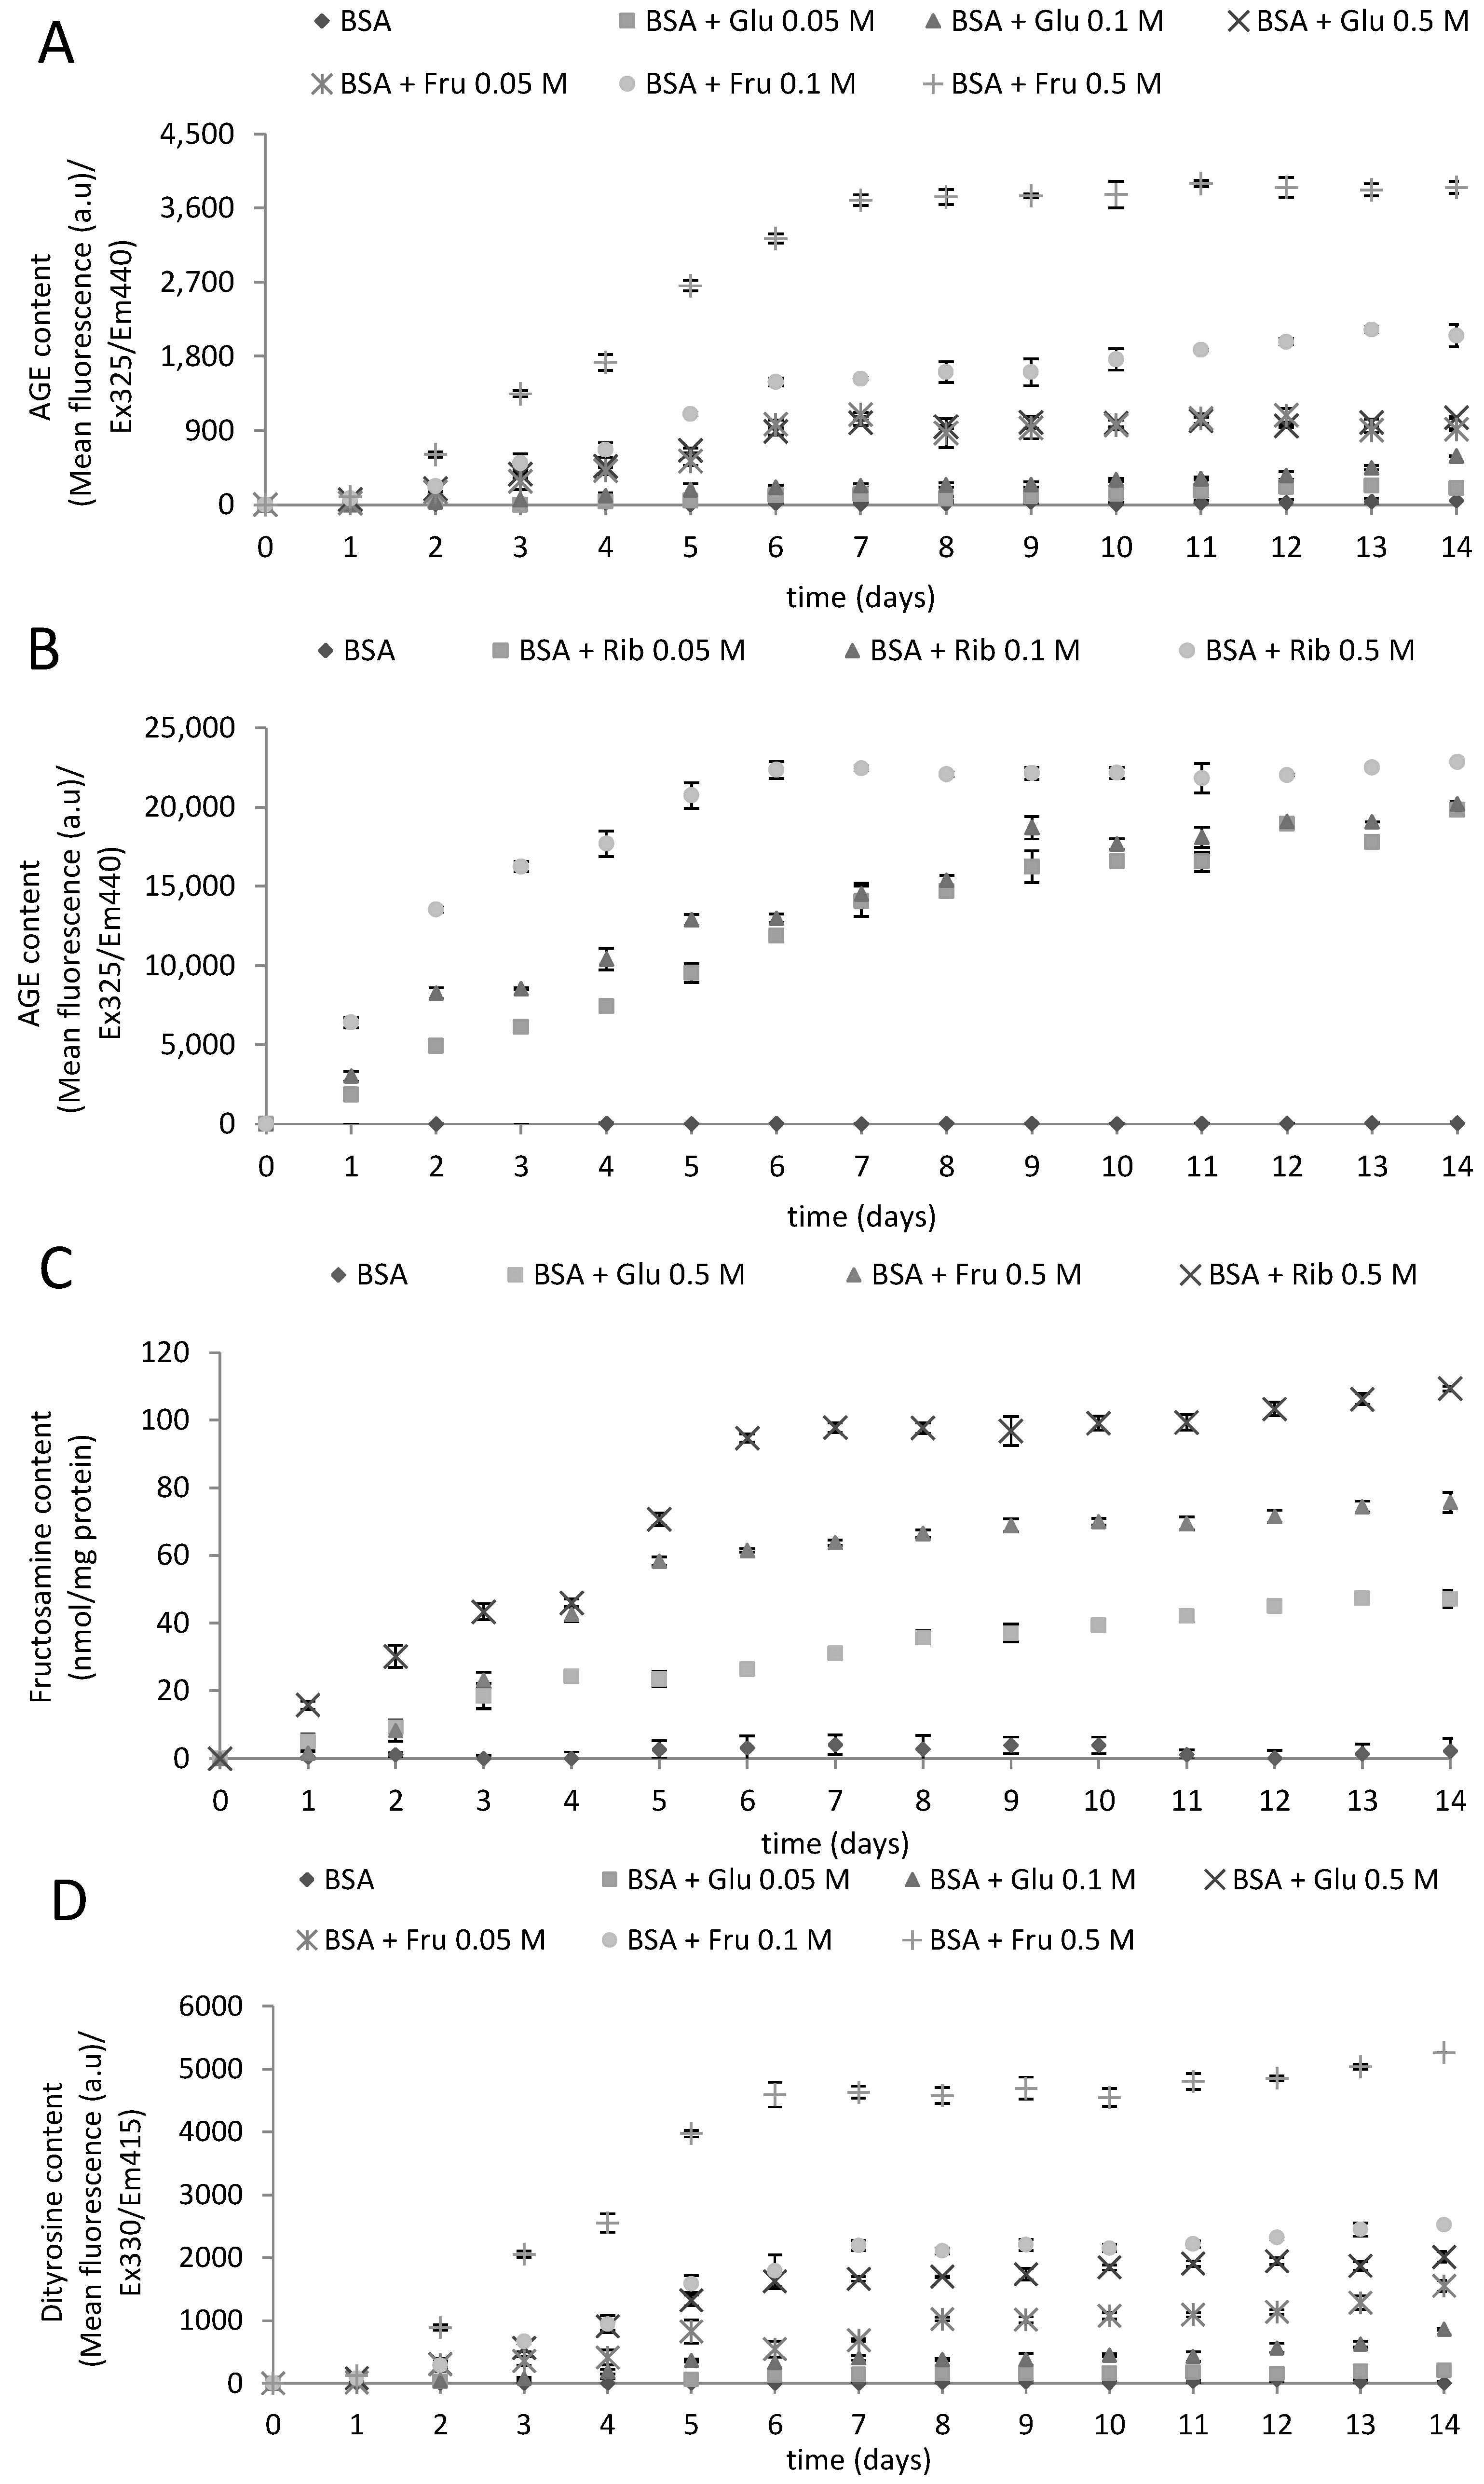
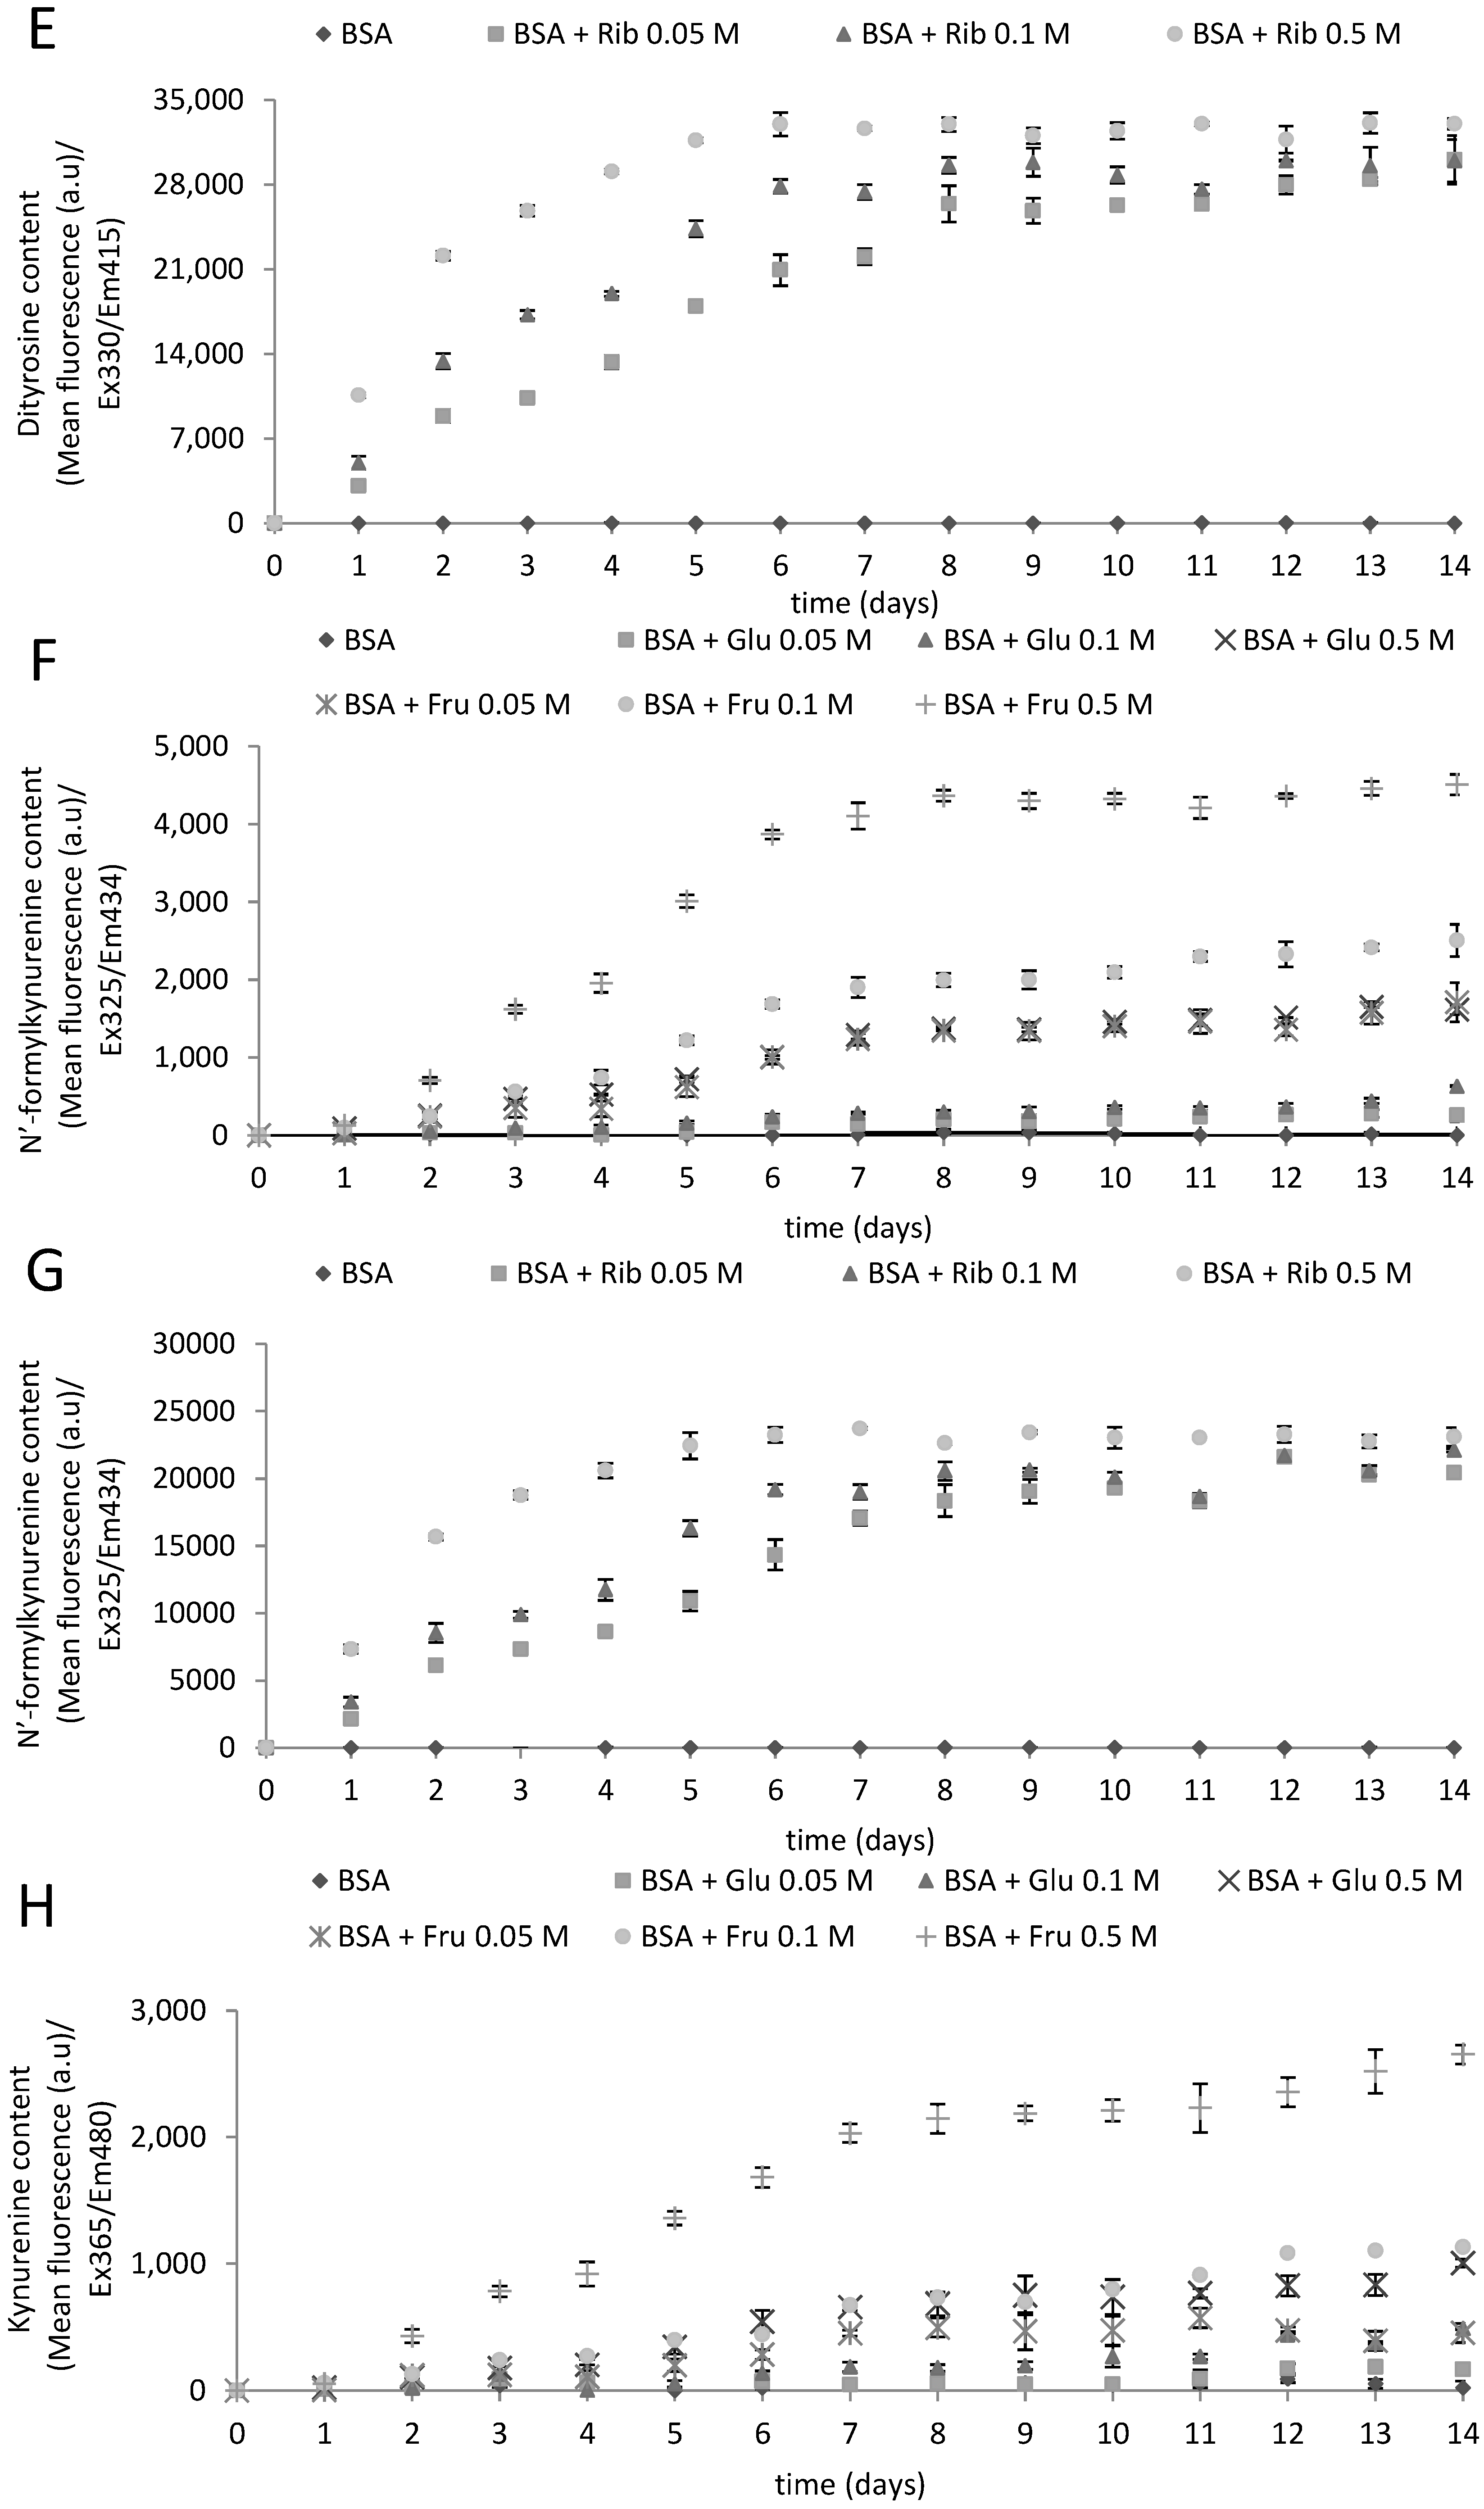
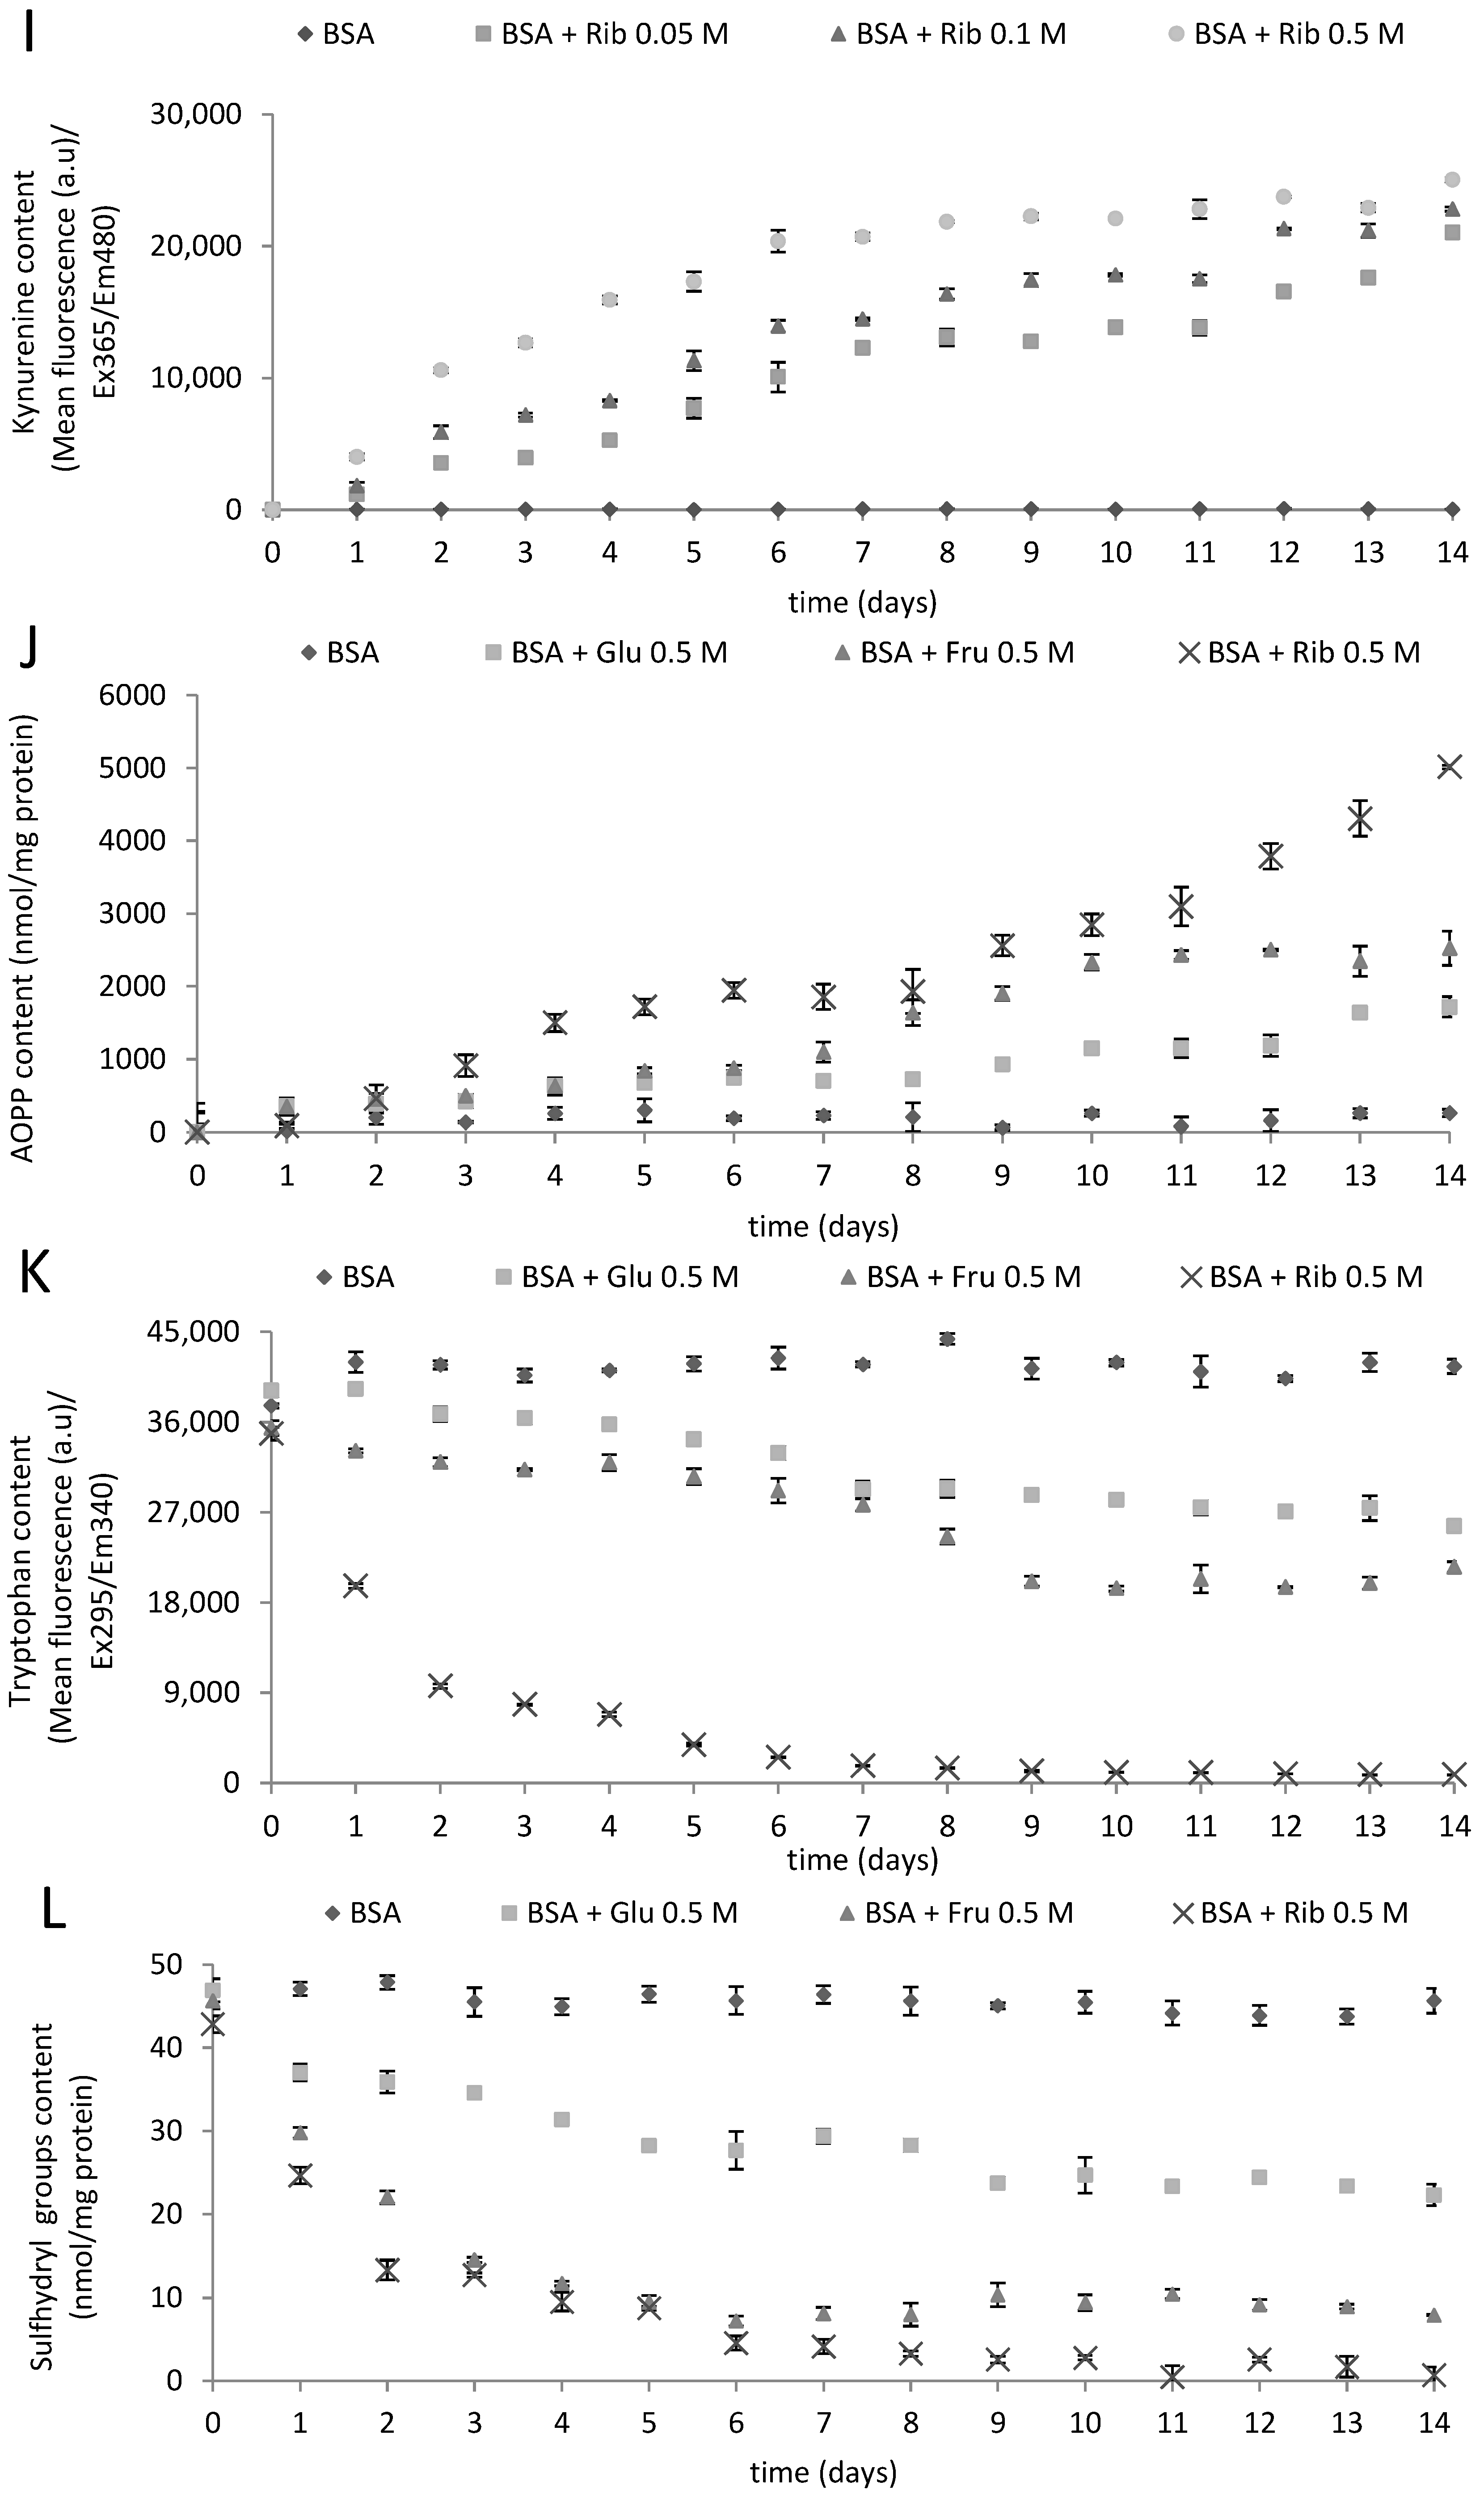
2.1. Kinetics of Glycoxidation

We monitored changes in the values of chosen parameters describing protein glycoxidation and oxidative modifications during a 14-d incubation with reducing sugars. The level of AGEs, determined fluorometrically, increased with time during incubation with the sugars, until reaching a plateau level (Figure 1A,B). The behavior of fructosamine followed the same pattern, although the higher ribose concentration interfered with the assay (Figure 1C), due to the reaction with nitroblue tetrazolium.
The time-course of parameters reflecting protein oxidative damage, such as the levels of dityrosine (Figure 1D,E), N'-formylkynurenine (Figure 1F,G), kynurenine (Figure 1H,I) and advanced oxidation protein products (AOPP; Figure 1J) showed a similar behavior, increasing in parallel with those of AGEs and fructosamine. Tryptophan fluorescence (Figure 1K) and sulfhydryl group content (Figure 1L) decreased in parallel. Thus, the glycation of BSA was accompanied by protein oxidation, in full agreement with the idea of glycoxidation.

2.2. Protection against Glycoxidation

In search for compounds that could effectively inhibit glycoxidation, we have compared the effects of three standard inhibitors of glycation, six amino acids or their derivatives and peptides, two reference antioxidants, three iron chelators, six organic acids, two polyamines and 10 naturally-occurring polyphenols. BSA was incubated in the absence and in the presence of the additives for six days, and the extent of glycoxidation was estimated on the basis of changes in the fluorometric indices of glycoxidation (the content of AGE, dityrosine, N'-formylkynurenine and kynurenine) and AOPP content.
Figure 1. The time course of the glycoxidation of BSA incubated at 37 °C for 14 days with 0.05, 0.1 and 0.5 M glucose (Glu), fructose (Fru) and ribose (Rib): AGE fluorescence (A,B); fructosamine content (C); dityrosine content (D,E); N'-formylkynurenine content (F,G); N-formylkynurenine content (H,I); advanced oxidation protein products (AOPP) content (J); tryptophan fluorescence; (K) and sulfhydryl group content (L).
Molecules 19 18828 g001aMolecules 19 18828 g001bMolecules 19 18828 g001c
Aminoguanidine and metformin are two standard inhibitors of glycoxidation applied in in vivo experiments [5]. In our case, metformin slightly enhanced the rate of glycoxidation by glucose, did not affect significantly the glycoxidation by ribose and had a moderate inhibitory effect on the glycoxidation by fructose in this simple in vitro system. In contrast, aminoguanidine significantly inhibited glycoxidation by glucose and fructose and moderately inhibited glycoxidation by ribose. Another inhibitor of glycoxidation, pyridoxine, was the most effective inhibitor of glycoxidation by all three sugars. The fluorescence measured after six days for samples incubated with pyridoxine was in most cases lower than at Day 0, apparently due to the consumption of fluorophores, contributing to the fluorescence in the reactions with this compound; the same effect was noted in some other cases (Table 1, Table 2 and Table 3).
Table 1. The effect of various additives (1 mM) on the extent of the glycoxidation of BSA induced by glucose (0.5 M), estimated with fluorometric parameters. Δ p < 0.05, # p < 0.01, * p < 0.001 (paired Student’s t-test). Results significantly different from samples incubated with the sugar without additives are shown in bold. DETAPA, diethylenetriaminepentaacetic acid; NTA, nitrilotriacetic acid.
AdditiveAGEDityrosineN'-formylkynurenineKynurenineAOPP
BSA, no sugar3.55 ± 5.16 *3.46 ± 5.61 *1.57 ± 5.37 *7.27 ± 10.06 *17.25 ± 6.58 #
BSA + glucose, no additive100100100100100
DMSO103.78 ± 10.32100.56 ± 10.59103.45 ± 10.91232.47 ± 23.09 #91.11 ± 9.34
Standard Antiglycating Agents
Aminoguanidine41.91 ± 2.69 *29.39 ± 4.13 *38.07 ± 3.07 *66.58 ± 10.87 Δ41.31 ± 4.87 #
Metformin112.75 ± 3.34 Δ116.00 ± 2.79 #124.59 ± 3.01 #119.83 ± 6.21 Δ118.21 ± 9.02
Pyridoxine<0 *<0 *<0 *193.42 ± 14.04 #6.19 ± 4.27 *
Antioxidants
Captopril34.52 ± 7.55 #31.85 ± 6.81 #37.62 ± 7.22 #87.27 ± 16.7433.66 ± 6.14 #
Tiron31.3 ± 10.73 #28.91 ± 10.92 #33.12 ± 11.23 #72.55 ± 15.79 Δ65.87 ± 13.88
Metal Chelators
EDTA98.14 ± 2.2792.47 ± 3.4099.53 ± 4.8187.01 ± 7.95106.87 ± 13.37
DETAPA135.79 ± 2.61 #127.51 ± 1.63 Δ125.27 ± 4.11 Δ94.94 ± 2.24107.18 ± 17.16
NTA124.59 ± 9.51 Δ113.80 ± 8.24112.30 ± 8.9294.03 ± 13.82109.73 ± 8.69
Amino Acids and Derivatives, Peptides
Arginine120.14 ± 9.56106.81 ± 9.16108.58 ± 8.69104.33 ± 14.37107.86 ± 14.18
Carnosine122.00 ± 6.13 Δ120.20 ± 6.46 Δ135.06 ± 7.29 #152.47 ± 9.75 #127.47 ± 31.73
Cysteamine20.19 ± 9.35 #19.16 ± 9.82 #22.82 ± 10.75 #48.48 ± 22.52 Δ46.15 ± 10.14 Δ
Glutathione oxidized136.72 ± 10.56 Δ140.81 ± 11.13 Δ144.95 ± 11.84 Δ149.44 ± 20.76110.25 ± 8.37
Glutathione reduced51.49 ± 13.28 Δ49.26 ± 10.97 #49.61 ± 10.87 #111.08 ± 25.9283.66 ± 8.70
Glycine140.89 ± 20.65143.49 ± 18.41148.09 ± 21.45148.40 ± 28.52110.04 ± 10.32
Organic Acids
1-Cyano-4-hydroxycinnamic acid4.89 ± 1.60 *4.59 ± 1.26 *6.12 ± 2.29 *19.48 ± 5.36 *31.62 ± 9.55 #
4-Hydroxy cinnamic acid94.70 ± 7.0597.77 ± 6.09104.29 ± 6.2392.12 ± 12.4389.07 ± 9.50
Lipoic acid89.23 ± 2.41 Δ89.35 ± 2.42 #97.02 ± 3.1797.73 ± 2.8091.71 ± 9.89
Para-aminobenzoic acid152.04 ± 18.58 Δ150.09 ± 16.01 Δ163.83 ± 17.49 Δ149.39 ± 15.80 Δ129.74 ± 25.42
Pyruvic acid82.29 ± 3.11 #84.56 ± 2.68 #91.26 ± 2.88 Δ73.94 ± 6.16 #94.54 ± 2.27
Quinic acid72.93 ± 8.44 Δ75.19 ± 8.59 Δ79.49 ± 8.34 Δ56.54 ± 12.28 Δ88.53 ± 11.99
Organic Polybases
Spermidine143.88 ± 4.11 #137.43 ± 3.23 #151.7 ± 3.39 *233.07 ± 8.83 *117.47 ± 16.58
Spermine144.22 ± 19.98139.62 ± 23.29153.53 ± 22.79195.06 ± 35.58 Δ118.37 ± 13.14
Polyphenols
Caffeic acid<0 *<0 *<0 *180.71 ± 9.74 #43.38 ± 14.08 Δ
Ellagic acid96.47 ± 6.1658.82 ± 4.37 #92.01 ± 6.56107.71 ± 35.95103.99 ± 41.12
Ferulic acid<0 *<0 *29.34 ± 7.35 #156.28 ± 19.39 Δ53.27 ± 9.22 Δ
Gallic acid460.03 ± 9.73 *249.02 ± 14.12 #432.07 ± 11.04 *586.37 ± 49.71 #615.09 ± 24.62 *
Genistein27.46 ± 0.97 *23.86 ± 0.79 *27.77 ± 1.43 *46.85 ± 1.77 *44.43 ± 10.14 Δ
Kaempferol20.77 ± 2.09 *13.98 ± 1.58 *20.18 ± 2.43 *22.12 ± 4.38 *45.97 ± 18.44 Δ
Naringin28.90 ± 0.44 *22.05 ± 0.17 *24.38 ± 0.35 *103.39 ± 4.6835.87 ± 11.61 Δ
Propyl gallate<0 *<0 *<0 *198.18 ± 5.78 *71.84 ± 20.08
Quercitrin3.37 ± 0.38 *1.11 ± 0.28 *1.01 ± 0.17 *3.31 ± 0.58 *47.35 ± 14.16 Δ
Rutin2.94 ± 0.35 *1.15 ± 0.34 *1.26 ± 0.23 *2.79 ± 0.14 *42.26 ± 5.76 #
Out of two amino acids studied, arginine moderately decreased glycoxidation by fructose and ribose, having a slight, although not significant, stimulatory effect on the glycoxidation by glucose, while glycine slightly enhanced glycoxidation by glucose and fructose and had no discernible effect on the glycoxidation by ribose. Cysteamine and reduced glutathione inhibited glycoxidation by all sugars; interestingly, oxidized glutathione provided also some protection against glycoxidation by glucose and ribose, while enhancing glycoxidation induced by fructose.
Numerous papers suggested that glycoxidation can be inhibited by antioxidants and metal chelators [5,21,22]. Both model antioxidants used, captopril and tiron, significantly inhibited the glycoxidation by glucose and fructose. Captopril inhibited the glycoxidation by fructose, while the effect of tiron was very low, except for AOPP. Glycoxidation by ribose was not affected considerably by either antioxidant; the changes were concordant for all parameters measured.
Table 2. The effect of various additives (1 mM) on the extent of the glycoxidation of BSA induced by fructose (0.5 M), estimated with fluorometric parameters. Δ p < 0.05, # p < 0.01, * p < 0.001 (paired Student’s t-test).
AdditiveAGEDityrosineN'-formylkynurenineKynurenineAOPP
BSA, no sugar0.67 ± 0.97 *0.65 ± 1.05 *0.29 ± 0.99 *1.52 ± 2.10 *8.91 ± 3.40 *
BSA + fructose, no additive100100100100100
DMSO68.54 ± 4.64 #62.86 ± 3.89 #67.52 ± 4.32 #134.00 ± 10.30 Δ70.55 ± 3.61 #
Standard Antiglycating Agents
Aminoguanidine19.53 ± 1.58 *17.76 ± 0.667 *19.20 ± 0.75 *39.31 ± 1.96 *44.15 ± 3.33 #
Metformin82.45 ± 5.02 Δ83.67 ± 5.14 Δ87.36 ± 4.91 Δ75.52 ± 7.14 Δ123.16 ± 13.28
Pyridoxine<0 *<0 *<0 *181.88 ± 3.75 *34.26 ± 4.68 #
Antioxidants
Captopril27.87 ± 0.78 *25.15 ± 0.78 *28.50 ± 0.93 *59.26 ± 2.32 *16.28 ± 3.17 *
Tiron97.32 ± 0.70 Δ104.07 ± 0.78 #103.62 ± 0.98 Δ105.68 ± 1.72 Δ44.98 ± 4.78 #
Metal Chelators
EDTA98.57 ± 2.9997.09 ± 2.9999.2 ± 1.5099.76 ± 2.01111.12 ± 12.93
DETAPA63.07 ± 3.04 #59.98 ± 2.92 #58.47 ± 2.79 #49.35 ± 7.83 #87.21 ± 4.25 Δ
NTA107.64 ± 3.03 Δ102.55 ± 3.12101.09 ± 2.8093.19 ± 4.03 Δ109.27 ± 5.26
Amino Acids and Derivatives, Peptides
Arginine93.26 ± 3.56 Δ87.62 ± 3.70 Δ89.68 ± 4.06 Δ81.59 ± 4.85 Δ107.2 ± 41.66
Carnosine97.12 ± 5.1096.28 ± 4.74103.05 ± 5.13104.80 ± 8.01109.53 ± 18.10
Cysteamine54.44 ± 1.83 *53.36 ± 1.78 *56.81 ± 2.18 *71.95 ± 4.41 #46.10 ± 13.99 Δ
Glutathione oxidized111.61 ± 1.64 #113.09 ± 2.61 #115.42 ± 2.35 #114.77 ± 3.19 #120.90 ± 16.07
Glutathione reduced78.10 ± 7.50 Δ78.39 ± 6.58 Δ77.68 ± 6.80 Δ69.38 ± 8.54 Δ129.12 ± 2.89 #
Glycine118.53 ± 7.88 Δ118.7 ± 7.03 Δ120.96 ± 6.82 Δ120.01 ± 8.89 Δ102.15 ± 21.96
Organic Acids
1-Cyano-4-hydroxycinnamic acid5.57 ± 0.16 *5.14 ± 0.13 *6.27 ± 0.16 *20.81 ± 0.59 *52.02 ± 13.55 Δ
4-Hydroxycinnamic acid88.85 ± 3.17 Δ90.26 ± 3.39 Δ94.86 ± 3.6793.19 ± 5.2363.30 ± 17.30
Lipoic acid132.99 ± 4.67 #130.7 ± 4.22 #137.82 ± 4.29 #129.87 ± 4.37 #150.17 ± 8.03 #
Para-aminobenzoic acid102.75 ± 4.3197.82 ± 3.74106.23 ± 4.13107.31 ± 4.52111.79 ± 9.52
Pyruvic acid61.70 ± 7.64 #62.90 ± 7.79 #65.43 ± 8.03 #39.36 ± 9.49 #87.62 ± 5.22
Quinic acid96.86 ± 2.0098.96 ± 1.73104.02 ± 1.80 Δ98.33 ± 2.6185.14 ± 6.43
Organic Polybases
Spermidine101.10 ± 1.6494.96 ± 3.30102.77 ± 2.56153.21 ± 8.47 #93.39 ± 12.04
Spermine120.74 ± 7.01 Δ118.59 ± 7.42 Δ125.58 ± 7.11 Δ150.61 ± 5.94 #98.82 ± 49.59
Polyphenols
Caffeic acid<0 *<0 *<0 *239.70 ± 68.36 Δ79.04 ± 6.87 Δ
Ellagic acid31.62 ± 4.73 *21.03 ± 3.68 *29.80 ± 4.41 *60.44 ± 7.81 #129.61 ± 5.19 Δ
Ferulic acid<0 *<0 *0.42 ± 3.25 *92.74 ± 5.8743.52 ± 3.32 #
Gallic acid59.54 ± 1.65 *33.05 ± 1.20 *55.43 ± 1.18 *217.27 ± 2.94 *92.99 ± 21.89
Genistein14.88 ± 0.61 *12.64 ± 0.34 *14.97 ± 0.49 *20.47 ± 0.25 *69.88 ± 10.88 Δ
Kaempferol14.36 ± 1.15 *9.98 ± 0.77 *13.63 ± 1.10 *18.55 ± 2.11 *64.21 ± 7.72 Δ
Naringin27.03 ± 0.30 *21.53 ± 0.38 *24.90 ± 0.97 *99.74 ± 3.0176.34 ± 4.21 Δ
Propyl gallate<0 *<0 *<0 *54.36 ± 6.62 #41.08 ± 11.75 Δ
Quercitrin2.62 ± 0.26 *1.77 ± 0.22 *2.08 ± 0.30 *1.84 ± 0.23 *43.63 ± 2.57 *
Rutin2.48 ± 0.11 *1.82 ± 0.07 *2.20 ± 0.10 *1.82 ± 0.09 *50.28 ± 7.56 #
Table 3. The effect of various additives (1 mM) on the extent of the glycoxidation of BSA induced by ribose (0.5 M), estimated with fluorometric parameters. Δ p < 0.05, # p < 0.01, * p < 0.001 (paired Student’s t-test).
AdditiveAGEDityrosineN'-formylkynurenineKynurenineAOPP
BSA, no sugar0.67 ± 0.97 *0.65 ± 1.05 *0.29 ± 0.99 *1.52 ± 2.10 *1.82 ± 0.70 *
BSA + ribose, no additive100100100100100
DMSO92.02 ± 0.64 #92.38 ± 0.67 #93.92 ± 0.84 #113.33 ± 0.96 *109.68 ± 0.87 #
Standard Antiglycating Agents
Aminoguanidine78.07 ± 1.53 *70.13 ± 0.32 *79.71 ± 0.44 *80.21 ± 2.06 *64.35 ± 4.39 #
Metformin99.66 ± 1.77100.52 ± 1.67105.57 ± 1.63 Δ91.19 ± 3.9680.84 ± 4.72 Δ
Pyridoxine<0 *<0 *<0 *95.09 ± 2.4210.02 ± 3.45 *
Antioxidants
Captopril93.66 ± 0.41 *94.57 ± 0.80 #98.39 ± 0.69 Δ102.39 ± 2.9791.08 ± 2.02 Δ
Tiron97.32 ± 0.70 Δ104.07 ± 0.78 #103.62 ± 0.98 Δ105.68 ± 1.72 Δ51.85 ± 4.39 #
Metal Chelators
EDTA98.67 ± 0.5997.64 ± 6.7299.29 ± 7.77100.31 ± 8.4496.71 ± 0.74
DETAPA104.09 ± 0.48 #99.73 ± 0.62100.59 ± 0.78978.65 ± 1.7976.42 ± 3.41 #
NTA111.73 ± 0.79 *107.94 ± 1.07 #107.87 ± 0.80 #104.63 ± 2.5286.01 ± 2.59 Δ
Amino Acids and Derivatives, Peptides
Arginine89.83 ± 0.86 #89.06 ± 0.80 *87.61 ± 0.96 *97.67 ± 1.9186.78 ± 4.06 Δ
Carnosine93.56 ± 0.43 *93.68 ± 0.35 *99.28 ± 0.24 Δ102.90 ± 0.7777.96 ± 3.48 #
Cysteamine78.55 ± 1.87 #79.47 ± 1.85 #82.13 ± 1.98 #104.22 ± 3.5293.21 ± 1.68 Δ
Glutathione oxidized83.63 ± 4.11 #91.42 ± 3.07 Δ87.73 ± 4.38 Δ106.09 ± 4.0695.55 ± 3.30
Glutathione reduced85.58 ± 1.45 #91.99 ± 1.15 #86.17 ± 1.16 #103.70 ± 3.42109.26 ± 3.92
Glycine99.46 ± 0.55103.24 ± 0.24 *104.19 ± 0.99 #109.24 ± 2.23 #89.25 ± 3.25 Δ
Organic Acids
1-Cyano-4-hydroxycinnamic acid18.29 ± 0.11 *16.46 ± 0.04 *18.54 ± 0.05 *35.31 ± 0.19 *33.38 ± 5.90 #
4-Hydroxycinnamic acid102.44 ± 0.28 #104.63 ± 0.40 #110.93 ± 0.26 *97.48 ± 0.27 #96.52 ± 3.52
Lipoic acid105.45 ± 0.61 #102.81 ± 0.83 Δ108.73 ± 0.35 *111.00 ± 2.01 #83.08 ± 5.73 Δ
Para-aminobenzoic acid85.53 ± 1.05 *80.87 ± 1.05 *87.46 ± 0.93 *99.43 ± 1.7882.13 ± 3.72 Δ
Pyruvate104.70 ± 2.98105.50 ± 3.08111.00 ± 3.13 Δ99.18 ± 4.4798.48 ± 8.42
Quinic acid108.40 ± 0.90 #110.98 ± 0.90 #116.92 ± 1.11 *107.96 ± 0.80 #105.43 ± 3.09
Organic Polybases
Spermidine38.84 ± 0.37 *36.07 ± 0.21 *40.85 ± 0.39 *87.18 ± 0.65 *44.69 ± 5.23 #
Spermine32.06 ± 1.86 *29.54 ± 1.80 *33.71 ± 1.87 *71.84 ± 0.59 *67.50 ± 3.97 #
Polyphenols
Caffeic acid45.63 ± 22.36 Δ56.37 ± 24.57 Δ48.62 ± 12.47 #96.67 ± 6.6764.26 ± 0.88 *
Ellagic acid74.18 ± 2.54 #74.19 ± 2.95 #74.74 ± 2.85 #44.32 ± 1.84 *77.97 ± 6.66 Δ
Ferulic acid14.04 ± 0.52 *28.05 ± 0.49 *18.08 ± 0.51 *99.22 ± 1.0541.60 ± 2.21 *
Gallic acid73.48 ± 1.87 *86.01 ± 1.52 #79.09 ± 1.49 *64.21 ± 1.38 *81.57 ± 3.22 Δ
Genistein29.40 ± 0.99 *28.48 ± 1.02 *30.75 ± 0.93 *33.91 ± 0.82 *17.42 ± 3.80 *
Kaempferol29.23 ± 1.95 *24.84 ± 1.96 *29.68 ± 1.88 *19.98 ± 1.81 *84.23 ± 6.49
Naringin53.60 ± 1.21 *50.86 ± 1.11 *53.28 ± 1.20 *68.38 ± 0.70 *58.63 ± 4.45 #
Propyl gallate66.71 ± 1.60 *55.39 ± 2.09 *65.65 ± 1.77 *81.82 ± 1.30 *55.23 ± 3.53 #
Quercitrin14.20 ± 0.15 *12.13 ± 0.13 *14.19 ± 0.18 *8.37 ± 0.07 *50.17 ± 3.76 #
Rutin15.79 ± 0.30 *13.40 ± 0.35 *15.78 ± 0.35 *7.88 ± 0.14 *64.22 ± 6.26 Δ
We checked the effects of chelators, ethylenediaminetetraacetate acid (EDTA), diethylenetriaminepentaacetic acid (DETAPA) and nitrilotriacetic acid (NTA) on BSA glycoxidation. Judging from the changes in AGE, dityrosine and N-formylkynurenine fluorescence, EDTA had no significant effect on glycoxidation induced by any sugar; DETAPA significantly inhibited only fructation; while NTA had no significant effect on the glycoxidation induced by glucose or fructose and slightly increasing the glycoxidation by ribose. Changes in AOPP content followed the same pattern with the only exception of a small decrease of this parameter by DETAPA and NTA in the case of ribose and by DETAPA in the case of fructose. These data point to considerable differences in the effects of the same substances on glycoxidation induced by different sugars, which were visible also with further substances studied.
Lipoic acid moderately inhibited glycoxidation by glucose, having no significant effect on the glycoxidation induced by ribose and promoting to some extent glycoxidation by fructose and ribose, though decreasing the AOPP level evoked by ribose. Para-aminobenzoic acid enhanced glycoxidation by glucose, slightly inhibited glycoxidation by ribose and did not affect the glycoxidation by fructose. Quinic acid inhibited to some extent glycoxidation by glucose, did not affect the glycoxidation by fructose and somewhat enhanced glycoxidation by ribose. 4-Hydroxycinnamic acid did not affect glycoxidation by glucose, slightly inhibited glycoxidation by fructose and somewhat enhanced glycoxidation by ribose, while 1-cyano-4-hydroxycinnamic acid was an efficient inhibitor of glycoxidation induced by all sugars studied.
The naturally occurring polyamines, spermine and spermidine, significantly inhibited glycoxidation by ribose, did not affect or slightly enhanced (spermine) glycoxidation by fructose and promoted glycoxidation by glucose.
The natural polyphenols used, with the exception of gallic acid and ellagic acid in the case of glucose-induced glycoxidation, were good inhibitors of glycoxidation induced by all three sugars.
The effects measured were always consistent for three parameters: the level of AGEs and the content of dityrosine and N'-formylkynurenine. The results for the N'-formylkynurenine fluorescence were sometimes inconsistent, apparently due to the interference of the substances added with that of formylkynurenine. The results obtained for AOPP were generally consistent with those obtained for AGEs, and the content of dityrosine and N'-formylkynurenine, with a few exceptions (pyruvate for glycoxidation by glucose; ellagic acid, reduced glutathione, metformin and DETAPA for fructation and NTA in the case of glycoxidation by ribose), where the opposite direction of significant changes was obtained for the fluorescence of AGEs, dityrosine and N'-formylkynurenine, on the one hand, and changes in AOPP, on the other hand.
In order to check the validity of the protective effects of the additives on the glycoxidation of BSA, we estimated also the level of carbonyl groups by a fluorometric assay and the level of glycated albumin by the Bovine Glycated Albumin ELISA Kit. The results generally confirm those obtained by fluorometric and AOPP assays. Aminoguanidine and pyridoxine decreased carbonyl group formation induced by all sugars, while metformin only that induced by glucose (slightly). Captopril and tiron decreased BSA carbonylation induced by glucose and fructose, while NTA only that induced by glucose. Cysteamine, carnosine, reduced glutathione, 1-cyano-4-hydroxycinnamic acid and pyruvic acid attenuated the formation of carbonyl groups induced by all sugars, oxidized glutathione that by glucose and glycine that by glucose and fructose. Para-aminobenzoic acid slightly enhanced carbonylation induced by ribose. Spermidine enhanced carbonylation induced by fructose, while decreasing that induced by ribose. Most polyphenols (caffeic acid, ferulic acid, genistein, naringin, propyl gallate and rutin) inhibited carbonylation induced by all three sugars, ellagic acid that induced by glucose and fructose, while gallic acid enhanced carbonylation induced by glucose, while attenuating that induced by fructose and ribose (Table 4).
Table 4. The effect of various additives (1 mM) on the protein carbonyl content of glycated BSA induced by glucose, fructose and ribose (0.5 M), estimated with the protein carbonyl fluorometric assay. Δ p < 0.05, # p < 0.01, * p < 0.001 (paired Student’s t-test).
AdditiveGlucoseFructoseRibose
BSA + sugar, no additive100100100
DMSO101.31 ± 2.3799.90 ± 2.09101.58 ± 1.89
Standard Antiglycating Agents
Aminoguanidine74.41 ± 0.44 *70.63 ± 1.683 *88.98 ± 1.00 *
Metformin96.57 ± 0.46 #97.74 ± 2.83699.35 ± 0.54
Pyridoxine43.35 ± 2.55 *43.08 ± 0.16 *71.85 ± 1.86 *
Antioxidants
Captopril84.93 ± 1.02 *86.56 ± 1.46 *98.45 ± 1.92
Tiron83.10 ± 0.76 *94.41 ± 0.86 #98.14 ± 1.73
Metal Chelators
NTA95.35 ± 1.61 Δ97.78 ± 0.51100.31 ± 0.71
Amino Acids and Derivatives, Peptides
Arginine97.16 ± 5.8498.35 ± 3.3998.79 ± 0.58 Δ
Carnosine93.19 ± 2.04 #92.55 ± 1.84 #95.36 ± 1.44 #
Cysteamine82.25 ± 0.94 *86.00 ± 0.84 *88.43 ± 1.93 *
Glutathione oxidized95.69 ± 0.69 #99.24 ± 1.27100.73 ± 0.67
Glutathione reduced88.75 ± 2.77 #93.19 ± 3.52 Δ96.71 ± 0.93 Δ
Glycine95.61 ± 1.16 #99.62 ± 1.3597.51 ± 1.22 Δ
Organic Acids
1-Cyano-4-hydroxycinnamic acid66.41 ± 2.25 *72.08 ± 1.89 *89.86 ± 0.61 *
4-Hydroxycinnamic acid100.64 ± 3.4697.73 ± 0.98101.17 ± 3.11
Lipoic acid100.51 ± 8.5496.19 ± 1.23 Δ100.78 ± 3.55
Para-aminobenzoic acid102.88 ± 2.9293.71 ± 4.11105.51 ± 0.58 *
Pyruvic acid84.34 ± 1.06 *87.07 ± 0.27 *98.94 ± 0.50 Δ
Quinic acid97.05 ± 3.3599.05 ± 2.6798.35 ± 1.87
Organic Polybases
Spermidine103.5 ± 0.65 Δ96.48 ± 2.8292.4 ± 0.20 *
Polyphenols
Caffeic acid46.8 ± 1.39 *61.52 ± 1.31 *86.04 ± 0.42 *
Ellagic acid94.53 ± 0.31 #89.76 ± 2.97 #100.05 ± 0.55
Ferulic acid56.83 ± 3.53 *60.96 ± 0.87 *85.12 ± 2.72 *
Gallic acid115.89 ± 4.67 #94.30 ± 1.88 Δ95.66 ± 1.55 #
Genistein61.43 ± 2.95 *66.39 ± 0.23 *86.23 ± 1.10 *
Naringin57.83 ± 4.10 *69.61 ± 1.03 *92.52 ± 0.42 *
Propyl gallate57.38 ± 1.53 *63.13 ± 1.83 *83.97 ± 1.15 *
Rutin62.11 ± 3.98 *67.99 ± 0.64 *77.25 ± 0.61 *
The level of glycated BSA estimated by ELISA was reduced by aminoguanidine and pyridoxine in the case of glycoxidation induced by all three sugars and by metformin in the case of glycoxidation induced by ribose. Tiron was protective against glycation induced by all sugars, while captopril against that induced by glucose and fructose. NTA slightly enhanced glycation by glucose. Arginine decreased glycation induced by ribose, carnosine that by fructose. Cysteine and reduced glutathione attenuated glycation by fructose and ribose, while glycine that induced by all sugars. Oxidized glutathione slightly enhanced glycation by glucose and ribose. 1-Cyano-4-hydroxycinnamic acid attenuated glycation induced by all sugars. Lipoic acid and quinic acid slightly protected against glycation by glucose. Para-aminobenzoic acid slightly protected against glycation by fructose and somewhat increased that by glucose and ribose. Pyruvic acid inhibited fructose-induced glycation, but slightly increased that by ribose. Spermidine was protective against ribose-induced glycation. Most polyphenols (caffeic acid, ferulic acid, genistein, naringin, propyl gallate and rutin) protected against glycation induced by all sugars; gallic acid enhanced glycation by glucose and attenuated that by ribose, while ellagic acid slightly enhanced glycation by glucose and decreased that by fructose (Table 5).
Table 5. The effect of various additives (1 mM) on the glycated albumin content in BSA incubated with glucose, fructose and ribose (0.5 M), estimated with the Bovine Glycated Albumin ELISA Kit. The levels of glycated albumin in samples incubated with sugars only are assumed as 100%; Δ p < 0.05, # p < 0.01, * p < 0.001 (paired Student’s t-test).
AdditiveGlucoseFructoseRibose
BSA + sugar, no additive100100100
DMSO98.68 ± 0.76 Δ99.18 ± 2.7999.03 ± 0.87
Standard Antiglycating Agents
Aminoguanidine75.38 ± 0.31 *79.34 ± 0.85 *79.1 ± 4.69 #
Metformin100.01 ± 2.2098.58 ± 0.32 Δ99.39 ± 2.77
Pyridoxine53.24 ± 0.69 *72.82 ± 1.18 *74.48 ± 2.69 *
Antioxidants
Captopril88.08 ± 0.06 *89.35 ± 2.01 *98.06 ± 5.92
Tiron94.79 ± 0.48 *95.00 ± 2.73 Δ95.44 ± 2.47 Δ
Metal Chelators
NTA101.66 ± 0.10 *100.86 ± 0.69105.87 ± 2.26
Amino Acids and Derivatives, Peptides
Arginine100.65 ± 2.4497.34 ± 2.4995.61 ± 0.72 #
Carnosine101.20 ± 3.8287.54 ± 0.41 *92.33 ± 4.76
Cysteamine93.64 ± 1.32 #94.56 ± 1.41 #92.99 ± 8.31
Glutathione oxidized101.24 ± 0.43 Δ99.79 ± 2.77102.68 ± 1.00 Δ
Glutathione reduced98.65 ± 2.7996.47 ± 1.39 Δ91.23 ± 3.57 Δ
Glycine97.25 ± 0.01 *96.67 ± 1.15 Δ98.33 ± 3.85 Δ
Organic Acids
1-Cyano-4-hydroxycinnamic acid86.38 ± 0.27 *82.21 ± 0.46 *82.88 ± 2.30 *
4-Hydroxycinnamic acid102.02 ± 2.58102.53 ± 1.7197.06 ± 5.98
Lipoic acid98.40 ± 0.12 *97.9 ± 3.4998.98 ± 0.04
Para-aminobenzoic acid104.78 ± 1.51 #97.53 ± 1.20 Δ102.57 ± 0.59 Δ
Pyruvic acid98.20 ± 1.7191.35 ± 0.87 *102.62 ± 0.69 Δ
Quinic acid97.65 ± 0.63 #98.50 ± 2.1297.62 ± 2.64
Organic Polybases
Spermidine99.73 ± 1.0497.32 ± 3.5193.11 ± 0.53 #
Polyphenols
Caffeic acid50.43 ± 0.19 *66.40 ± 1.82 *79.48 ± 0.99 *
Ellagic acid101.48 ± 0.472 #94.17 ± 2.664 Δ101.90 ± 0.74
Ferulic acid59.00 ± 0.16 *62.31 ± 2.63 *81.26 ± 1.52 *
Gallic acid116.07 ± 0.13 *100.52 ± 0.4692.50 ± 4.35 Δ
Genistein77.97 ± 1.69 *86.8 ± 0.28 *84.08 ± 1.92 *
Naringin78.20 ± 0.06 *72.53 ± 2.96 *91.43 ± 0.11 *
Propyl gallate53.15 ± 0.20 *65.76 ± 1.01 *73.83 ± 1.42 *
Rutin69.32 ± 0.30 *70.28 ± 0.18 *79.61 ± 4.06 #
Table 6. Correlation coefficients between various parameters of glycoxidation and protein oxidative damage for BSA subject to glycation with various sugars in the presence of eight polyphenols. E, ELISA; F, fluorometry, S, spectrophotometry; p < 0.05, # p < 0.01, * p < 0.005.
Parameters of GlycoxidationAGEs (E)AGEs (F)Dityrosine (F)N'-formylkynurenine (F)Kynurenine (F)Protein Carbonyls (F)
Glucose
AGEs (F)0.926 *
Dityrosine (F)0.963 *0.962 *
N'-formylkynurenine (F)0.4500.5980.636
Kynurenine (F)0.000−0.037−0.0740.090
AOPP (S)0.107−0.0370.0740.3780.750
Carbonyl protein (F)0.857 0.815 0.852 0.504−0.143
Glycated albumin (E)0.857 0.963 *0.926 #0.738−0.0710.821
Fructose
AGEs (F)0.926 #
Dityrosine (F)0.926 #1.000 *
N'-formylkynurenine (F)0.901 #0.972 *0.972 *
Kynurenine (F)−0.1070.0740.0740.036
AOPP (S)0.3930.6300.6300.5590.679
Carbonyl protein (F)0.964 *0.926 #0.926 #0.847 0.000
Glycated albumin (E)0.786 0.926 #0.926 #0.847 0.0740.857
Ribose
AGEs (F)0.786
Dityrosine (F)0.5360.857
N'-formylkynurenine (F)0.7140.964 *0.893 #
Kynurenine (F)−0.143−0.0710.2500.143
AOPP (S)0.6790.5000.5710.393−0.107
Carbonyl protein (F)0.3570.5360.6070.607−0.036
Glycated albumin (E)0.3210.2140.1430.250−0.3210.821

2.3. Validity of Fluorometric and Spectrophotometric Measures of Glycoxidation

In order to check the validity of the results based on the assay of fluorometric and spectrophotometric indices of glycoxidation and protein oxidative damage, the correlation was evaluated between the AGE content evaluated by ELISA and fluorometric parameters (AGE content evaluated fluorometrically, dityrosine, N'-formylkynurenine and kynurenine content), AOPP content evaluated spectrophotometrically, carbonyl group content estimated by a fluorometric test and the level of glucose-, fructose- and ribose-glycated BSA estimated by ELISA. The correlations were evaluated for BSA incubated with various sugars in the presence of various flavonoids (rutin, naringin, gallic acid, propyl gallate, caffeic acid, genistein, ferulic acid and ellagic acid). These substances may interfere with spectroscopic/fluorometric measurements, thus giving less reliable data. The results summarized in Table 6 point to a good correlation between the AGE content evaluated by ELISA and the content of glycated albumin, carbonyl groups and AGE and dityrosine content evaluated fluorometrically. In the case of glycoxidation induced by fructose, the AGE content estimated by ELISA correlated well with glycated albumin, carbonyl groups, AGE, dityrosine and N'-formylkynurenine content evaluated fluorometrically. For glycoxidation induced by ribose, the level of AGEs determined by ELISA showed a statistically significant correlation only with the level of AGEs determined fluorometrically.

3. Discussion

We studied the kinetics and protection against the glycoxidation of albumin, a model protein often used in studies of this type [23]. Albumin is the main protein of blood plasma and has a wide variety of physiological and pharmacological functions, including the maintenance of oncotic pressure, binding and transport of fatty acids, bilirubin, metal ions, nitric oxide and drugs. It contributes also significantly to the antioxidant capacity of blood plasma [3]. In vivo, the proportion of glycated albumin in healthy persons is in the range of 1%–10%; this proportion may increase two- to three-fold in diabetes mellitus [24] and is used as a short-to-intermediate-term marker for glycemic control in diabetes [23]. Therefore, there are good reasons for the use of this protein as a model to study the reactions of glycoxidation.
BSA is a 66.7-kDa protein rich in lysine (59; 10.1%) and arginine residues (23; 3.9%). In vivo, albumin is glycated at the arginine, lysine and cysteine residues. The structural modifications of albumin induced by glycoxidation include an increase in molecular weight and a higher exposure of hydrophobic sites to the solvent [3]. We found that standard indices of protein oxidation (formation of dityrosine, kynurenine, N'-formylkynurenine, AOPP, protein carbonyls and a decrease of tryptophan fluorescence and thiol group content) change in parallel to indices of BSA glycation (levels of AGE and fructosamine). Thus, in vitro glycoxidation of BSA under the atmosphere of air is associated with oxidation, which corresponds to the idea of glycoxidation and justifies the use of indices of protein oxidation to monitor the progress of glycoxidation. Moreover, we looked for a correlation between AGE content determined by ELISA and the levels of AGEs, dityrosine, N'-formylkynurenine and kynurenine determined fluorometrically, as well as AOPP level (estimated spectrophotometrically). The strong correlation between changes in the values of glycophore, dityrosine and N'-formylkynurenine suggests that either these modifications are formed in strict parallel in the system used or that their emission spectra overlap to some extent. Further studies are needed to distinguish between these possibilities. The correlations between the ELISA results and other parameters were lower for glycoxidation induced by fructose and not significant statistically for glycoxidation induced by ribose. These results do not necessarily discredit the application of fluorometric/spectrophotometric parameters for the estimation of glycoxidation induced by sugars other than glucose, especially ribose. Rather, it may be due to the fact that the antibodies used are directed against AGEs induced by glucose and may have lower reactivity for AGEs induced by other sugars.
Comparison of the time course of glycoxidation confirmed the sequence of the rate of glycoxidation, ribose > fructose > glucose, found also by other authors [25]. Suarez et al., found that the rate of glycoxidation by fructose (fructation) was about 10-times higher than that upon glycoxidation by glucose (glucation) [26]. It was also reported that with ribose (ribosylation) gives rise to advanced glycoxidation end products (AGEs) more rapidly than glycoxidation with glucose [27]. Comparison of the initial rates of glycophore formation from the data presented in Figure 1 indicates that this rate is 2.7- and 14.2-times, respectively, higher for fructose and ribose than for glucose. Assuming that the physiological concentrations of glucose, fructose and ribose are 5 mM, 8 μM [12] and 7 μM [14], the relative rates of fructosylation and ribosylation would be about 0.4% and 2.0%, respectively, of that of glucosylation. Thus, ribosylation may contribute significantly to the total glycation of blood plasma protein, especially if the level of ribose is increased.
d-ribose-induced glycoxidation of BSA results in rapid misfolding and formation of amyloid-like aggregates, which are cytotoxic to neural cells [28]. The role of d-ribose in glycoxidation and cross-linking of collagen has been investigated in in vitro studies of the triggering of skin ageing [29]. Luciano Viviani and colleagues prepared proteins glycated with ribose in a study of AGEs and their effects on pancreatic islet beta-cells. Results showed reduced cellular proliferation with a corresponding increase in the cell necrosis and cell apoptosis rate in comparison with untreated cells after five days of exposure to glycoxidation [30].
For studies of the effects of additives on glycoxidation, an incubation time of six days was chosen. This time corresponds to the end of the period of the time-dependent increase in glycoxidation before reaching a plateau. In our opinion, longer incubation times should not be used if the effect of inhibitors on the rate of glycoxidation is studied, as they may blur the inhibitory effects, allowing for reaching the plateau of glycoxidation-induced protein modifications in the presence of inhibitors, albeit after a longer incubation time. The results of the present study report mainly the effects of various substances on the rate of glycoxidation.
The effects of additives were often different for glycoxidation induced by various sugars. Apparently, this is due to different mechanisms of glycoxidation involving various intermediates. Irrespective of the mechanism, this result is important, perhaps providing an explanation of the divergent effects found by researchers studying glycoxidation induced by various sugars and suggesting care in the extrapolation of the results from one glycoxidation model to another.
The results of glycoxidation inhibition by various compounds showed the consistent behavior of the three fluorometric parameters of protein glycoxidation studied (the content of AGEs, dityrosine and N'-formylkynurenine), while the content of formylkynurenine is much less reliable and should not be recommended in studies of such a type. Furthermore, the level of AOPP is less convenient for the measurement of the extent of glycoxidation in the presence of additives for two reasons: (i) the higher variation of the results; and (ii) interference with the additives, which is the apparent reason for the differences in the results with respect to the fluorometric parameters for some compounds.
The study confirmed the glycoxidation-inhibitory action of pyridoxine and aminoguanidine [5]. Metformin and lipoic acid, known to inhibit glycoxidation in vivo, were ineffective in the in vitro system used [31]; apparently, these compounds require metabolic activation (reduction in the case of lipoic acid) and/or exert indirect effects in vivo.
The results confirm the inhibition of glycoxidation by natural polyphenols and indicate that their effect is universal, irrespective of which sugar is inducing glycoxidation (though the extent of inhibition varies between various sugars). Polyphenols, especially flavonoids, have been demonstrated to be effective inhibitors of glycoxidation. Previously, the inhibition of glycoxidation has been demonstrated for various polyphenols, including quercetin, genistein, tannic acid and gallic acid [16,32,33,34,35]. Although the concentration of flavonoids used in this study was high (1 mM), these compounds were also effective at lower concentrations (not shown); moreover, the sugar concentrations used in this study were unphysiologically high, so lower concentrations of protective compounds may be affective with respect to physiological glycoxidation. Anyhow, the effects of inhibitors of glycoxidation should be ascertained under conditions closer to physiological ones [18,19].
Flavonoids bind to albumin (and other proteins) [36], and this binding may enhance their protective efficiency against glycoxidation. As standard antioxidants had a stronger effect than metal chelators, it seems that the inhibitory effects of polyphenols were mainly due to their antioxidant than metal-chelating properties. The results of this study suggest that consumption of a polyphenol-rich diet may attenuate protein glycation to some extent, and the addition of polyphenols can be useful in reducing undesired glycoxidation in food processing.
Of interest is also the finding that 1-cyano-4-hydroxycinnamic acid is also a strong inhibitor of glycoxidation. This compound is known mainly as an inhibitor of monocarboxylate transporters [37], so it cannot be employed in vivo; however, the effect observed may point to a new class of potential inhibitors of glycoxidation.

4. Experimental Section

4.1. Reagents

All basic reagents were from Sigma-Aldrich (Poznan, Poland), unless indicated otherwise. Genistein, 4-hydroxycinnamic acid, naringin and quinic acid were purchased from Santa Cruz Biotechnology, Inc. (Santa Cruz, CA, United States). BSA (purity of 96%) was dissolved in 0.1 M sodium phosphate buffer, pH 7.4, at a concentration of 0.1 mM.

4.2. Glycation Conditions

Three sugars (glucose, fructose and ribose) were used as glycating agents at concentrations of 0.05, 0.1 and 0.5 M. The incubation mixtures contained BSA at a final concentration of 90 μM and 1 mM sodium azide as a preservative. The samples were incubated in closed vials at a temperature of 37 °C for 14 days. Samples were withdrawn, and the parameters of glycoxidation were measured every day.

4.3. Fluorometric Estimates of Glycoxidation

Fluorescence measurements were done by applying 200 µL of the sample on the plate. Fluorescence was measured at a wavelength of 325/440 nm (AGEs), 330/415 nm (dityrosine), 325/494 nm (N'-formylkynurenine), 365/480 nm (kynurenine) and 295/340 nm (tryptophan) [38].

4.4. Amadori Product

The formation of Amadori products was assessed using the method of Johnson and Baker [39], with nitroblue tetrazolium (NBT). One hundred microliters of the sample per well were transferred to a 96-well plate. One hundred microliters of NBT reagent (250 μM NBT in 0.1 M carbonate buffer, pH 10.35) were added to each well, and the plate was incubated at 37 °C for 2 h. Absorbance was measured at 525 nm. An absorption coefficient of 12,640 cm−1 mol−1 for monoformazan [40] was used.

4.5. AOPP and Thiol Assay

AOPP concentration was estimated according to Witko-Sarsat et al. [41] by applying 50 µL of the sample and 150 μL of 0.1 M sodium phosphate buffer, pH 7.4, to microplate wells and adding 10 µL of 1.16 M sodium iodide and 20 µL of concentrated acetic acid. The absorbance was measured immediately at a wavelength of 340 nm. AOPP content was converted to nmol/mg protein. Thiol groups were estimated according to Ellman [42].

4.6. ELISA-Based AGEs, Carbonyl Groups and Bovine Glycated Albumin Assays

AGEs were also assayed with the ELISA Kit for AGEs from USCN Life Science Inc. (Product No. CEB353Ge, Wuhan, China), according to the instruction of the manufacturer. The carbonyl groups were determined by a fluorometric assay (OxiSelect™ Protein Carbonyl Fluorometric Assay, Cell Biolabs, Inc., San Diego, CA, USA) and the level of glucose-, fructose- and ribose-glycated albumin by the Bovine Glycated Albumin ELISA Kit (Shanghai Crystal day Biotech Co., Shanghai, China).

4.7. Prevention of Glycoxidation

For measurements of the effects of other compounds on the process of glycoxidation, BSA (90 μM) was incubated with 0.5 M sugars, azide and the additives (1 mM) for 6 days. The difference between fluorescence values obtained after 6 days and at Time 0 with an additive was compared to that of BSA incubated without any potential inhibitor. Since some compounds (genistein, kaempferol, naringin, rutin, quercitrin, propyl gallate) were dissolved in dimethylsulfoxide (DMSO) and introduced from a stock DMSO solution, the effect of 1% (final) DMSO on the glycoxidation was checked. The level of glycoxidation found in samples containing DMSO was used as a reference in these cases.
Fluorometric and absorptiometric measurements were done in a Tecan Infinite 200 PRO multimode reader (Tecan Group Ltd., Männedorf, Switzerland).

4.8. Statistics

All of the experiments were done at least in triplicate. Data are reported in the form of arithmetic mean values and standard deviations. Differences between means were analyzed using a two-tailed Student’s t-test using STATISTICA, version 10 (2010; StatSoft Inc., Tulsa, OK, USA). Spearman’s rank correlation coefficient analysis was employed to estimate the relationships between two compared values, assuming linear dependence.

5. Conclusions

The present study confirms the sequence of the rate and intensity of glycoxidation induced by different sugars: ribose > fructose > glucose. Our results point to differences in the extent of inhibition by the same compound of glycoxidation induced by various sugars, pointing out that care should be taken in the extrapolation of the results from one sugar to another. We demonstrate efficient inhibition of glycoxidation by various compounds, of which the best inhibitors were polyphenols, pyridoxine and 1-cyano-4-hydroxycinnamic acid.

Acknowledgments

The study has been supported by Grant 2011/01/M/NZ3/02065 from the Polish National Science Center and performed within the COST (European Cooperation in Science and Technology) action CM1001.

Author Contributions

I.S.-B. conceived of and designed the experiments, analyzed the data and wrote the manuscript. S.G. performed the experiments. G.B. participated in the discussion of the results and writing of the manuscript.

Abbreviations

AGEs
advanced glycation end products
AOPP
advanced oxidation protein products
BSA
bovine serum albumin
EDTA
ethylenediaminetetraacetic acid
DETAPA
diethylenetriaminepentaacetic acid
DMSO
dimethylsulfoxide
NBT
nitroblue tetrazolium
NTA
nitrilotriacetic acid
ROS
reactive oxygen species

Conflicts of interest

The authors declare no conflict of interest.

References

  1. Vistoli, G.; de Maddis, D.; Cipak, A.; Zarkovic, N.; Carini, M.; Aldini, G. Advanced glycoxidation and lipoxidation end products (AGEs and ALEs): An overview of their mechanisms of formation. Free Radic. Res. 2013, 47 (Suppl. 1), 3–27. [Google Scholar] [CrossRef] [PubMed]
  2. Peppa, M.; Uribarri, J.; Vlassara, H. Aging and glycoxidant stress. Hormones (Athens) 2008, 7, 123–132. [Google Scholar]
  3. Rondeau, P.; Bourdon, E. The glycation of albumin; structural and functional impacts. Biochimie 2011, 93, 645–658. [Google Scholar]
  4. Muthenna, P.; Akileshwari, C.; Saraswat, M.; Bhanuprakash Reddy, G. Inhibition of advanced glycation end-product formation on eye lens protein by rutin. Br. J. Nutr. 2012, 107, 941–949. [Google Scholar] [CrossRef] [PubMed]
  5. Aldini, G.; Vistoli, G.; Stefek, M.; Chondrogianni, N.; Grune, T.; Sereikaite, J.; Sadowska-Bartosz, I.; Bartosz, G. Molecular strategies to prevent; inhibit; and degrade advanced glycoxidation and advanced lipoxidation end products. Free Radic. Res. 2013, 47 (Suppl. 1), 93–137. [Google Scholar] [PubMed]
  6. Sadowska-Bartosz, I.; Galiniak, S.; Bartosz, G.; Rachel, M. Oxidative modification of proteins in pediatric cystic fibrosis with bacterial infections. Oxid. Med. Cell Longev. 2014, 2014. [Google Scholar] [CrossRef] [PubMed]
  7. Castellani, R.; Smith, M.A.; Richey, P.L.; Perry, G. Glycoxidation and oxidative stress in Parkinson disease and diffuse Lewy body disease. Brain Res. 1996, 737, 195–200. [Google Scholar] [CrossRef]
  8. Rondeau, P.; Navarra, G.; Cacciabaudo, F.; Leone, M.; Bourdon, E.; Militello, V. Thermal aggregation of glycated bovine serum albumin. Biochim. Biophys. Acta. 2010, 1804, 789–798. [Google Scholar] [CrossRef] [PubMed]
  9. Kaufmann, E.; Boehm, B.O.; Süssmuth, S.D.; Kientsch-Engel, R.; Sperfeld, A.; Ludolph, A.C.; Tumani, H. The advanced glycation end-product N epsilon-(carboxymethyl)lysine level is elevated in cerebrospinal fluid of patients with amyotrophic lateral sclerosis. Neurosci. Lett. 2004, 371, 226–229. [Google Scholar] [CrossRef] [PubMed]
  10. Arasteh, A.; Farahi, S.; Habibi-Rezaei, M.; Moosavi-Movahedi, A.A. Glycated albumin: An overview of the in vitro models of an in vivo potential disease marker. J. Diabetes Metab. Disord. 2014, 13. [Google Scholar] [CrossRef]
  11. Ledesma-Osuna, A.I.; Ramos-Clamon, G.; Vazquez-More, L. Characterization of bovine serum albumin glycated with glucose, galactose and lactose. Acta Biochim. Pol. 2008, 55, 491–497. [Google Scholar] [PubMed]
  12. Kawasaki, T.; Akanuma, H.; Yamanouchi, T. Increased fructose concentrations in blood and urine in patients with diabetes. Diabetes Care 2012, 25, 353–357. [Google Scholar] [CrossRef]
  13. Seuffer, R. A new method for the determination of sugars in cerebrospinal fluid. Klin. Chem. Klin. Biochem. 1977, 15, 663–668. [Google Scholar]
  14. Eijnde, B.O.; van Leemputte, M.; Brouns, F.; van der Vusse, G.J.; Labarque, V.; Ramaekers, M.; van Schuylenberg, R.; Verbessem, P.; Wijnen, H.; Hespel, P. No effects of oral ribose supplementation on repeated maximal exercise and de novo ATP resynthesis. J. Appl. Physiol. 2001, 91, 2275–2281. [Google Scholar] [PubMed]
  15. Salahuddin, P.; Rabbani, G.; Khan, R.H. The role of advanced glycation end products in various types of neurodegenerative disease: A therapeutic approach. Cell. Mol. Biol. Lett. 2014, 19, 407–437. [Google Scholar] [CrossRef] [PubMed]
  16. Lv, L.; Shao, X.; Chen, H.; Ho, C.T.; Sang, S. Genistein inhibits advanced glycation end product formation by trapping methylglyoxal. Chem. Res. Toxicol. 2011, 24, 579–586. [Google Scholar] [CrossRef] [PubMed]
  17. Ramkissoon, J.S.; Mahomoodally, M.F.; Ahmed, N.; Subratty, A.H. Antioxidant and anti-glycation activities correlates with phenolic composition of tropical medicinal herbs. Asian Pac. J. Trop. Biomed. 2013, 6, 561–569. [Google Scholar] [CrossRef]
  18. Vlassopoulos, A.; Lean, M.E.; Combet, E. Protein-phenolic interactions and inhibition of glycation—Combining a systematic review and experimental models for enhanced physiological relevance. Food Funct. 2014, 5, 2646–2655. [Google Scholar] [CrossRef] [PubMed]
  19. Verzelloni, E.; Pellacani, C.; Tagliazucchi, D.; Tagliaferri, S.; Calani, L.; Costa, L.G.; Brighenti, F.; Borges, G.; Crozier, A.; Conte, A.; et al. Antiglycative and neuroprotective activity of colon-derived polyphenol catabolites. Mol. Nutr. Food Res. 2011, 55 (Suppl. 1), S35–S43. [Google Scholar] [CrossRef]
  20. Zhang, X.; Hu, S.; Chen, F.; Wang, M. Treatment of proteins with dietary polyphenols lowers the formation of AGEs and AGE-induced toxicity. Food Funct. 2014, 24, 2656–2661. [Google Scholar] [CrossRef]
  21. Frizzell, N.; Baynes, J.W. Chelation therapy for the management of diabetic complications; a hypothesis and a proposal for clinical laboratory assessment of metal ion homeostasis in plasma. Clin. Chem. Lab. Med. 2014, 52, 69–75. [Google Scholar] [CrossRef] [PubMed]
  22. Nagai, R.; Murray, D.B.; Metz, T.O.; Baynes, J.W. Chelation: A fundamental mechanism of action of AGE inhibitors, AGE breakers, and other inhibitors of diabetes complications. Diabetes 2012, 61, 549–559. [Google Scholar] [CrossRef] [PubMed]
  23. Anguizola, J.; Matsuda, R.; Barnaby, O.S.; Hoy, K.S.; Wa, C.; Debolt, E.; Koke, M.; Hage, D.S. Review: Glycation of human serum albumin. Clin. Chim. Acta 2013, 425, 64–76. [Google Scholar] [CrossRef] [PubMed]
  24. Bourdon, N.; Loreau, N.; Blache, D. Glucose and free radicals impair the antioxidant properties of serum albumin. FASEB J. 1999, 13, 233–244. [Google Scholar] [PubMed]
  25. Luers, L.; Rysiewski, K.; Dumpitak, C.; Birkmann, E. Kinetics of advanced glycation end products formation on bovine serum albumin with various reducing sugars and dicarbonyl compounds in equimolar ratios. Rejuvenation Res. 2012, 15, 201–205. [Google Scholar] [CrossRef] [PubMed]
  26. Suárez, G.; Rajaram, R.; Oronsky, A.L.; Gawinowicz, M.A. Nonenzymatic glycation of bovine serum albumin by fructose (fructation). Comparison with the Maillard reaction initiated by glucose. J. Biol. Chem. 1989, 264, 3674–3679. [Google Scholar] [PubMed]
  27. Han, C.; Lu, Y.; Wei, Y.; Liu, Y.; He, R. d-Ribose induces cellular protein glycation and impairs mouse spatial cognition. PLoS One 2011, 6, e24623. [Google Scholar] [CrossRef]
  28. Wei, Y.; Chen, L.; Chen, J.; Ge, L.; He, R.Q. Rapid glycation with d-ribose induces globular amyloid-like aggregations of BSA with high cytotoxicity to SH-SY5Y cells. BMC Cell Biol. 2009, 10. [Google Scholar] [CrossRef]
  29. Tanaka, S.; Avigad, G.; Brodsky, B.; Eikenberry, E.F. Glycation induces expansion of the molecular packing of collagen. J. Mol. Biol. 1988, 203, 495–505. [Google Scholar] [CrossRef] [PubMed]
  30. Luciano Viviani, G.; Puddu, A.; Sacchi, G.; Garuti, A.; Storace, D.; Durante, A.; Monacelli, F.; Odetti, P. Glycated fetal calf serum affects the viability of an insulin-secreting cell line in vitro. Metabolism 2008, 57, 163–169. [Google Scholar] [CrossRef]
  31. Vallianou, N.; Evangelopoulos, A.; Koutalas, P. α-Lipoic acid and diabetic neuropathy. Rev. Diab. Stud. 2009, 6, 230–236. [Google Scholar] [CrossRef]
  32. Tarwadi, K.V.; Agte, V.V. Effect of micronutrients on methylglyoxal-mediated in vitro glycation of albumin. Biol. Trace Elem. Res. 2011, 143, 717–725. [Google Scholar] [CrossRef]
  33. Bournival, J.; Francoeur, M.A.; Renaud, J.; Martinoli, M.G. Quercetin and sesamin protect neuronal PC12 cells from high-glucose-induced oxidation; nitrosative stress; and apoptosis. Rejuvenation Res. 2012, 15, 322–333. [Google Scholar] [CrossRef] [PubMed]
  34. Xie, Y.; Chen, X. Structures required of polyphenols for inhibiting advanced glycation end products formation. Curr. Drug Metab. 2013, 14, 414–431. [Google Scholar] [CrossRef] [PubMed]
  35. Obrenovich, M.E.; Nair, N.G.; Beyaz, A.; Aliev, G.; Reddy, V.P. The role of polyphenolic antioxidants in health, disease, and aging. Rejuvenation Res. 2010, 13, 631–643. [Google Scholar] [CrossRef] [PubMed]
  36. Pal, S.; Saha, C. A review on structure-affinity relationship of dietary flavonoids with serum albumins. J. Biomol. Struct. Dyn. 2014, 32, 1132–1147. [Google Scholar] [CrossRef] [PubMed]
  37. Briski, K.P.; Patil, G.D. Induction of Fos immunoreactivity labeling in rat forebrain metabolic loci by caudal fourth ventricular infusion of the monocarboxylate transporter inhibitor, alpha-cyano-4-hydroxycinnamic acid. Neuroendocrinology 2005, 82, 49–57. [Google Scholar] [CrossRef] [PubMed]
  38. Sadowska-Bartosz, I.; Adamczyk-Sowa, M.; Galiniak, S.; Mucha, S.; Pierzchala, K.; Bartosz, G. Oxidative modification of serum proteins in multiple sclerosis. Neurochem. Int. 2013, 63, 507–516. [Google Scholar] [CrossRef] [PubMed]
  39. Johnson, R.; Baker, J. Assay of serum fructosamine: Internal vs. external standardization. Clin. Chem. 1987, 33, 1955–1956. [Google Scholar] [PubMed]
  40. Mironova, R.; Niwa, T.; Handzhiyski, Y.; Sredovska, A.; Ivanow, I. Evidence for non-enzymatic glycosylation of Escherichia coli chromosomal DNA. Mol. Microbiol. 2005, 55, 1801–1811. [Google Scholar] [CrossRef] [PubMed]
  41. Witko-Sarsat, V.; Friedlander, M.; Capeillere-Blandin, C.; Nguyen-Khoa, T.; Nguyen, A.T.; Zingraff, J.; Jungers, P.; Descamps-Latscha, B. Advanced oxidation protein products as a novel marker of oxidative stress in uremia. Kidney Int. 1996, 49, 1304–1313. [Google Scholar] [CrossRef] [PubMed]
  42. Ellman, G.L. Tissue sulfhydryl groups. Arch. Biochem. Biophys. 1959, 82, 70–77. [Google Scholar] [CrossRef] [PubMed]
  • Sample Availability: Samples of the compounds are available from the authors.

