Article Text

Abstract
Objective Assessment of total energy expenditure (TEE) is essential for appropriate recommendations regarding dietary intake and physical activity in patients with and without diabetes mellitus (DM). However, few reports have focused on TEE in patients with DM, particularly in Asian countries. Therefore, we evaluated TEE in Japanese patients with DM using the doubly labeled water (DLW) method and physical activity level (PAL).
Research design and methods In this cross-sectional observational study, we evaluated 52 patients with type 2 DM and 15 patients without DM. Free-living TEE was measured over 12–16 days by the DLW method, and PAL was calculated as TEE divided by the basal metabolic rate (BMR) as assessed by indirect calorimetry. The equivalence margin was defined as 5 kcal/kg/day.
Results The numbers of patients with DM treated with insulin, oral antidiabetic drugs, and diet were 18 (34.6%), 20 (38.5%), and 14 (26.9%), respectively. The mean±SD level of glycated hemoglobin was 6.9%±0.8% and 5.5%±0.3% in the DM and non-DM group, respectively (p<0.001). The mean body mass index was 23.3±3.0 and 22.7±2.1 kg/m2 in the DM and non-DM group, respectively. The mean TEE per kilogram body weight adjusted for sex and age was 36.5 kcal/kg/day and 37.5 kcal/kg/day in the DM and non-DM group, respectively, with no significant difference (mean difference, −1.0 kcal/kg/day; 95% CI -4.2 to 2.3 kcal/kg/day). The BMR tended to be higher in the DM than in the non-DM group (mean difference, 33 kcal/day; 95% CI, −15 to 80 kcal/day). The mean PAL adjusted for sex and age was 1.71 and 1.81 in the DM and non-DM group, respectively, without a significant difference (mean difference, −0.10; 95% CI −0.21 to 0.01).
Conclusion TEE was comparable between Japanese patients with and without DM.
Trial registration number UMIN000023051.
- energy expenditure
- physical activity
- type 2 diabetes
This is an open access article distributed in accordance with the Creative Commons Attribution Non Commercial (CC BY-NC 4.0) license, which permits others to distribute, remix, adapt, build upon this work non-commercially, and license their derivative works on different terms, provided the original work is properly cited, appropriate credit is given, any changes made indicated, and the use is non-commercial. See: http://creativecommons.org/licenses/by-nc/4.0/.
Statistics from Altmetric.com
Significance of this study
What is already known about this subject?
The basal metabolic rate may be higher in patients with than without diabetes mellitus.
The impact of diabetes mellitus on total energy expenditure remains unclear.
What are the new findings?
Total energy expenditure seems to be comparable between patients with and without diabetes mellitus.
The basal metabolic rate tends to be higher in patients with than without diabetes mellitus.
The physical activity level may be slightly lower in patients with than without diabetes mellitus.
How might these results change the focus of research or clinical practice?
Total energy expenditure is comparable between patients with and without diabetes mellitus; thus, it is likely to provide similar calories per kilogram in both populations.
Introduction
Diet therapy and physical activity are fundamental for patients with diabetes mellitus (DM).1 Total energy expenditure (TEE) is variable because of many factors. The ideal daily caloric intake is an essential information for appropriate recommendations regarding dietary intake and physical activity both in patients with DM and in healthy people.
TEE comprises the basal metabolic rate (BMR), diet-induced thermogenesis, and activity energy expenditure. The BMR is affected by many factors, including age, sex, height, body weight, fat-free mass (FFM), and hormonal factors such as the thyroid hormone and catecholamine levels. The estimated BMR is calculated with a formula that includes age, sex, height, and body weight.2 3 Diet-induced thermogenesis is the energy expenditure required for digestion, absorption, and conversion of food or nutrients, and consists of about 10% of TEE in the general population. Activity energy expenditure is the most variable component of TEE in each individual and consists of non-exercise energy expenditure and exercise energy expenditure.
TEE can be measured or estimated by various methods. Dietary surveys are often used in the clinical setting based on the assumption that TEE is equal to the total energy intake while the body weight is stable; however, the accuracy of the dietary survey has been reconsidered, especially in obese patients.4 Various wearable devices with triaxial accelerometers can measure physical activity and calculate TEE using the estimated BMR according to age and sex.5 Although these methods may be useful and cost-effective for personal monitoring, the metabolic chamber method and the doubly labeled water (DLW) method are the gold standard measurement techniques for TEE. Direct comparison of TEE between subjects with and without DM using either the metabolic chamber method or DLW method has also been reported. A Danish study using the metabolic chamber method showed higher TEE in subjects with DM than without DM after matching for age, sex, body weight, and activity level.6 7 The metabolic chamber method allows for precise measurement of diet-induced thermogenesis with multiple blood sampling; however, subjects’ physical activity in such studies may differ from their habitual level. The DLW method is very expensive but can measure free-living TEE in many populations according to various attributes such as sex, age, occupation, residential area, and pathologic condition.8 However, few reports to date have shown the impact of DM on TEE, particularly in Asian countries.4 9–11 Therefore, we evaluated TEE in Japanese patients with and without DM using the DLW method. We also calculated the physical activity level (PAL) in the free-living condition.
Methods
Study participants
Patients with and without DM at Shiga University of Medical Science (SUMS) Hospital, Shiga, Japan were invited to participate in this study. Before we checked patients’ eligibility, we screened them by analyzing the distribution of age, body mass index (BMI), sex, glycated hemoglobin (HbA1c) level, and treatment regimen in patients with DM (DM group), and the distribution of age, BMI, and sex in patients without DM (non-DM group), among all patients who visited the outpatient clinic of our endocrinology department from August 2016 to May 2017. The inclusion criteria for the DM group were as follows: outpatients with type 2 DM, age 60–79 years, and BMI of 18 to <35 kg/m2. The inclusion criteria for the non-DM group were as follows: outpatients who were visiting the SUMS Hospital for dyslipidemia, hypertension, and obesity; age 60–79 years; and BMI of 18 to <35 kg/m2. The non-DM group comprised patients without diabetic medications and without past or current DM, or with an HbA1c level of <6.0% within 1 year. The exclusion criteria are presented in online supplementary information 1.
Supplemental material
The DM group comprised three subgroups of patients: those with DM treated by insulin (DM-Insulin), DM treated by oral antidiabetic drugs (OADs) (DM-OAD), and DM treated by diet (DM-Diet). Each group had a 1:1 sex ratio and an HbA1c distribution similar to that of each treatment population at the SUMS Hospital. The non-DM group also had a 1:1 sex ratio and a BMI distribution similar to that of the DM group. The nature and potential risks of the study were explained to all participants, and written informed consent was obtained. The study is registered at UMIN Clinical Trials Registry (http://www.umin.ac.jp/ctr/index.htm).
Study schedule
This study involved two scheduled visits separated by 12–16 days. At visit 1, patients’ body weight and other baseline information were obtained. The BMR was measured by indirect calorimetry, and the body composition was measured by bioelectrical impedance analysis. Fasting blood and urine samples were collected to evaluate patients’ metabolic conditions. The DLW method was started at visit 1 for measurement of TEE. Physical activity was measured using a triaxial accelerometer between visits 1 and 2. Dietary intake was recorded on 3 of the 12–16 days. At visit 2, blood and urine samples were taken for TEE measurement.
Weight and body composition
The body weight of each participant, without shoes and with light clothing weighing a maximum of 0.1 kg, was recorded using an electronic scale (BF-220; Tanita, Tokyo, Japan). The percentage of body fat was determined by a bioelectrical impedance analyzer (SFB7; ImpediMed, Queensland, Australia).
Laboratory analyses
Blood samples were taken after an overnight fast at both the beginning (visit 1) and end of the 2-week observation period (visit 2). The plasma and urinary glucose levels were measured using the hexokinase glucose 6-phosphate dehydrogenase ultraviolet method. The serum insulin level was measured by a chemiluminescent enzyme immunoassay. The serum triglyceride and total cholesterol levels were determined enzymatically and by the cholesterol dehydrogenase ultraviolet method, respectively. The serum high-density lipoprotein cholesterol level was determined by a direct method. The low-density lipoprotein cholesterol level was calculated using the Friedewald equation (total cholesterol − [high-density lipoprotein cholesterol + triglyceride/5]). The HbA1c level was measured by the latex agglutination method.
Measurement of TEE by the DLW method
TEE was measured by the DLW method (modified two-point approach). An oral dose of 0.1 g 2H2O (2H2O 99.9 atom %; Taiyo Nippon Sanso, Tokyo, Japan) and 2.0 g H218O (H218O 10.0 atom %; Taiyo Nippon Sanso) per kilogram of estimated total body water was given on visit 1. The DLW was sterilized by filtering it through a 0.22 µm filtering system and sealed in a sterile 125 mL bottle (Nalgene, Rochester, New York, USA). Baseline blood (BLB) and urine (BLU) samples were collected before a dose of DLW. An oral dose of DLW was given at around 09:00 (0 hour). After the dose of DLW, the bottle was rinsed twice with 25 mL of tap water that was also consumed. A BLB sample was collected before the dose of DLW. The patients voided urine at 2 hours, and 3-hour and 4-hour postdose blood samples (PD3B and PD4B, respectively) and 3-hour and 4-hour postdose urine samples (PD3U and PD4U, respectively) were collected. The morning after visit 1, a urine sample was collected at home (D1U). On the mornings of days 12–16 (visit 2), samples at the end of the period were collected once for blood (ED1B) and twice for urine (ED1U and ED2U) at a 1-hour interval. The plasma was separated by centrifugation for 15 min at 4°C, then transferred to an airtight screw-capped container and immediately frozen at −30°C. Isotope analyses of the blood and urine samples were performed in duplicate using an isotope-ratio mass spectrometer (Hydra 20-20 Stable Isotope Mass Spectrometer; Sercon, Crewe, UK). The 2H:1H ratio was analyzed by hydrogen gas equilibration using a platinum catalyst. The 18O:16O ratio was analyzed after carbon dioxide equilibration. Isotope analyses were carried out at ESTech Kyoto (Kyoto, Japan). The average SD for the analyses was 1.2‰ for 2H and 0.10‰ for 18O. The urine samples (BLU, PD4U, and ED2U) and the blood samples (BLB, PD4B, and ED1B) were used to calculate TEE, and the average value was used for each patient (a modified two-point approach based on a handbook for the DLW method). For the first five patients, a blood sample at ED1B was not obtained. Therefore, TEE was calculated from the urine samples (BLU, PD4U, and ED1U) and those from day 1 (D1U) and ED2U. The 18O and 2H dilution spaces were determined by the plateau method when using PD4 samples, while the intercept method using D1U and ED1U samples was adopted for the first five participants. Total body water was calculated as the mean of the dilution space estimated by 2H and 18O (No and Nd) calculated from the mean value of the isotope pool size of 2H divided by 1.041 and that of 18O divided by 1.007.12 Nd/No in the present study was 1.025±0.006 (range, 1.015–1.037). The carbon dioxide production rate (rCO2) was calculated according to the following equation: rCO2=0.4554 × total body water × (1.007 × 18O elimination rate − 1.041 × 2H elimination rate).
TEE was calculated according to the following equation:

The food quotient was calculated using a brief self-administered diet history questionnaire.13 If the two calculated TEE values obtained by urine and blood differed by >8%, all samples for the participant were reanalyzed (n=9). Additionally, when the error of the duplicate analyses of each isotopic abundance analysis was large (n=5) or the results were suspicious for other reasons (eg, larger at ED2 than at ED1) (n=7), all of these samples were reanalyzed even if the agreement of the two TEE values was within 8%. For two participants, the difference remained large after the reanalysis; thus, TEE was calculated in the same way as for the first five participants. The average difference in TEE obtained by urine and blood samples was 16±114 kcal/day (0.9%±5.1%). We used two different samples (urine + blood and urine only) to calculate TEE in the present study, and the degree of agreement was examined in patients from whom both samples were obtained. The average difference was 14±41 kcal/day (0.7%±1.9%).
Measurement of BMR
The BMR was measured by indirect calorimetry (Quark RMR; COSMED, Rome, Italy). Before measurement of BMR, the patients were instructed to ingest only water for 12 hours. The test was performed between 08:30 and 10:00. The Quark RMR measures the volume of oxygen consumed and the volume of carbon dioxide expired and calculates the BMR using the modified Weir equation.14 Before measurement, the procedure was explained to the patients, who had comfortably rested on a bed for 30 min. After the machine was calibrated, a canopy was placed to cover the patient’s face and upper body. A steady state was achieved for more than 5 min by the Quark BMR after 10–15 min of breathing while the patient lay awake in the supine position.
Evaluation of PAL
The PAL was calculated using the following equation: PAL=(TEE estimated by DLW method) / (BMR measured by indirect calorimetry).8 In addition, physical activity and sedentary behavior were measured with a triaxial accelerometer (Active Style Pro, HJA-750C; Omron Healthcare, Kyoto, Japan). The patients wore the accelerometer on their waist for 2 weeks except under special circumstances, such as dressing, bathing, and swimming. The device is described in detail elsewhere.15 16 Metabolic equivalents (METs) were calculated by two different equations for ambulatory and non-ambulatory activities.
Step counts were also measured because they have been widely used in many studies and investigations to objectively evaluate physical activity. Moreover, total physical activity of light, moderate, and vigorous intensity was obtained as a sum of the ambulatory time and non-ambulatory time.
Statistical analysis
We calculated the sample size based on the results of a study performed in Scotland,9 which reported the TEE in patients with DM as measured with the DLW method. For application of this calculation to Japanese patients, we selected the data of patients with a BMI of <30 kg/m2, and the mean TEE of these patients was 39.5 kcal/kg/day with an SD of 5.95. We defined 5 kcal/kg/day as the equivalence margin. Twenty-three patients per group were required to detect a difference between the DM and non-DM groups (power=0.8, α=0.05, 1:1 ratio). Because we wanted to include three different therapeutic subgroups, we set the final sample size as 60 for the DM group and 20 for the non-DM group.
Data are expressed as mean±SD or median (IQR) for continuous variables and n (%) for categorical variables. Normal distribution was tested using the Anderson-Darling test. TEE, BMR, and PAL were compared using analysis of covariance between the DM and non-DM groups and are expressed as mean (95% CI). Subgroup analysis was performed in each of the three DM treatment groups: DM-Insulin, DM-OAD, and DM-Diet. Multivariable models adjusted for sex, age, FFM, fat mass (FM), and average METs were used to control confounders. A two-tailed p value of <0.05 was considered statistically significant for superiority. For the equivalence, 5 kcal/kg/day was set as the equivalence margin according to the mean difference between the DM and non-DM groups with 95% CI.17 Statistical analyses were performed with SAS V.9.4.
Results
Study participants
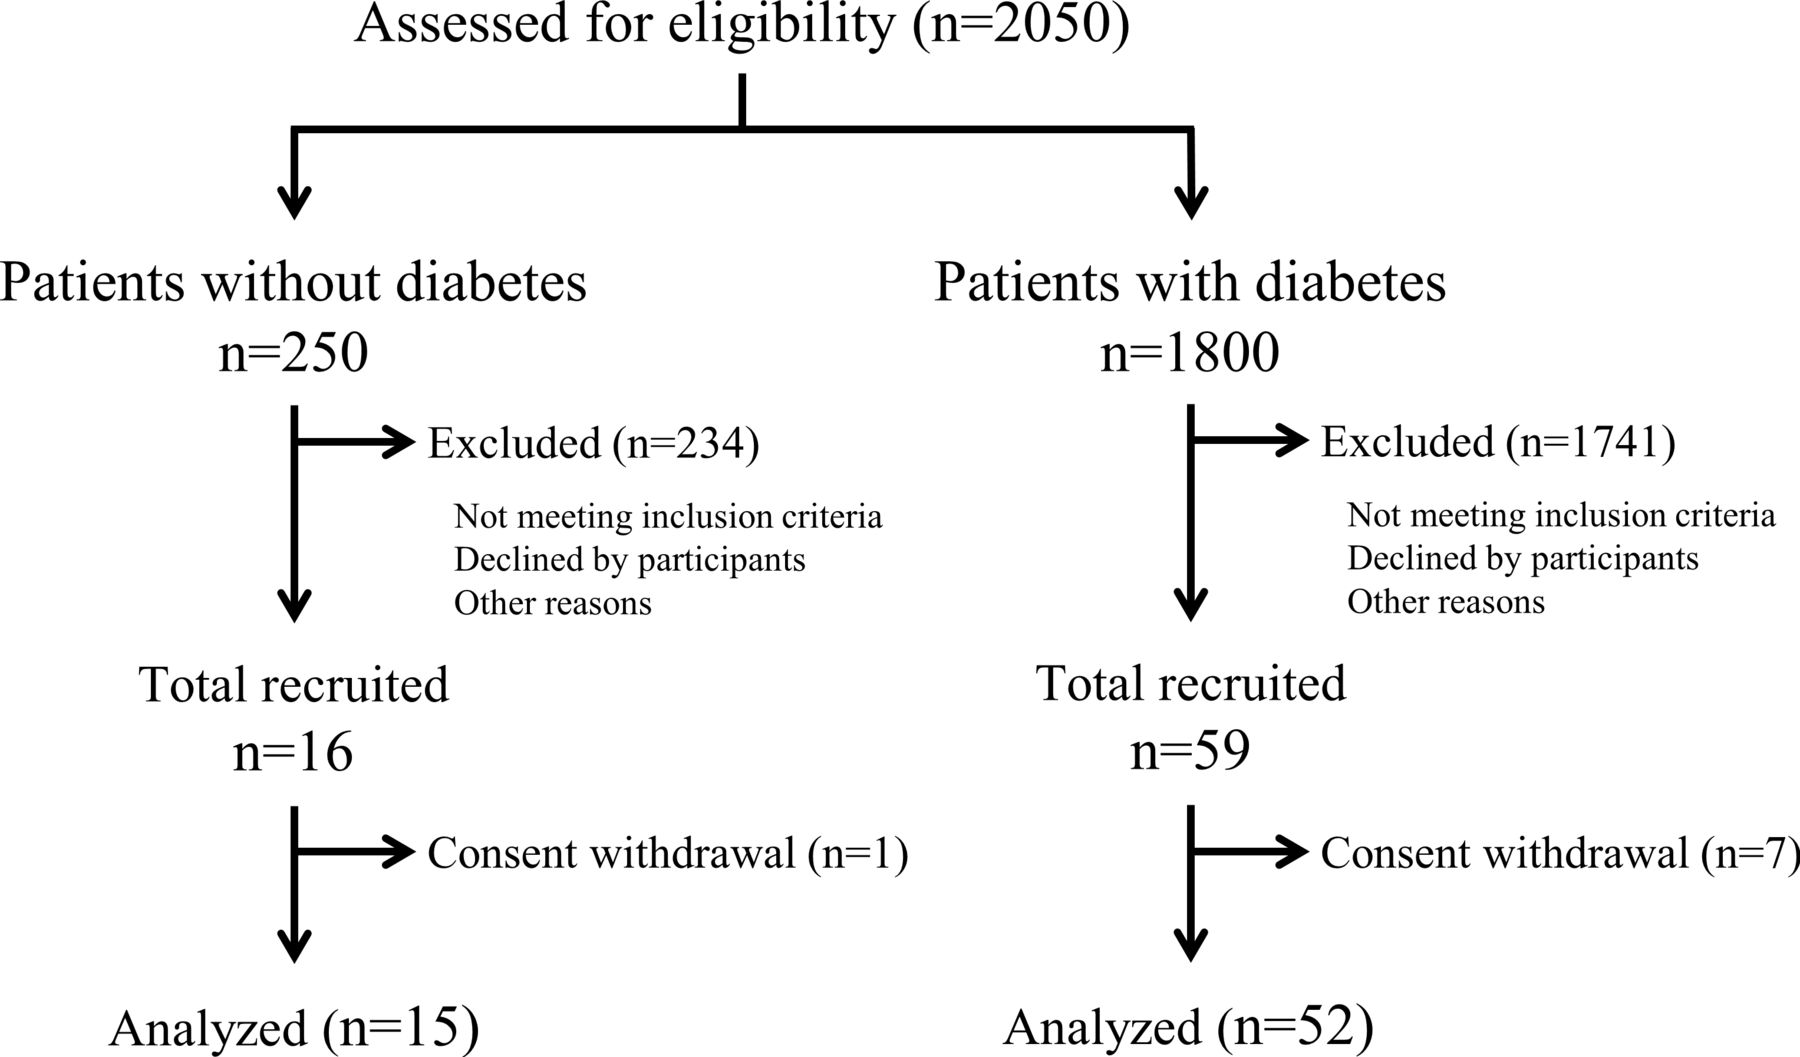
The flow diagram of the study participants is shown in figure 1. Before enrollment, we screened 2050 outpatients to evaluate the prevalence of DM and its treatment, as well as the distribution of age, sex, BMI, and HbA1c. Of these 2050 patients, 16 and 59 patients were enrolled in the non-DM and DM groups according to the inclusion criteria explained in the Methods section. After exclusion of 1 patient from the non-DM group and 7 patients from the DM group who withdrew their consent, 15 and 52 patients were included for analysis in the non-DM and DM groups, respectively.
Study flow diagram.
The characteristics of the study participants are shown in table 1. Although all patients were 60–79 years old, the mean age was significantly higher in the DM than in the non-DM group. BMI, FM, and FFM were not different between the two groups. The fasting plasma glucose, HbA1c, and glycoalbumin levels were higher in the DM than in the non-DM group. The total cholesterol and low-density lipoprotein cholesterol levels were lower in the DM than in the non-DM group. Among all patients with DM, the percentages of patients in the DM-Insulin, DM-OAD, and DM-Diet subgroups were 34.6%, 38.5%, and 26.9%, respectively.
Characteristics of study participants
Energy expenditure
Unadjusted TEE/kg/day was 37.8 kcal/kg/day (95% CI 34.9 to 40.7) in the non-DM group and 36.4 kcal/kg/day (95% CI 34.8 to 37.9) in the DM group as assessed by the DLW method (table 2). After adjustment for sex, age, FFM, and FM, TEE/kg/day was 37.5 kcal/kg/day (95% CI 35.2 to 39.9) in the non-DM group and 36.5 kcal/kg/day (95% CI 35.2 to 37.7) in the DM group, showing that the DM group had a slightly lower mean value (mean difference, −1.1; 95% CI −3.8 to 1.6; p=0.425). After further adjustment with the average METs to overcome individual PALs, the difference in TEE/kg/day between the two groups showed no significant difference (mean difference, −1.1; 95% CI −3.9 to 1.6; p=0.415). The equivalence margin was set at 5 kcal/kg/day to indicate clinical significance. Therefore, we considered that energy expenditure between the two groups was comparable.
Total energy expenditure, basal metabolic rate, and physical activity level in the non-DM and DM groups
Unadjusted TEE was 2168 kcal/day (95% CI 1971 to 2366) in the non-DM group and 2159 kcal/day (95% CI 2053 to 2264) in the DM group as assessed by the DLW method (table 2, online supplementary figure 1). After adjustment for sex, age, FFM, and FM, TEE was 2221 kcal/day (95% CI 2087 to 2355) in the non-DM group and 2143 kcal/day (95% CI 2073 to 2214) in the DM group, showing that the DM group had a slightly lower mean value (mean difference, −77; 95% CI −231 to 77; p=0.319). After further adjustment with the average METs, the difference in TEE between the two groups remained statistically non-significant (mean difference, −79; 95% CI −235 to 78; p=0.319).
Supplemental material
BMR and PAL
The unadjusted BMR tended to be higher in the DM than in the non-DM group (mean difference, 66; 95% CI −28 to 160; p=0.165). After adjustment for sex, age, and FFM, the DM group had a slightly higher mean value (mean difference, 29; 95% CI −20 to 78; p=0.245). Conversely, PAL adjusted for sex and age tended to be lower in the DM than in the non-DM group (mean difference, −0.10; 95% CI −0.21 to 0.01; p=0.069).
Subgroup analysis by DM treatment
A similar analysis was performed in each DM treatment subgroup (table 3). TEE/kg/day adjusted by age, sex, FFM, FM, and METs was not significantly different among the DM-Insulin, DM-OAD, and DM-Diet subgroups. In contrast, the BMR tended to be higher in the DM-Insulin than DM-OAD and DM-Diet subgroups, although there was no significant difference (table 3).
Total energy expenditure, basal metabolic rate, and physical activity level in the non-DM group and three DM subgroups
Discussion
The current study revealed three important findings. First, TEE was comparable between patients with and without DM. Second, the mean TEE was slightly lower and the mean BMR was slightly higher in patients with than without DM, although the difference was not statistically significant. Third, the PAL tended to be lower in patients with than without DM. These data suggest that recommendations regarding dietary intake in patients with DM can be determined using an equation similar to that used in patients without DM.
TEE was comparable between patients with and without DM (table 2). This is inconsistent with a previous study of Pima Indians,10 which showed no significant difference in TEE as measured by the metabolic chamber method between 49 patients with DM and 102 participants without DM; however, the patients with DM had significantly higher TEE after adjustment for age, sex, FFM, and FM. A Danish study11 also showed no significant difference in unadjusted TEE as measured by the metabolic chamber method between 31 patients with DM and 61 patients without DM, but TEE was significantly higher in patients with DM after adjustment for sex, age, FFM, FM, and physical activity (mean difference, 164 kcal/day; SD, 31 kcal/day; p<0.01). In a US study using the DLW method, TEE was not significantly different between 9 obese subjects without DM and 12 obese subjects with DM (p=0.496).4 Direct comparison by the DLW method was recently reported in 10 Japanese patients without DM and 12 with DM, showing no significant difference between the two groups.18Online supplementary table 1 summarizes the TEE values measured either by the metabolic chamber method or DLW method in patients with DM. The reason for the inconsistency is uncertain, but we speculate that it occurred partly because of the difference between the metabolic chamber and DLW methods. The metabolic chamber method provides TEE in a confined space; instead, the DLW method provides more information regarding physical activity under free-living conditions. Each study involves different ethnicities, BMIs, and models for adjustment. Because TEE may vary by individual physical activity and our results may not be sufficient to make conclusions between two groups, we tested TEE using a METs-adjusted model in which METs were directly estimated by an accelerometer. As a result, METs-adjusted TEE was also comparable between patients with and without DM (table 2, model 4).
The BMR was slightly higher in patients with than without DM. This is consistent with previous studies that showed a higher BMR in subjects with DM.11 19 20 In one of these studies, the BMR was significantly higher among participants with an abnormal HbA1c level.20 In contrast, the BMR adjusted for age, sex, HbA1c level, and fasting glucose level tended to be higher in patients with than without DM in the present study (mean difference, 80 kcal/day; 95% CI −5 to 166; p=0.065) (online supplementary table 2). Interestingly, a recent study showed that lower BMRs were found in subjects with a family history of DM who developed DM later in life.21 In the above-mentioned study of Pima Indians, an increased BMR was observed in subjects with DM and in those with impaired glucose intolerance,22 suggesting that a threshold of an increase in the BMR exists between individuals with normal and impaired glucose tolerance and that hyperglycemia is not a sole cause of an increased BMR. Another study showed that insulin treatment was negatively correlated with the BMR in Japanese patients with type 2 DM. In the same study, endogenous insulin secretion determined by the glucagon test was also an independent factor for the BMR.23 Our study produced a similar finding in that the DM-Insulin and DM-OAD subgroups had a slightly higher BMR than the DM-Diet subgroup and non-DM group, although the difference was not statistically significant (table 3).
The PAL tended to be lower in patients with than without DM (1.71 vs 1.81, respectively) (table 2). Previous reports using the DLW method showed similar PALs in healthy older Caucasians (male, 1.65; female, 1.51) and African–Americans (male, 1.62; female, 1.41).24 A recent study of 99 older patients also showed a similar PAL level (1.68).25 In the present study, the mean difference was 0.1, which equates to a maximum of about 120–150 kcal/day in a normal adult. In addition, physical activity varies among study participants; thus, caution is needed when generalizing this difference to other populations because of selection bias. However, this difference may be ignorable.
This study has three main strengths. First, a comprehensive analysis was employed to measure energy expenditure between patients with and without DM, including the DLW method, indirect calorimetry, bioelectrical impedance analysis, and triaxial accelerometry. Second, equivalence was determined by the threshold of 5 kcal/kg/day with the 95% CI of the mean difference. Third, our patients with DM consisted of DM-Insulin, DM-OAD and DM-Diet subgroups (table 3). Among these subgroups, TEE was comparable, but the BMR tended to be higher in the DM-Insulin subgroup than in the DM-OAD and DM-Diet subgroups, although there was no significant difference.
This study also has some limitations. First, the number of participants was relatively small due to the cost of the DLW method. Further study is necessary to determine the statistical difference between the two groups with enough statistical power. Although we carefully selected participants to mimic the distribution of our entire outpatient population, selection bias is a major concern in this study. We selected patients aged 60–79 years and avoided those with an extremely high or low BMI. The HbA1c distribution was carefully matched to each treatment cohort, and the BMI distribution was matched between the DM and non-DM groups. Second, we observed a significant difference in age between the DM and non-DM groups (70.2 vs 67.1 years, respectively). Thus, we statistically adjusted patients’ age throughout the study when we compared the two groups. Third, the body composition was determined by the bioelectrical impedance method instead of a dual-energy X-ray absorptiometry scan. The adjusted TEE by FFM measured with the bioelectrical impedance method may be inaccurate. Fourth, the patients in the non-DM group were outpatients who did not have DM but who regularly visited the same hospital for dyslipidemia, hypertension, and other conditions. These patients might have had a different lifestyle than healthy volunteers. This point is both a limitation and strength of this study. As another potential bias, the study participants were recruited at a single hospital. Therefore, any generalizations must be made with caution.
In conclusion, TEE was comparable between Japanese patients with and without DM, although the BMR and PAL were slightly different between the two groups. Thus, it may be reasonable to apply the same dietary recommendations of the general population to patients with DM. Further study is necessary to confirm these findings for application to clinical practice.
Acknowledgments
The authors thank the participants and the CLEVER-DM Study investigators for their involvement in this study. CLEVER-DM: Clinical Evaluation of Energy Requirements in Patients with Diabetes Melitus.
References
Footnotes
Presented at Parts of this study were presented in abstract form at the 78th Scientific Sessions of the American Diabetes Association, Orlando, Florida, June 22–26, 2018.
Collaborators A complete list of the members of the CLEVER-DM Study is provided in online supplementary information 2. The authors also thank Keiko Kosaka, Eriko Naiki, Chikako Ikeuchi, Takako Fujii, Noriko Yamamoto, Kaori Nagano, Mayumi Yotsushika, Mai Nakaizumi, Akiko Sakata, and Hiroko Kogure for their expert technical assistance. Finally, the authors thank Angela Morben, DVM, ELS, from Edanz Group (www.edanzediting.com/ac), for editing the English text of a draft of this manuscript.
Contributors KM and KK contributed to the planning and conduct of the study, and drafted and revised the manuscript. ST contributed to the planning of the study and revised the manuscript. AO, KN, MK, KF, and IM contributed to the conduct of the study. YN, SN, YY, SU, MS, FK, HM, and NE contributed to the planning of the study and revised the manuscript. NE and SS contributed to the planning of the study. All authors read and approved the final manuscript.
Funding This study was funded by AMED under Grant Numbers JP17ek0210045 and JP18ek0210112. This study was also supported in part by the Japan Foundation for Applied Enzymology (to KK).
Competing interests ST received consigned research funds from Omron Healthcare. The remaining authors declare no competing interests.
Patient consent for publication Not required.
Ethics approval The study was performed in accordance with the principles contained within the Declaration of Helsinki. The protocol was approved by the ethics committee of Keio University (Protocol No 2015–03), National Institutes of Biomedical Innovation, Health and Nutrition (Protocol No 29), and Shiga University of Medical Science (Protocol No 28–062).
Provenance and peer review Not commissioned; externally peer reviewed.
Data sharing statement Data are available upon reasonable request.