Article Text

Abstract
Background: The extent to which chronic exposure to outdoor air pollutants influences lung function in adults is unclear. The aim of this study was to measure the association between chronic exposure to outdoor air pollutants and adult lung function.
Methods: The relationship between measures of lung function (forced expiratory volume in 1 s (FEV1) and FEV1 as a percentage of forced vital capacity (FVC)) and average exposure to particulate matter <10 μm in diameter, nitrogen dioxide, sulfur dioxide and ozone was examined in four representative cross-sectional surveys of the English population aged ⩾16 in 1995, 1996, 1997 and 2001. Year-specific estimates were pooled using fixed effects meta-analysis.
Results: Greater exposure to particulate matter <10 μm in diameter, nitrogen dioxide and sulfur dioxide was associated with lower adult FEV1. The size of the effect on population mean FEV1 was about 3% for particulate matter <10 μm, and 0.7% for nitrogen dioxide and sulfur dioxide, for a 10 μg/m3 increase in pollutant concentration. The effects were most marked in men, older adults and ex-smokers. FEV1 was not associated with ozone concentration. No associations were found between the pollutants and FEV1 as a percentage of FVC.
Conclusions: Chronic exposure to outdoor air pollution is associated with modestly reduced FEV1 in adults.
Statistics from Altmetric.com
The extent to which long-term exposure to outdoor air pollution accelerates adult decline in lung function, increasing risk of chronic respiratory disease and dying of cardiovascular disease, is unclear.1 2 Cohort studies suggest that outdoor air pollution increases the rate of adult lung function decline, but they examined few geographical areas, so there may have been residual confounding.3–6
Cross-sectional studies have supported the idea that chronic exposure to air pollution reduces adult lung function, but the size of the effect and which pollutants are responsible remains unclear. A study in Switzerland found lower forced vital capacity (FVC) and forced expiratory volume in 1 s (FEV1) in non-smokers exposed to higher levels of air pollution.7 A national US study found lower FVC in areas with higher total suspended particles.8 In California, non-smoking men (but not women) with a family history of respiratory disease exposed to higher particulate matter <10 μm in diameter (PM10) had a lower FEV1.9 Women in their fifties in the German Rhine–Ruhr basin had a lower FEV1 in areas with higher PM10 and nitrogen dioxide (NO2).10
We aimed to study the association between chronic exposure to outdoor air pollution and lung function. We examined whether average exposure to outdoor air pollutant levels of PM10, NO2, sulfur dioxide (SO2) and ozone (O3) was related to lung function in several cross-sectional studies of English adults.
METHODS
Participants and outcome measures
The Health Survey for England is a programme of annual surveys designed to generate large samples representative of the English population. We used data from 1995, 1996, 1997 and 2001, years in which lung function was measured in adults.
In each survey year, adults were recruited using a multistage sampling strategy.11 12 Briefly, the sampling units were single postcode sectors, except where the population was sparse, where they consisted of two or more neighbouring sectors. For each year, 720 sampling units (648 in 1997) were selected with probabilities proportional to the number of addresses within them. From each sampling unit, addresses were drawn: 18 in 1995 and 1996; 11 in 1997; and 19 in 2001 (fewer for adults in 1997 because the survey was designed to undersample adults and oversample children). All adults (up to a maximum of 10) living in each household at those addresses were invited to complete a questionnaire and offered a nurse visit to have lung function measured, unless pregnant, had had recent major surgery or had been recently admitted to hospital with a heart complaint or stroke.
Lung function measurements were taken using Vitalograph Escort Spirometers. Participants stood, unless chairbound. We used the highest of five attempts to perform FEV1, as long as the participant completed one or more satisfactory blows, defined as (1) good timing of start of expiration; (2) no laughing or coughing; (3) no breath-holding; (4) no leak; and (5) no obstruction.
We analysed data only on participants who reported that they belonged to white ethnic groups, because the numbers in other ethnic groups were small and ethnically heterogeneous.
Exposure
We have described methods for assigning exposure in our previous publication.13 Briefly, the National Centre for Social Research provided postcode sector of residence for all households in the Health Survey. We assumed that annual average pollutant exposure for people living in each postcode sector was that of the 1 km2 containing its centroid. We estimated annual average background exposure to PM10, NO2, SO2 and O3 for each 1 km2 of England using air dispersion models employing meteorological parameters and an emission inventory.14 We averaged the exposure estimate for each participant for each pollutant for the data collection year and the previous year.
Statistical analysis
Measures of pollutant exposure were at postcode sector level, and up to six adults living in each household had data on lung function. Therefore, we used multilevel linear regression analyses to allow for this hierarchical data structure. We carried out regression analyses for each pollutant singly for each year, controlling initially for age (in 10-year groups); sex; height; and all two-way interactions between these variables as fixed effects, because associations of FEV1 with age and height differed between men and women. We additionally adjusted for, as fixed effects: social class of head of household; smoking status (never-smoker; ex-smoker (in pack-years); current smoker (in pack-years)); passive smoking in non-smokers (dichotomous variable based on a question about tobacco smoke exposure in the home); region (eight postal regions of roughly equal size by population); and month of nurse visit. Individuals with missing values on categorical covariates were included in the analyses as a separate group. Similar analyses were performed with FEV1/FVC as the outcome without adjusting for height but including the interaction between age and sex followed by the same additional adjustments as for FEV1. We pooled survey year-specific estimates using fixed effects meta-analysis for each air pollutant with inverse variance weighting.
We examined the associations with FEV1 by sex, age group, smoking status and excluding people who reported having bronchitis, emphysema or asthma. We carried out all analyses using STATA version 10 (STATA Corporation, Austin, Texas, USA).
Ethical approval
The National Centre for Social Research obtained ethical approval from all relevant Research Ethics Committees. Participants provided consent to take part in the surveys. We obtained approval to link air pollution and Health Survey for England data by postcode sector from the National Centre for Social Research, having undertaken additional procedures to protect participants’ identities.
RESULTS
In 1995, 1996, 1997 and 2001, 56 727 of 61 799 (92%) adults aged ⩾16 living in 32 712 households who participated in the Health Survey for England (77% of eligible households) completed a health questionnaire; 53 161 belonged to white ethnic groups. Table 1 shows responses to the questionnaire and lung function measures. Overall, we had lung function results for 42 975 white adults (81% of those who had completed a questionnaire and were, therefore, eligible for a nurse visit). Of these, we had air pollution exposure data for 94% in 1995, 95% in 1996 and 1997, and 99% in 2001. Table 2 shows the characteristics of white adults with and without lung function results. People with lung function results were more likely to be male, aged under 75, of non-manual social class and have slightly lower exposure to PM10, NO2 and SO2, and slightly higher exposure to O3 than those without.
Descriptive statistics
Table 3 shows summary lung function statistics for white adults. Table 4 shows correlations between pollutant concentrations for each of the survey years. PM10 and NO2 concentrations were highly correlated.
Associations between pollutants and FEV1
Figure 1 shows the associations between each pollutant and FEV1 adjusted for age, sex and height, and their two-way interactions combined, using fixed effects meta-analysis over the four survey years (Model A), and additionally adjusted for active smoking, passive smoking, social class, region and season, for each survey year and combined using fixed effects meta-analysis (Model B).

Associations between pollutant exposure and adult forced expiratory volume in 1 s (FEV1). The diamonds labelled Model A represent the means and 95% CI for the association between FEV1 and pollutants adjusted for age, sex, height and all their two-way interactions for all years (1995–1997, 2001) combined (fixed effects). Model B estimates show the means and 95% CI for the association between FEV1 and pollutants for each year separately and combined (1995–7, 2001) in a fixed effects meta-analysis, after adjusting in addition for pack-years of active smoking, passive smoking (in non-smokers), social class, region and season. Weights are calculated from fixed effects meta-analysis. I2 is a test of heterogeneity of the result for the different survey years. PM10, particulate matter <10 μm in diameter.
Particulate matter <10 μm in diameter
Combining the results of all the years’ analyses showed that a 10 μg/m3 difference in PM10 across postcode sectors was associated with a lower FEV1 by 111 ml (Model A). In the fully adjusted model, Model B, the combined estimate was reduced to 92 ml (3% of the population mean FEV1), and was larger in men (−120 ml, 95% CI −176 to −65 ml) than in women (−65 ml, 95% CI −103 to −26 ml). After excluding people reporting bronchitis, emphysema or asthma, the combined adjusted estimate was −81 ml, 95% CI −118 to −44 ml.
Nitrogen dioxide
Combining the results of all the years’ analyses showed that a 10 μg/m3 difference in NO2 across postcode sectors was associated with a lower FEV1 by 32 ml (Model A). In the fully adjusted model, Model B, the combined estimate was reduced to 22 ml (0.7% of the population mean FEV1) and was larger in men (−30 ml, 95% CI −42 to −17 ml) than in women (−16 ml, 95% CI −24 to −7 ml). After excluding people reporting bronchitis, emphysema or asthma, the combined adjusted estimate was −20 ml, 95% CI −28 to −12 ml.
Sulfur dioxide
Combining the results of all the years’ analyses showed that a 10 μg/m3 difference in SO2 across postcode sectors was associated with a lower FEV1 by 54 ml (Model A). In the fully adjusted model, Model B, the combined estimate was reduced to 22 ml (0.7% of the population mean FEV1), and was larger in men (−33 ml, 95% CI −55 to −12 ml) than in women (−12 ml, 95% CI −27 to 3 ml). After excluding people reporting bronchitis, emphysema or asthma, the combined adjusted estimate was −18 ml, 95% CI −33 to −4 ml.
Ozone
In contrast to the results for PM10, NO2 and SO2, combining the results of all the survey years showed that a 10 μg/m3 difference in O3 was associated with a higher FEV1 by 22 ml, after controlling for age, sex and height and their interactions (Model A). After further adjustment for pack-years of active smoking, passive smoking, social class, region and season (Model B), the effect was reduced to 4 ml. There was evidence of heterogeneity between the survey years; random effects analysis gave a combined fully adjusted effect size of 10 ml, 95% CI −42 to 61 ml. Effects in men and women were very similar (data not shown). We repeated the analysis also adjusting for NO2 concentration; the size of the association was unchanged.
Effects in different age groups
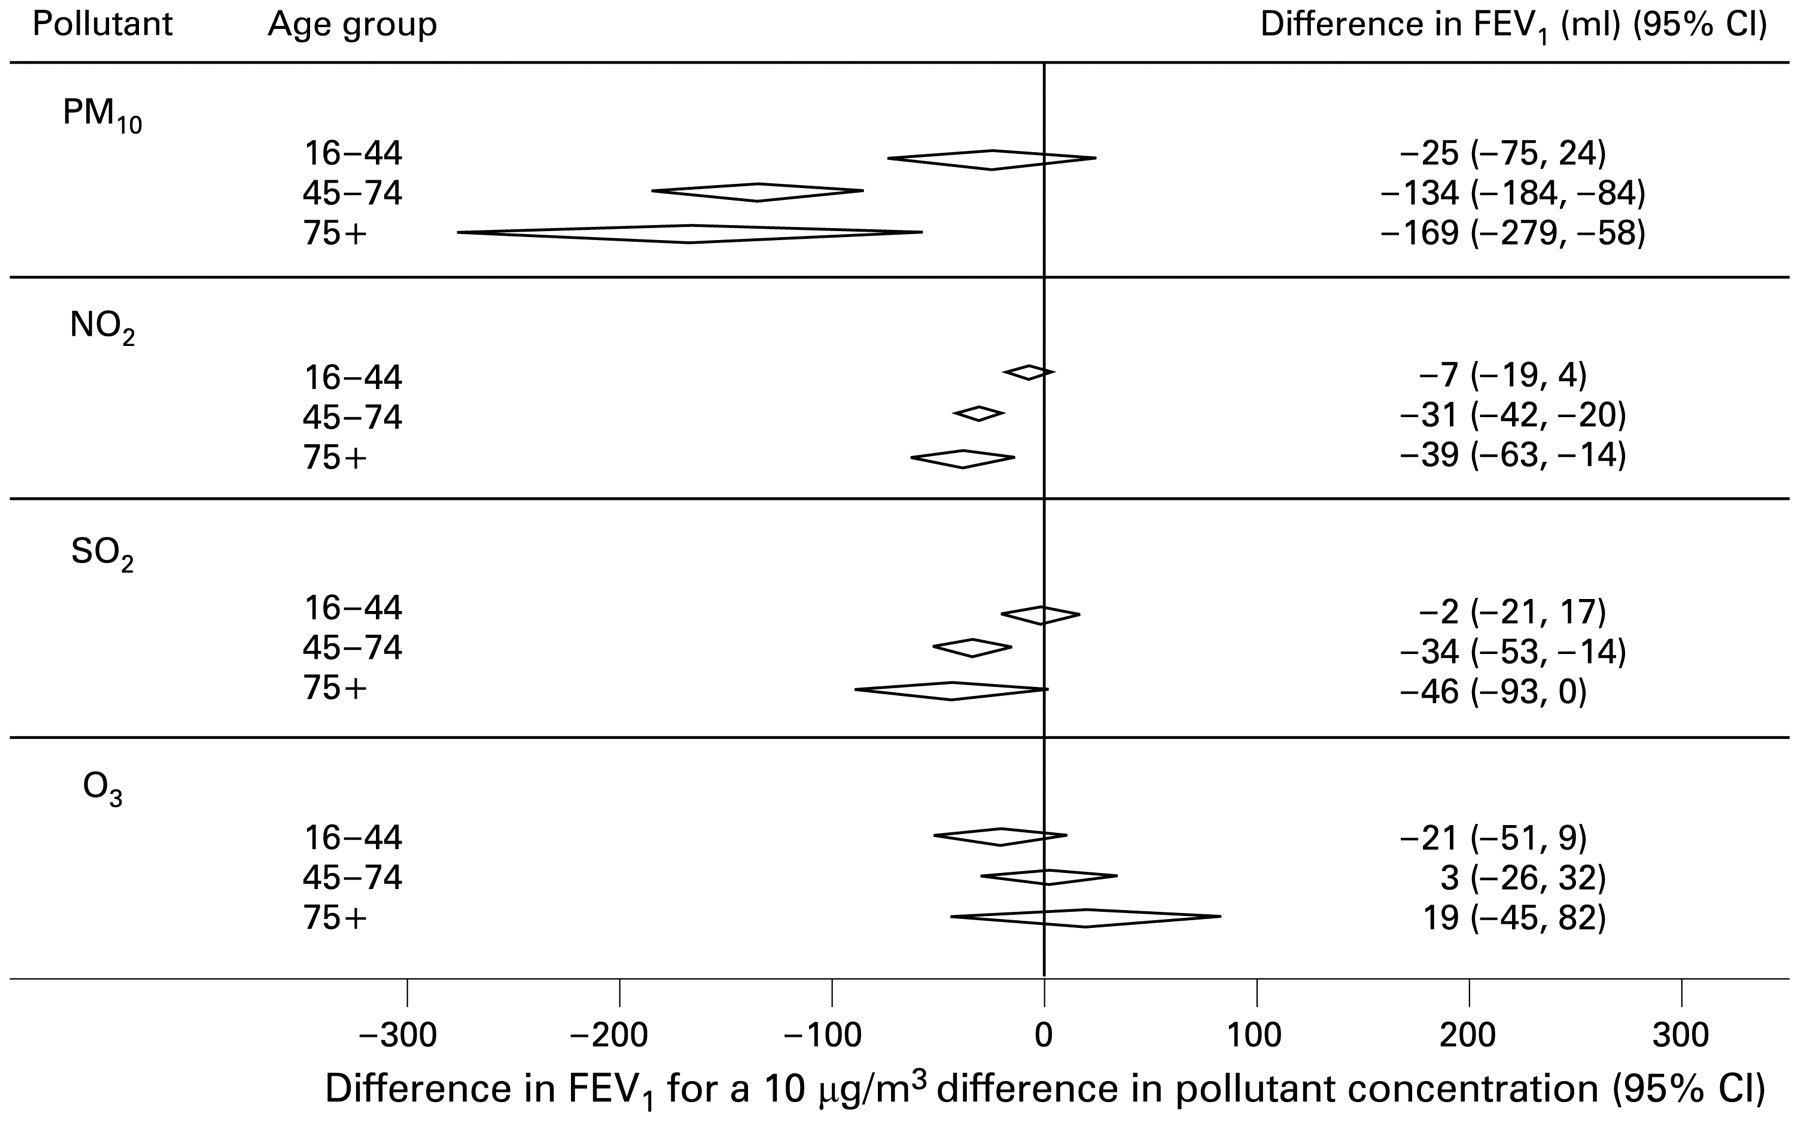
Figure 2 shows the results of adjusted analyses stratified by age group combined for all survey years, adjusted for Model B variables. The associations for PM10, NO2 and SO2 increased with age. In the over-75 age group, a 10 μg/m3 difference in PM10 was associated with a 169 ml lower FEV1; NO2 with a 39 ml lower FEV1; and SO2 with a 46 ml lower FEV1. For O3, the associations showed the opposite pattern, but all the 95% CIs were compatible with no effect.

Associations between pollutant exposure and adult forced expiratory volume in 1 s (FEV1) stratified by age group. The diamonds represent means and 95% CI for the association between FEV1 and pollutants combined for all the survey years (1995–1997, 2001), after adjusting for age, sex, height and all their two-way interactions, and additionally for pack-years of active smoking, passive smoking (in non-smokers), social class, region and season. Weights are calculated from fixed effects meta-analysis. PM10, particulate matter <10 μm in diameter.
Effects by smoking status
Figure 3 shows the results of adjusted analyses stratified by smoking status combined for all the survey years. All estimates were adjusted for Model B variables. The association of FEV1 with PM10, NO2 and SO2 was greatest in ex-smokers and was smaller and similar in current and never-smokers. To assess whether this had occurred because ex-smokers were over-represented among people with chronic obstructive airways disease, we repeated this analysis excluding people who reported bronchitis, emphysema or asthma; the results were very similar. We also examined whether the finding was due to differential reporting of the number of cigarettes smoked or duration of smoking by current and ex-smokers by examining the association without controlling for pack-years of smoking, and the results were very similar. For O3, the associations showed the opposite pattern, but all 95% CIs were compatible with no association.

Associations between pollutant exposure and adult forced expiratory volume in 1 s (FEV1) stratified by smoking status. The diamonds represent means and 95% CI for the association between FEV1 and pollutants combined for all the survey years (1995–1997, 2001), after adjusting for age, sex, height and all their two-way interactions, and additionally for pack-years of active smoking, passive smoking (in non-smokers), social class, region and season. Weights are calculated from fixed effects meta-analysis. PM10, particulate matter <10 μm in diameter.
Associations between pollutants and FEV1/FVC
Figure 4 shows the associations between each pollutant and FEV1/FVC, adjusted for age, sex and their interaction, combining the four survey years (Model C), and additionally adjusted for pack-years, passive smoking, social class, region and month of nurse visit, for each year and combined (Model D). The combined effect sizes were all <0.2% per 10 μg/m3 difference in pollutant level and all 95% CIs were compatible with no association.

Associations between pollutant exposure and adult forced expiratory volume in 1 s (FEV1)/forced vital capacity (FVC). The diamonds labelled Model C represent the means and 95% CI for the association between FEV1/FVC and pollutants adjusted for age, sex and their two-way interactions, for all survey years (1995–1997, 2001) combined. Weights are calculated from fixed effects analysis. Model D estimates show the means and 95% CI for the association between FEV1/FVC and pollutants for each year separately and combined (1995–1997, 2001), after adjusting in addition for pack-years of active smoking, passive smoking (in non-smokers), social class, region and season. Weights are calculated from fixed effects meta-analysis. I2 is a test of heterogeneity of the result for the different survey years. PM10, particulate matter <10 μm in diameter.
DISCUSSION
We found that adult FEV1 was associated with average outdoor concentrations of PM10, NO2 and SO2 estimated for postcode sector of residence. The size of the effect on population mean FEV1, expressed for an increase in pollutant level of 10 μg/m3, was about 3% for PM10, and 0.7% for NO2 and SO2. The associations were strongest in men, older adults and in ex-smokers, and were independent of active and passive smoking, social class, region and month of testing. FEV1 was not associated with O3 concentrations. We found no associations between the pollutants and FEV1/FVC.
We have presented our findings per 10 μg/m3 increase in pollutant level. However, the interpretation depends on the variability of pollutant across England. Given an interquartile range (IQR) of PM10 concentration of 3 μg/m3, an increase in PM10 of one IQR would be associated with a FEV1 lower by 28 ml. Given an IQR of NO2 concentration of 14 μg/m3, an increase in NO2 of one IQR would be associated with a FEV1 lower by 31 ml. Given an IQR of SO2 concentration of 5 μg/m3, an increase in SO2 of one IQR would be associated with a FEV1 lower by 11 ml.
Our findings are compatible with other cross-sectional studies examining the effect of air pollution on adult lung function. The SAPALDIA (Study on Air Pollution and Lung Diseases in Adults) study of adults living in eight areas of Switzerland found that a 10 μg/m3 increase in annual mean PM10 was associated with a 2% reduction in FEV1, a 1% reduction in SO2 and a 1% reduction in NO2 in healthy never-smokers.7 However, in contrast to our findings, the researchers found larger effects for the association between FVC and PM10 or SO2: around a 3% reduction for a 10 μg/m3 increase, although <1% per 10 μg/m3 increase in NO2. A cross-sectional study in women in Germany found a 5% reduction in FEV1 and 1% reduction in FEV1/FVC for a 7 μg/m3 increase in annual mean PM10, and a 4% reduction in FEV1 and 1% reduction in FEV1/FVC for a 16 μg/m3 increase in annual mean NO2.10
Strengths of our study were that it was large, with a high level of participation, and allowed us to examine effects over a wide range of exposures and to incorporate individual data on potential confounders. The multilevel models allowed for the possibility that lung function in people living in one postcode sector or one household may be more similar to each other than people living elsewhere because they share other risk factors.
All methods of estimating individual exposure to air pollutants will misclassify exposure to a degree. Most commonly, researchers have used single monitoring station data to assign exposure to all individuals over large areas,15 which are likely to reflect individual exposure poorly. Other researchers have used population density16 or estimated traffic exposure17 to reduce exposure misclassification. Our method of estimating individual exposure to outdoor air pollutants is likely to mark an improvement on these measures, because we estimated exposure for small areas using emission inventories combined with air dispersion models taking into account meteorological information.14 The emission inventories were constructed using information on many influences on air pollution levels (including population density, emissions from roads from traffic activity data (daily flows for different vehicle types on each major road link), vehicle fleet characteristics (age, relevant emission standard) and emission factors (emissions per km per vehicle), railways, airports, industry and domestic heating).18 While data on elements of the model for some of the km2 in the grid were missing, cross-validation with monitoring station data showed high correlations (see Supplementary Appendix online); in addition, an independent comparison of the maps for PM10 and NO2 with monitoring data collected by local authorities showed good agreement.19 Generally, modelled NO2 and O3 show better agreement with monitoring station data than PM10 and SO2.
We estimated exposure for each individual from pollutant concentrations for the 1 km2 closest to the centroid of the postcode sector of residence. It may be argued that postcode sectors are too large for this to reflect individual exposure accurately. However, our previous analyses have suggested that >97% of the variance in annual mean PM10, NO2, SO2 and summer mean O3 estimates is between postcode sectors, and <3% of the variance is within postcode sectors (data in Supplementary Appendix online). Moreover, most people with high levels of exposure to traffic-related pollutants live in urban and semi-urban areas, where postcode sectors have a relatively small area.
For people living very close to main roads, proximity to the road may be a better determinant of exposure than modelled levels. However, our study aimed not to examine the effect of living close to a main road on lung function, but instead the effect of air pollution on average population levels of lung function; people living close to main roads make up only a small proportion of the population.
Our findings assume that people do not spend significant periods of time in other postcode sectors with different patterns of exposure, for example at work. Our access to data on occupation was restricted to the Registrar-General’s classification of occupations as part of the measures to protect the participants’ identity. It is possible that people living in more polluted areas have greater exposure to pollutants affecting lung function at work, exaggerating the size of our estimates. Greater occupational exposure may partly explain the larger effects we observed in men.
To conclude that chronic exposure to outdoor air pollution reduces lung function requires us to assume that participants had been living at their address for a long enough period of time to influence lung function. We did not have data on how long people had been living at their home, so we cannot be sure that our findings are not due to selective migration of people with better lung function into less polluted areas, and people with worse lung function to more polluted areas. However, we controlled for the major known determinants of adult lung function (age, sex, height, tobacco smoke exposure and social class) which makes this less likely. We were, however, unable to control for another determinant of lung function: maximum lung function achieved during lung growth. FEV1 and FVC increase throughout childhood and fall progressively from a maximum in the third decade of life.20 The deleterious effect of pollutants could occur at the time of lung growth21; if this is the case, our findings could be explained by the most heavily exposed individuals reaching lower maximum lung function in the third decade. We were unable to address this question in our study. However, a recent report of a cohort study as part of the SAPALDIA study found that areas with greater falls in PM10 concentrations had reduced age-related decline in lung function,22 implying that at least some of the effect of air pollution on adult lung function is likely to occur during adulthood.
We found that ex-smokers had the strongest association between FEV1 and pollutant levels, which we are unable to explain. It was unlikely to be due to people with lung disease giving up smoking, although it is possible that ex-smokers retain a propensity to the effects of inhaled irritants that falls short of clinical chronic obstructive pulmonary disease. We found that it was unlikely to be due to differential reporting of quantity and duration of smoking by current and ex-smokers.
The associations between FEV1 and PM10, NO2 and SO2 were greater in older people. This may be a cohort effect; in other words, that older people living in more heavily polluted areas have worse lung function as a result of higher air pollution exposure in the past. Levels of SO2 and particulate matter in the UK have fallen dramatically over the last 50 years.23 Another explanation is that elderly people are more susceptible to air pollution effects on the lung.
The most important pollutants in the UK now are those generated by road traffic: fine particulates and NO2, and O3, a secondary pollutant. It is important to note, however, that the pollutants we examined may simply be markers for other, more toxic, agents. We did not attempt to distinguish the effects of NO2 and PM10 because they were so highly correlated (as we would expect as the most important source of both is traffic). We attempted to establish whether the absence of effect of O3 was due to the effect of the competing exposure to NO2, but found no evidence for this.
Modelling of the SAPALDIA data suggested that a 3% shift in population mean FVC associated with a 10 μg/m3 increase in PM10 concentration could lead to a 47% increase in prevalence of FVC ⩽80% predicted.24 Our findings suggest that PM10, NO2 and SO2 exposure may be associated with reduced FEV1 in adults. The magnitude of the effect may not be important for an individual, but our results imply that a 10 μg/m3 increase in PM10 concentration (an order of magnitude similar to the difference in exposure between the most and the least polluted parts of the UK) could cause an average 3% shift downwards in the distribution of FEV1. This could cause significant changes in the prevalence of low FEV1 and, therefore, of associated symptoms, prognosis and health service utilisation.
REFERENCES
Supplementary materials
Web only appendix 26:8;657
Files in this Data Supplement:
Footnotes
Competing interests: None.
Funding: Department of Health, UK.
▸ An Appendix is published online only at http://thorax.bmj.com/content/vol64/issue8
See Editorial, p 645
Ethics approval: Ethical approval was obtained from all relevant Research Ethics Committees.
Linked Articles
- Airwaves
- Editorial