Article Text

Abstract
The Association for Respiratory Technology & Physiology (ARTP) last produced a statement on the performance of lung function testing in 1994. At that time the focus was on a practical statement for people working in lung function laboratories. Since that time there have been many technological advances and alterations to best practice in the measurement and interpretation of lung function assessments. In light of these advances an update was warranted. ARTP, therefore, have provided within this document, where available, the most up-to-date and evidence-based recommendations for the most common lung function assessments performed in laboratories across the UK. These recommendations set out the requirements and considerations that need to be made in terms of environmental and patient factors that may influence both the performance and interpretation of lung function tests. They also incorporate procedures to ensure quality assured diagnostic investigations that include those associated with equipment, the healthcare professional conducting the assessments and the results achieved by the subject. Each section aims to outline the common parameters provided for each investigation, a brief principle behind the measurements (where applicable), and suggested acceptability and reproducibility criteria.
- lung physiology
- respiratory measurement
- respiratory muscles
This is an open access article distributed in accordance with the Creative Commons Attribution Non Commercial (CC BY-NC 4.0) license, which permits others to distribute, remix, adapt, build upon this work non-commercially, and license their derivative works on different terms, provided the original work is properly cited, appropriate credit is given, any changes made indicated, and the use is non-commercial. See: http://creativecommons.org/licenses/by-nc/4.0/.
Statistics from Altmetric.com
Foreword
The Association for Respiratory Technology & Physiology (ARTP) was at the forefront of producing useable and readable guidelines on how to undertake lung function testing.1 The emphasis then was on a practical statement that would be a helpful reference for people working in lung function testing. The ARTP have now produced this revised and expanded statement on lung function testing with the emphasis still being that it can be used in lung function laboratories as a means to improve the quality and reliability of the results achieved by patients.
ARTP have provided within this document, where available, the most up-to-date and evidence-based recommendations for the most common lung function assessments performed in laboratories across the UK. These recommendations set out the requirements and considerations that need to be made in terms of environmental and patient factors that may influence both the performance and interpretation of lung function tests. They also incorporate procedures to ensure quality assured diagnostic investigations that include those associated with equipment, the healthcare professional conducting the assessments and the results achieved by the subject. Each section aims to outline the common parameters provided for each investigation, a brief principle behind the measurements (where applicable), and suggested acceptability and reproducibility criteria.
It has been over 10 years since the comprehensive series of joint American Thoracic Society/European Respiratory Society (ATS/ERS) statements on lung function testing.2–5 One of the problems arising from those has been the view that patients either pass or fail the criteria set down in those statements. This was not the intention of the group who prepared those statements. Aspects of this have been addressed in the 2019 update of the spirometry statement.6 Also an updated standard for single-breath carbon monoxide (CO) uptake transfer factor was published in 20177 which, in particular, incorporated changes in gas analyser technology.
We have been clear that the reason for setting out the ARTP view on lung function testing is to help ensure that each individual patient has the greatest chance of achieving their best result on the day of their tests. In no sense should a patient ever pass or fail the test session.
The statements in these guidelines about criteria that should be satisfied when undertaking lung function testing outline goals and drivers that lead to ensuring a patient achieves the best results possible on the day of their test. If a patient does not meet all these criteria, it does not invalidate any of the results obtained. It may just mean that those results may not be a reliable indicator of what the patient might be able to achieve. However, the results produced may still provide sufficient information to support any clinical decision-making with the proviso that a repeat test at another test session might yield a different result.
We hope this document proves to be accessible and sufficiently comprehensive that it will assist pulmonary function laboratories in delivering the best outcomes for their patients.
Dr Karl Sylvester, Past Chair, ARTP 2020
Key messages
This statement outlines the latest best practice guidance for the performance of the most common lung function assessments in a respiratory physiology department
Reccomendations are provided on how to undertake these assessments safely, to quality assured standards and utilising the most suitable reference values available for the interpretation of results
General procedures
The subject should be correctly prepared for the tests and various subject details recorded.
The subject’s age is recorded (to one decimal place), height to the nearest 0.5 cm and weight to the nearest 0.5 kg (wearing indoor clothes without shoes).
Standing height is a key measurement as it is commonly used to estimate predictive values for the majority of indices used in evaluating the pulmonary function of both children and adults.
Standing height: This should be measured without shoes, with the feet together, heels, scapulae and buttocks against the stadiometer/wall, standing as tall as possible with the eye level looking straight ahead (Frankfurt plane) using an accurate measuring device.5 Because height increases with increasing age during childhood and decreases with increasing age in adulthood, particularly in older subjects, height should ideally be measured on every occasion when measurements of lung function are being made to ensure that accurate diagnosis and classification of disease severity are maintained.8–11
However, standing height measurements may not be reliable in patients with thoracic skeletal deformities, the elderly or in patients who have certain syndromes, such as achondroplasia12 and osteogenesis imperfecta.13 These individuals typically have a lower standing height than expected, which may result in an overestimation of their pulmonary function status, and consequently may affect decisions about their treatment.
Arm span: For patients with a deformity of the thoracic cage, such as a kyphoscoliosis, the arm span can be measured. This is the distance between the tips of the middle fingers of maximally extended horizontal arms—fingertip to fingertip—while standing in stockinged feet against a wall. Traditionally, this has been calculated as the arm span/1.03 for males and arm span/1.01 in females. However, it has recently been observed that differences between arm span and standing height are related to ethnicity, sex and age.14 The calculations are complex, but a program that estimates standing height from arm span, age and ethnicity can be downloaded from the spirXpert website (https://spirxpert.ers-education.org/en/download/armspan-to-height-software/).
Some patients may not be able to extend their arms, so alternatives are needed.
Demi-span: This is measured with the subject standing upright with their back straight, arms extended sideward at 90° to the torso, fingers stretched, and the arm rested against a wall to avoid forward or backward bending. Arm span is twice the measured demi-span.
Ulnar length: This has been reported as an alternative. Ulna length can be obtained in sitting position with the left forearm resting comfortably on a table. The palm faces downwards, and the fingers are extended together. The elbow should be bent at 90°–110°. The proximal end of the ulna is located by palpating along its length. The tip of the styloid process is felt at the wrist by palpating down the length of the bone distally until its end is felt. Generally, a set of callipers is used to obtain an accurate measure. As with demi-span and arm span, there is a choice of equations, some of which contain age and ethnicity as important factors.15 Which equation is used should be stated on the report form.
Knee height: This is generally used in nutrition studies in the elderly,16 17 where standing height may be difficult to obtain easily.18 Knee height is the distance between the lower edge of the heel and the upper part of the knee (just above the kneecap) measured with the subject in sitting position, legs hanging over the edge of the chair, and knees and hips bent at 90°. The tape measure is placed along the outside of the leg, parallel to the major axis of the tibia.
The gender of a subject is the way they portray themselves within society and may differ from their birth sex. For the purposes of assessing lung function, it is the subject’s birth sex (more correctly, the biological sex through puberty) that determines the size of their lungs. Birth sex should therefore be used in the context of prediction of lung function and not gender. Failure to address this correctly may mean a transgender patient will be incorrectly assessed/diagnosed.19
The operator should record the type and dosage of any relevant medication that could influence the outcome of investigations, inclusive of inhaled, oral or intravenous respiratory medication and when the drugs were last administered.
Ideally the subject should be asked to do the following20:
Avoid smoking on the day of the test.7
Not consume alcohol for at least 4 hours prior to the test.
Avoid vigorous exercise for at least 30 min prior to the test.
Avoid wearing clothing which substantially restricts full chest and abdominal expansion.
Refrain from eating a substantial meal for at least 2 hours prior to the test.
These requests should be made at the time of making the appointment. On arrival all the points should be checked and any deviations from them recorded.
At the start of the tests the ambient temperature and barometric pressure (PBOX) should be recorded to enable all volume measurements to be adjusted and reported at body temperature and pressure saturated (BTPS).
Withholding bronchodilators
Subjects should arrive for investigations on their usual medication unless being assessed for bronchodilator responsiveness or bronchial provocation testing when the subject should be asked to withhold some of their inhaled medication, as outlined in table 1.
Recommended washout intervals prior to methacholine challenge test
When considering the period of time for a medication to be inactive in the airways, it must be borne in mind that there will be no single point duration of activity that applies to every individual due to many confounding factors, which include the number of available receptors in the airways, the size of the individual, the mechanism, route and efficiency of delivery of previous doses of the drug. Pharmacokinetic studies in patients suggest that, for example, in salbutamol, 4–6 hours is the time required for lung function to return to predrug administration. Currently the generally accepted withhold times are those recommended in the ATS/ERS 2005 guidelines4 of 4 hours for short-acting beta-agonists and 12 hours for long-acting beta-agonists; however, many new compounds have been introduced recently.
By studying airway smooth muscle contraction using methacholine challenge testing, Davis et al21 showed the relative duration of bronchoprotection for a variety of commonly used respiratory medications. This gives some guide for the appropriate withhold times to establish clearance of these medications prior to testing when a baseline test (ie, without the support of medication) is required.
When asking patients to withhold medication, careful consideration should always be made regarding withholding any medication, and this should remain the responsibility of the healthcare professional requesting an assessment following administration of any medication.
There will be instances where this is clinically inappropriate or unsafe and treatment withdrawal will need to be agreed by the referring clinician. Local protocols should address this.
Indications for lung function testing
There is no specific evidence to absolutely contraindicate the performance of lung function. There are occasions when optimum results will not be obtained due to pre-existing conditions and this should be stated on the patient’s report, since the possible consequences of producing suboptimal results for a patient, for example, refusal for surgery based on apparently low lung function, should be based on poor physiology and not down to impaired effort.
Each case will have its individual risk versus benefit to the performance of lung function, and therefore a discussion should take place among relevant healthcare professionals to determine the most appropriate and safe way to proceed (table 2).
Indications for testing Adapted from Cotes
Contraindications for lung function testing
The majority of contraindications for pulmonary function testing are relative and depend on balancing the risk of any possible complications with the clinical need for the result. The general list of conditions held to necessitate caution is generally accepted to be the following:
Haemoptysis of unknown origin (forced expiratory manoeuvre may aggravate the underlying condition).
Pneumothorax.
Unstable cardiovascular status (forced expiratory manoeuvre may worsen angina or cause changes in blood pressure) or ‘recent’ myocardial infarction or pulmonary embolus.
Thoracic, abdominal or cerebral aneurysms (danger of rupture due to variation in thoracic pressure).
‘Recent’ eye surgery (eg, cataract).
Presence of an acute illness or symptom that might interfere with test performance (eg, nausea, vomiting).
Recent thoracic or abdominal surgery.
This list was mostly based on expert opinion22; however, an update to these contraindications23 examined each of these in closer detail and advocates that some of the conditions that it had previously been suggested needed a 6-week recovery period prior to testing could be safe after less than 3 weeks.
Consent
Consent is the principle that a person must give permission before they receive any type of medical treatment, test or examination. Consent is an essential component of both medical ethics and human rights law.
Consent is only valid if it is voluntary and informed. Importantly the person giving consent must have the capacity to make the decision. The following are the three keywords in the previous sentence:
Voluntary: the decision to either consent or not to consent must be made by the person themselves and must not be influenced by pressure from clinical staff, friends or family.
Informed: the person must be given all of the information in terms of what is involved, including the benefits and risks, and what happens if the test/treatment does not proceed.
Capacity: the person must be capable of giving consent, which means they understand the information given to them, and they can use it to make an informed decision.
If an adult has the capacity to make a voluntary and informed decision to consent to or refuse a particular test or treatment, their decision must be respected.
Consent can be given through the following:
Verbally: for example, by saying they are happy to have a test.
In writing: for example, by signing a consent form for a complex test that may carry increased risks.
Someone could also give non-verbal consent, as long as they understand the treatment or examination about to take place, for example, holding out an arm for a blood test.
Consent should be given to the healthcare professional directly responsible for the person’s current tests or treatment. If the subject changes their mind at any point before the test commences, or even during the test, such as a cardiopulmonary exercise test, the test must be stopped.
People aged 16 or over are entitled to consent to their own treatment, and this can only be over-ruled in exceptional circumstances. Like adults, young people (aged 16 or 17) are presumed to have sufficient capacity to decide, unless there is significant reason indicating to the contrary.
Children under the age of 16 can consent if they are believed to have enough intelligence, competence and understanding to fully appreciate what is involved in their treatment. This is known as being ‘Gillick competent’. If the child is not Gillick competent then someone with ‘parental responsibility’ can consent for them. This could be the following:
The child’s mother or father.
The child’s legally appointed guardian.
A person with a residence order concerning the child.
A local authority designated to care for the child.
A local authority or person with an emergency protection order for the child.
The person with parental responsibility must have the capacity to give consent.
Preparation
Subjects should be as relaxed as possible before and during the tests and should be seated for 5–10 min prior to testing.
For reasons of safety the patient should not stand during any investigations but should sit upright in a chair with arms with the equipment at the appropriate height, angle and distance.
Subjects should be asked to loosen tight-fitting clothing. Dentures should normally be left in place; if they are loose they may interfere with performance and are then best removed.
The purpose and nature of the test should be clearly and fully explained to the subject. The subject should be sitting comfortably with both feet flat on the floor and in an upright posture. The mouthpiece assembly should be adjusted to an appropriate height so that the chin is at 90° horizontal to the chest, thereby ensuring a straight upper airway. The tests are usually performed wearing tight-fitting noseclips to avoid unnecessary leaks.
When patients return for repeat testing, then ideally the time of day, the equipment and the operator should be the same.
Order of testing
There is no evidence for a usual order for performing lung function tests. However, healthcare professionals should be mindful of the influence manoeuvres may have on subsequent investigations.
For example:
Performance of nitrogen washout prior to gas transfer.
Potential for dynamic airway obstruction on repeat dynamic manoeuvres.
The timing of bronchodilator administration for reversibility assessment.
Undertaking gas transfer (CO) test after bronchodilator administration.
There should be appropriate delays between tests as indicated in the subsequent sections in this document. Department protocols will dictate the usual order of testing, although the clinical drivers for undertaking the investigations may help determine the most appropriate approach to the tests and their order.
Infection control
Infection control presents a number of issues within a testing laboratory, and different centres will be provided with different solutions to the same problems. The degree of risk of cross-infection of patients via lung function testing equipment remains unquantified. Based on currently available evidence, there is little justification for elaborate precautions for the majority of patients attending the laboratory, but attention to appropriate routine cleaning and disinfection protocols is important.2 24
There should be local policies, including cleaning protocols, which have been approved by local cross-infection teams.
Disinfection and sterilisation can be achieved by a variety of methods, although chemical methods should be used with caution for health and safety reasons. Identification of factors increasing the susceptibility or infectivity of particular patients, such as those with cystic fibrosis (CF), is important in determining appropriate precautions, and these precautions may be advised by national or international recommendations in relation to the specific disease.
Where patients are known to be infectious or are immunocompromised, additional precautions such as using a barrier filter is appropriate. Until further studies are able to quantify the degree of risk of cross-infection that lung function test equipment poses, the recommendations given in the 2003 review of Kendrick et al24 provide a practical approach to dealing with this problem.
Quality assurance
Good quality assurance systems will ensure that a robust series of checks—before, during and after the patient’s visit—will ensure that the results generated will be as accurate and precise as possible. This ensures that the results reported are the best possible representation of the subject’s status. Good repeatability of the measurements within a visit and reproducibility between visits (whether at the same or different establishments) help to ensure that lung function results are reliable for clinical decision-making.
The quality of the output of any particular laboratory is a product of several factors, all of which would be demonstrable by good governance with regard to potential sources of error.25
The following are the principal sources of error:
Procedures and protocols.
Equipment.
Operator.
Patient.
Departments may want to demonstrate their compliance with governance standards by registering with a recognised accreditation scheme. In the UK this would be the Improving Quality In Physiological Services (IQIPS) programme.26
IQIPS is a system of mandatory accreditation in the UK, for physiological services, including respiratory and sleep services. This involves completion of an online ‘Traffic Light Ready’ tool followed by an onsite visit and is recognised by the Care Quality Commission. IQIPS can also act as a service improvement tool, to highlight areas where services are below the required standard to facilitate service improvement.
Procedures and protocols
The standards set out in the various sections of this document enable a consistent approach to each diagnostic procedure and thus reduce variability in performance of the test. Standard operating procedures (SOPs) should be available and regularly updated to record local procedures and the rationale behind any deviation from standard practice. These documents should be ratified by local governance mechanisms. SOPs may require additional supporting documentation such as Risk or Control of Substances Hazardous to Health assessments.27
Equipment
Equipment used in routine diagnostic procedures should only be used according to manufacturers’ recommendations and must meet local legislative regulations for use in healthcare. Patients should not be tested on systems with any modifications to equipment or alteration to procedures unless they have been risk-assessed and approved through local governance mechanisms before use.
Because reference values rely on accurate measurement of patient demographics, it is important that equipment other than the diagnostic machines are also checked for accuracy, for example, stadiometers and weighing scales. Barometers and thermometers used to calculate the BTPS correction factors applied also need to be maintained and verified.
Planned preventative maintenance
Routine day-to-day maintenance is essential to keep equipment in prime condition. A planned preventative maintenance (PPM) schedule specifies what intervention is needed at what interval. The system used to track PPM (commonly a log book) should identify when an intervention is due and then when it was performed and by whom. Items recorded will depend on the actual equipment in use but must include manufacturer’s service visits and replacement of parts, including software updates.
Servicing of equipment should be carried out at the frequency recommended by the manufacturer using appropriately qualified and authorised personnel.
Following service visits the authorised agent should certify that the equipment is working to specification before it is returned to clinical use.
Calibration/Verification
Regular calibration/verification should be performed at a frequency appropriate to the characteristics of the instrument being used. In most applications this would be at least daily or prior to a testing session if used less than daily. See each separate section for test-specific recommendations.
Calibration/verification needs to be augmented by a set of physiological control checks (BioQC) which check all aspects of the system (operator, procedure and equipment). Laboratory time needs to be set aside for each piece of equipment to be tested in this way at least weekly. BioQC programmes improve measurement quality28 and should be a mandatory part of any laboratory’s routine.
Elements of a BioQC programme
Subjects volunteering for a BioQC programme must give written consent to participate and share their data for this purpose. It should be borne in mind that confidentiality of data collected as part of quality assurance procedures is subject to the same rules as patient confidentiality.
Good control of all the quality assurance factors discussed above should ensure minimal error in reproducibility of measurements. Maintaining a regular programme of BioQC on stable subjects can help identify abnormal variability in any particular combination of operator, procedure and equipment.
A BioQC programme for pulmonary function tests should incorporate measuring all indices at least weekly on a subject who is free from any lung disease and can produce stable results over time. Ideally more than one subject should be used.
Many lung function systems now record calibrations and even biological control (BioQC) procedures within the equipment’s own software—it is unnecessary to duplicate such events in a PPM log, but all contemporaneous sources will need to be reviewed if trying to trace the source of a fault discovered later.
For each index being monitored obtain 10 measurements over 10 sessions on consecutive working days, record the mean and upper and lower limit (mean +2 SD, mean −2SD, respectively) for each index. This establishes the upper and lower limits for each index within which all subsequent values should fall. On subsequent weekly measurements of the BioQC, obtain the measurements for each index and check these are within these previously defined limits. If they fail this check then the equipment should be taken out of service until the source of the abnormality can be identified. Best practice would be to run at least one other BioQC on a different subject to ensure that the error is with the equipment and not the individual. At least once every 2 years the 10 reference measurements need to be repeated to generate new limits of agreement.
Any significant change to the equipment or software being used should prompt performance of BioQC checks to monitor the stability of measurements. During routine testing sessions a BioQC may be needed to check the validity of an instrument which is in doubt when a simple calibration/verification check does not persuade the operator that it is working correctly.
Facilities
Lung function laboratories should maintain facilities in accordance with recommendations published by the ARTP,29 which also summarise relevant legislative issues. Where departments do not meet these recommendations, this should be highlighted to senior management and clinical governance teams as potential safety risks to both patients and staff.
Personnel
Leadership
A senior regulated, experienced physiologist (Band 7 and above) should have responsibility for all aspects of the lung function service. They may have postgraduate qualifications, be able demonstrate competence in all aspects of lung function measurement and show evidence of continuing professional development. They may also have research skills.
Operator competency
A variety of healthcare professionals undertake measurements of respiratory physiology. This is particularly evident when considering the range of healthcare settings in which the measurement of lung function is performed.
It is widely recognised that formal classroom-style training alone does not ensure practical competency. It is expected that all healthcare professionals performing measurements of spirometry and/or full lung function testing have an appropriate qualification of competency or can demonstrate equivalence. Professional training programmes are often provided by regulatory groups/governing bodies. The current ARTP professional examinations (www.artp.org.uk) are a UK example of professional competency. Healthcare professionals performing lung function tests should be on an appropriate professional register (where appropriate), for example, Registration Council for Clinical Physiologists (www.rccp.co.uk), Academy for Healthcare Science (www.ahcs.ac.uk) or Health and Care Professions Council (www.hcpc-uk.co.uk). It has recently been mandated that all operators performing spirometry in the UK should have the equivalent of the ARTP Spirometry Certificate and be enrolled on a Register of Spirometry Practitioners,30 which requires revalidation every 3 years.
Regular feedback of an individual’s performance in all aspects of their delivery of a quality assured diagnostic service is essential. This is best achieved through a planned personal development and review system.
Equally it cannot be presumed that individuals who have achieved their qualifications in the past continue to be competent without ongoing assessment. The performance of practitioners has been shown to decline over time.31 Maintaining competency can be achieved via a number of means:
Routine quality checks of all results.
Peer review of operators and results.
Interdepartmental comparison of results.18
Patient variability
In order to accurately identify changes in lung function indices that may be due to a disease process, it is important to minimise all variability in the measurements. A significant source of variability can be the patient.
Specific factors that are acknowledged to affect particular tests and the pretest instructions to be given to minimise variability have been discussed in the relevant sections of this document.
Some local standards will also likely apply to pretest instructions, for example whether the clinician interpreting the results will want to see baseline spirometry performed either prebronchodilator or postbronchodilator. Any known variance from these standard prerequisites needs to be recorded on the test report in the form of technical comments.
Overall the contribution that the practitioner makes can have a profound effect on the patient’s compliance and performance. Clear and precise instructions coupled with a firm and confident attitude will induce and encourage the best performance from the patient. With some reluctant patients it can be important to explain the reasons for a test in relation to the clinical context to gain cooperation, which is where a good background of clinical knowledge and experience is essential.
Test variability
Adherence to the principles described in this chapter will reduce the potential sources of error in testing procedures and ensure consistent and valid results are presented.
With good operator technique and good patient cooperation, it should be possible to get repeatable readings for any subdivision of lung volume that are <150 mL or <5%. It has been shown that coefficients of variation of <5% for spirometry, <7% for lung volumes and <9% for gas transfer are achievable.28
Reference values
Introduction
Having obtained test results of lung function from a subject, a clinician needs to be able to interpret what these mean in the context of the patient’s clinical condition. Any given set of test results may need to be interpreted in isolation, and because lung function is related to the ethnicity, sex, age and height of the subject we need to be able to account for these first before we can decide if the subject’s results are in any way unusual. For this one relates the result to relevant reference values. (The ‘Standardised residuals (z-scores)’ section addresses how best to assess a subject’s result against their predicted value.)
If a clinician is following a patient longitudinally, then previously obtained results can be used as a reference to help see what is happening to this subject over time. (The ‘Grading severity’ section addresses some of the issues around longitudinal change.)
Sometimes it is necessary to decide how abnormal the result is for a subject. This may be to help prognosticate from the test result or to decide if a critical level has been achieved that triggers a change in management. (The ‘Grading severity’ section addresses how one can best assess the severity of any lung function deficit.)
Basic principles
The predicted value for a particular lung function index is obtained by using reference equations, which are discussed later (see ‘Which reference equations?’ section). Standardised residuals (SR; also known as z-scores) have long been32 and remain5 the preferred method for comparing the subject’s recorded value with the predicted value. Per cent of predicted is not an accurate method for making a comparison with the reference range (see ‘Per cent of predicted’ section). The reasoning behind this is explained in the following:
The values for lung function indices within the normal healthy population are known to vary according to age, sex and height of the subject. So in a large population sample there is a scatter of results. Figure 1 shows such a scatter for forced expiratory volume in 1 s (FEV1) in men against age on the left and against height on the right.

Plot of idealised population data for FEV1 in men. The left panel shows a plot of FEV1 against age (in years) for men of height 1.77 m and on the right a plot against height (in metres) for men aged 50 years. Source: Professor MR Miller. FEV1, forced expiratory volume in 1 s.
Standardised residuals (z-scores)
The scatter of values seen in the young is approximately the same as that seen in the elderly. The same is true for values with respect to height. For a given age and height the results found in a large sample of a healthy population approximate to a Gaussian distribution, so it is possible to obtain a mean value for a given age and height, and the scatter is described by the SD of the distribution. The 95% and 90% confidence limits for the normal population can then be estimated as mean±1.96×SD and mean±1.645×SD, respectively. These values are taken from statistical tables and follow the scientific principles accepted by all science disciplines worldwide for data with normal distributions.
When deriving normal values for tests that are applied indiscriminately to the general population (eg, when undertaking unselected screening), the 95% confidence limits are usually taken, which means the lower limit of normal (LLN) is the mean, -1.96×SD, which approximates to the lower 2.5th percentile. Thus 2.5% of a healthy population might have a result below this level and yet be entirely normal. These would be deemed false positives. Because lung function tests are not applied indiscriminately in this way but are only undertaken when indicated by the presence of symptoms or other signs of disease, it is recommended5 to use an LLN of the lower fifth percentile (mean −1.645×SD), which trades some specificity for increased sensitivity in detecting true disease.
Figure 2 shows a patient’s observed result (O) plotted in the context of the population results together with the subject’s predicted value (P, the mean population value for someone of the same age, sex and height). The difference between O and P is called the subject’s residual. If this value is divided by the SD of all the residuals for the healthy population, it is called a standardised residual (SR).

Plot of idealised population data for FEV1: standardised residual (SR). FEV1 is plotted against age for men of height 1.77 m with a subject’s value O and their predicted value P outlined. The sloping line denotes the predicted values against age. Thus, FEV1SR=(observed FEV1−predicted FEV1)/RSD, where RSD is the residual SD taken from the healthy population used to make the prediction. Source: Professor MR Miller. FEV1, forced expiratory volume in 1 s.
An SR is a dimensionless number which states how many SD the subject’s value is from predicted and this is identical to a z-score. A negative SR means the result is below predicted. An SR value of 0 means the result is identical to the predicted. So an SR of −1.645 puts the result on the fifth percentile and is at the LLN.
Percent of predicted
In the early 1960s an American textbook on respiratory medicine suggested that ‘a useful general rule is that a deviation of 20% from the predicted normal value is probably significant’.33 This recommendation came with no supporting evidence, but the practice has been widely applied ever since. Soon after this statement was made, a serious flaw in the use of per cent of predicted was exposed,34 and this problem was revisited over 20 years later.35 The problem is that the natural scatter of lung function data within the healthy normal population is not proportional to the mean value. This is best seen in figure 3, showing that for FEV1 the LLN for older subjects is lower than 80% of predicted; this is also seen for forced vital capacity (FVC) and carbon monoxide transfer factor (TLco).

Plot of idealised population data for FEV1: 80% predicted and LLN. FEV1 is plotted against age for men of height 1.77 m showing a thin line representing 80% of the predicted (pred) value and a thick line showing the true lower limit of normal (LLN), that is, the fifth centile value 25–70 years. Source: Professor MR Miller. FEV1, forced expiratory volume in 1 s.
Figure 4 shows how for total lung capacity (TLC) the problem is the opposite way around, with the LLN being above 80% of predicted, which is also seen for FEV1/FVC.
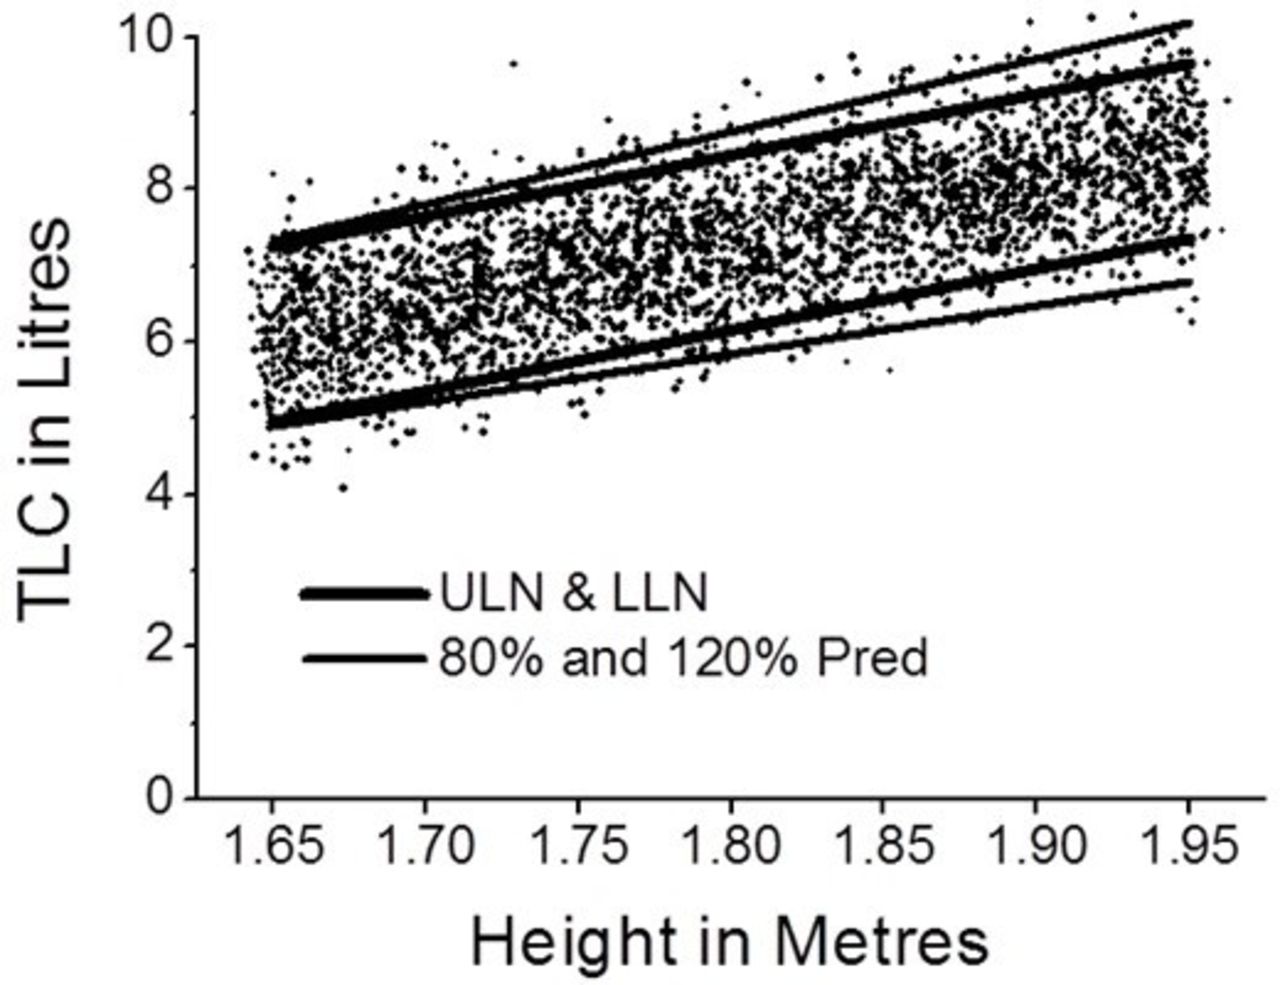
Plot of idealised population data for TLC against height for men. The thin line represents 80% and 120% of the predicted (pred) value, and the thick line shows the true lower limit of normal (LLN) and the upper limit of normal (ULN), that is, the 5th and 95th centile values. Source: Professor MR Miller. TLC, total lung capacity.
Eighty per cent of predicted does not relate predictably to the true population LLN for all ages, for all heights or for both sexes because the magnitude and scatter of results in the healthy population are very different for different indices. This is demonstrated in table 3, which shows the LLN values for several lung function indices for three subjects of differing age, sex and height when expressed as per cent of predicted and also shows 80% of predicted when expressed as population centiles. It can be seen that LLN when expressed as per cent of predicted varies widely between subjects and indices.
Values for the lower limits of normal
Because of this variation, if the 20% deviation rule is applied to patient lung function data, about 20% of subjects will be misclassified in terms of their likely disease.33 A clinical diagnostic algorithm using per cent of predicted that gets one in five diagnoses wrong is clearly not one to recommend, and so per cent of predicted should not be used to assess if a patient’s result is unusual.
In table 3, if 80% of predicted equated to LLN, then the centile values would all be 5. Centiles above 5 indicate that 80% of predicted is above the LLN.
Forced expiratory volume in 1 s/forced vital capacityFEV1/FVC
The Global Obstructive Lung Disease (GOLD) group in 200136 introduced the idea of using a fixed value of 0.7 for FEV1/FVC as the cut-off for defining the presence of airflow obstruction. This was based on the results of one paper37 that suggested this was the LLN for men, but these authors found this was not true for women, where the LLN declined with age. The population sampled in this paper included very few elderly men, making it unreliable. Over 50 other studies worldwide38 have found that FEV1/FVC declines with age in both sexes. Using a fixed ratio is incorrect practice and overdiagnoses obstruction in the elderly (especially men) and underdiagnoses it in younger people (especially women).39–41
Using LLN for FEV1/FVC (see ‘Standardised residuals (z-scores)’ section) is the correct way to determine the presence of airflow obstruction. To illustrate this problem figure 5 shows a plot of FEV1/FVC data against age from the Health Survey for England data in 200142 for men on the left and women on the right. It can be seen that there are more false positives in men compared with women and more false negatives in women compared with men when using the incorrect 0.7 criterion instead of LLN for defining airflow limitation.

A plot of FEV1/FVC against age. On the left are data for 4991 men and on the right for 5811 women. The horizontal line shows the 0.7 cut-off and the slanting line is the LLN. The points above both these lines are within the accepted range for both criteria. The points below both lines are abnormal by both criteria. The dark closed circles between the lines to the right of each plot are the points positive for airflow limitation by 0.7 but not by LLN (false positives). The open circles between the two lines to the left of each plot are abnormal by LLN but not by 0.7 (false negatives). Source: Professor MR Miller from the Health Survey for England 2001 data.42 FEV1, forced expiratory volume in 1 s; FVC, forced vital capacity; LLN, lower limit of normal.
Which reference equations?
A large number of test results are needed from people who are free of any disease that may affect lung function with an adequate number of men and women and with a good range of ages and heights in order to be able to make a sensible prediction of what an individual’s lung function should be. It has been estimated that at least 150 subjects of each sex are needed in order to make a reasonable estimate of what the predicted values should be.43 Several data sets used in the past would not meet this criterion. The reference subjects should ideally also be of similar demographic and ethnic background to the people being tested. Clearly reference values taken from sampling elite athletes would not be appropriate for clinical patients since these athletes usually have supranormal lung function, which is why they are able to compete successfully in their sport.
Spirometry
In the last few years reference values from the Global Lung Initiative (GLI), sponsored by the ERS, have become available.44 These have been derived from the data of over 70 000 subjects obtained from many nationalities so that some aspects of ethnicity can be accounted for. This is the largest data set to date for this purpose and has used the most sophisticated statistical techniques so that one set of equations can be used for subjects from the age of 4 through to 95 years. This latter fact is a great advance and these equations should be adopted.
Recent evidence45 suggests that GLI gives too high a predicted value for the very elderly (over 90 years old), possibly because asymptomatic ‘never-smokers’ of this age who are able to participate in providing ‘normal’ lung function values are in some sense ‘supra-normal’ for this age. Extrapolating National Health and Nutrition Examination Survey (NHANES) III equations46 was a better fit for these subjects. Although it was recommended not to extrapolate NHANES III beyond the age of 80 years, because at the time of their issue it was not known how good such a prediction might be, it now seems that extrapolation may well be justified and a better fit than the alternative. However the GLI initiative is prospectively collecting healthy controls on the ‘missing’ age and ethnic groups, and ARTP recommend the use of GLI values in most subjects.
One issue in the past for clinicians managing children with lung disease was the previous lack of coherent prediction equations that would work through teenage years through to early adulthood. The GLI equations have addressed this problem. Reference equations for children are discussed further in the ‘Paediatric Reference Values’ section.
Static lung volumes and gas transfer
The European Community for Steel and Coal equations33 can be used for static lung volume to provide a practical set of equations for these indices. The GLI group have also developed all-age equations for lung gas transfer in Caucasian subjects47 and are collecting data to produce reference equations for static lung volumes to be published in the near future, and ARTP will be recommending their use when they become available.
For reference equations for children, see the ‘Paediatric Reference Values’ section.
Grading severity
This is often a vital point if it is thought that a particular intervention is warranted when a test reaches a certain value. Arbitrary cut-off points using per cent of predicted values of FEV1 have been suggested to grade severity of chronic obstructive pulmonary disease (COPD),36 but no objective evidence supported this and per cent of predicted values retain age, sex and height bias. A valid way to grade severity should relate to subsequent survival, and it has been shown that z-scores are not ideal in this respect and per cent of predicted is not as good as other methods for grading FEV1 values.48 An important point that helps to clarify this is that patients dying of severe CF at the age of 20 years have an absolute FEV1 the same as a 70-year-old patient dying of COPD, and yet in terms of per cent of predicted the value of a patient with CF is much lower than that for the elderly patient with COPD. This problem led to poor outcomes for transplantation in children with CF when a fixed per cent of predicted value taken from adult practice was used to trigger transplantation, which was then being undertaken prematurely.49
The z-score thresholds for FEV1 have been proposed for assessing the severity of airflow obstruction.50 This grading has been adapted in table 4 for the possible grading of other indices.
Severity grading and probability of a result being found within a normal healthy population for various z-score thresholds
Severity classification in airflow obstruction is a two-stage process:
The FEV1/FVC (or FEV1/VC) must be below the LLN (z-score <−1.645) to be classified as obstructive.
Severity grading is then based on the FEV1 z-score as above, with the exception that the mild classification would include any FEV1 z-score ≥−2.
The grading system in table 4 will remove the sex, age and height bias implicit in per cent of predicted grading systems.50
FEV1 (or FVC) standardised by a power of height has been shown to give a better prediction of survival in the general population compared with per cent of predicted51 and gave a better grading of COPD in terms of survival than the GOLD grading.52 In UK patients FEV1/ht3 gave a good prediction of survival48; better still at predicting survival was the FEV1 quotient (FEV1Q), which is the FEV1 divided by a sex-specific population first centile value (0.5 L in men, 0.4 L in women).41 FEV1Q can be considered as the number of turnovers of the lower survivable limit that remain for the subject. Future work is needed to define and compare grading limits from FEV1/ht3 and FEV1Q, which better relate to survival than both per cent of predicted values, with their inherent problems (see ‘Per cent of predicted’ section), and z-scores.
Longitudinal trends
Following the progress of a patient during the management of their lung disease is the usual clinical scenario, and this raises the question of how best to monitor their lung function. As this involves a within-subject comparison, it is best to use the absolute values of various lung function indices taken together with an understanding of how much natural variation there is in each index on repeated testing so one can interpret whether an observed change is greater than can be expected by chance.53 Estimating true lung function decline can require observations over 5–10 years.54
There are many factors that can influence variability in lung function. Over time periods of less than 1 year, statistical methods of estimating variation are not sensitive. The normal variability over time will also depend on the disease process being monitored, for instance as described in COPD by Vestbo et al.55
Repeated testing of spirometry can lead to within-subject variations of up to 200 mL.53
Since reference equations (see ‘Which reference equations?’ section) are all derived from cross-sectional studies, z-scores derived from them are not ideal for monitoring longitudinal change since this is less on an annualised basis than that inferred from cross-sectional equations56 due to a cohort effect that has nothing to do with longitudinal change. The cohort effect is best understood by realising that individuals aged 80 years old whose data were included in a set of reference equations had different childhood exposures, nutrition and growth trajectory than those aged 30 years old included in the same data set.
Ethnicity
It has long been noted that, for example, the FVC of individuals of white Caucasians tends to be larger than that found in individuals of similar height of African descent. This could relate to a poorer socioeconomic background during childhood leading to poorer lung development or might be a true genetic effect. Current evidence favours the latter as the more powerful contributor to this effect.57 The GLI 2012 equations for spirometry have attempted to account for this effect.44 It has to be accepted that this is an imperfect fit and there are difficulties in ascribing ethnicity to individuals especially those of mixed descent.
Summary
It is important when using lung function to make clinical decisions to understand the potential problems associated with these data. Technical issues and patient issues may mean the results obtained are not true representations of the subject’s clinical condition.58
It is important that properly trained healthcare professionals undertake the tests and have the facility to add comments, pointing out if there were any technical issues which can be helpful to the clinician interpreting the findings.
It is recommended that the report states the z-score and normal range to determine whether there is an unexpected result for that individual. When determining the severity of any unexpected result, the classification as outlined in table 4 is currently recommended.
When providing a trend of lung function data over multiple visits, the serial display of absolute values is recommended.
Spirometry
Definitions
Relaxed vital capacity
When the term vital capacity (VC) is used without any further qualification, it conventionally refers to relaxed vital capacity (RVC). This can be measured in two ways, the former being the most common with desktop spirometers. Some spirometers will call this slow vital capacity (SVC), but RVC is the preferred term.
Expiratory vital capacity
Expiratory vital capacity (EVC) is the maximum volume of gas that can be expired from the lungs during a relaxed but complete expiration from a position of full inspiration.
Inspiratory vital capacity
Inspiratory vital capacity (IVC) is the maximum volume of gas that can be inspired into the lungs during a relaxed but complete inspiration from a position of full expiration.
Forced expiratory volume in 1 s
FEV1 is the maximal volume of gas that can be expired from the lungs in the first second of a forced expiration from a position of full inspiration.
Forced vital capacity
FVC is the maximal volume of gas that can be expired from the lungs during a forced and complete expiration from a position of full inspiration.
Peak expiratory flow
Peak expiratory flow (PEF) is the maximum flow achievable from a forced expiration starting at a full inspiration with an open glottis.
FEFx% (FEF25%, FEF50%, FEF75%)
Forced expiratory flow (FEF) is the maximum flow achievable during a maximum forced expiratory manoeuvre when X% of the FVC has been exhaled, that is, FEF25% is the maximum flow rate achievable when 25% of the FVC has been exhaled and FEF75% is when 75% of the FVC has been exhaled.
FEF25%–75%
This is the mean expiratory flow generated between 25% and 75% of the FVC during a maximum forced expiratory manoeuvre.
Equipment calibration/verification
Quality control must be performed on a regular basis to determine the accuracy and/or precision of the device using a known standard or signal. If barrier filters are used, then calibration or verification of the equipment must be performed with the filter inserted between the calibration syringe and the device.
Volume calibration
All spirometers should be checked regularly for accuracy of volume and linearity. Some devices (eg, wedge bellows) cannot be calibrated or internally adjusted to read volume accurately each day or session; however, all devices can be verified to see whether they read a calibration signal within acceptable limits.
A 3 L syringe should be used for calibration checks for spirometers; the syringe should have an accuracy of 15 mL or 0.5%, whichever is greater, and be recommended for the calibration of spirometers. These syringes also need calibration checks at least annually or if damage is suspected (eg, having been dropped).
Calibration checks (verification) should be performed at least once for each day of testing and should be repeated every 4 hours of use where possible across the volume range. If the room temperature changes by more than 5°C, recalibration may be indicated. If the device is being switched on and off for transportation between rooms, then calibration needs to be repeated.
All verification and calibration data should be stored either in the machine software or, preferably, in a calibration log book for the equipment. This is the only guarantee of the reliability of the equipment.
Calibration checks should produce a measured value within 3% of the syringe volume (ie, between 2.91 L and 3.09 L for a 3 L syringe). For systems that generate a software correction factor, the correction factor should be within the range of 0.97–1.03, which is within 3%.
Flow sensing spirometers that measure flow at the mouth may require separate correction factors for inspiratory and expiratory volumes. For flow-based spirometers, the 3 L volume should be injected at three different flow rates between 2 and 12 L/s; volume accuracy should be within 3% at all flows. All calibration syringes should be maintained at the same temperature and humidity as the spirometer. Calibration syringes should be returned to the manufacturer annually for servicing and accuracy checking.
Quality control for spirometers should be performed as if a subject was being tested and the calibration syringe should be connected to the same port as the patient would be. Where appropriate, volume verification should be performed with an inline bacterial filter.
If the percentage error on calibration exceeds the allowable limits, a detailed examination of the spirometer and recording device should be performed in order to locate the source of any problems. All equipment should be checked for damage caused by the equipment being dropped. The most common problems that are detected are the following:
Cracks or leaks.
Holes in the flow sensor, channel plugging or excess moisture (flow sensing devices).
Connectors and tubing with leaks.
Inaccurate timing on the recorder.
Inappropriate or inadequate software calibration, or other technical problems with the computer interface.
Calibration syringe out of range: the syringe should be certified for accuracy at least annually by the supplier, as mentioned earlier.
Linearity testing
The linearity of spirometers can be confirmed by introducing 1 L increments from a calibrated syringe. Some suppliers have a 1 L syringe with an inbuilt valve mechanism. If using a 3 L syringe, then a two-way non-return valve needs to be placed between the syringe and the device. By pumping in 1 L increments over the working range from 0 to 7 or 8 L, a plot of actual recorded and expected volume can be obtained. The process is simple and takes no more than 5 min to complete. If the spirometer is indeed linear, the volume recorded for each increment should match that delivered by the syringe exactly, but in reality there may be some small variation between the recorded and the expected values.
Testing for leaks
It is important that closed spirometers are checked for leaks before a patient is tested on the equipment. The spirometer should be filled with air and the end of the breathing tube occluded with a rubber bung. The volume in the spirometer can be marked on chart paper, and then rechecked and recorded after a few minutes have elapsed. There should be a difference of less than 50 mL between the recorded volumes, otherwise a significant leak is indicated.
Physiological control
On a regular basis, a member of staff should undertake a forced expiratory and inspiratory manoeuvre to ensure that the integrity of the device is fully operational. By plotting the data in serial format, which the spirometer software may be able to do automatically, variations in the key indices can be observed over time.
Initially, in order to understand the variability of a subject, a number of technically acceptable measurements need to be made, and their average and variation estimated 5%. Thereafter, new values added can be monitored for any possible faults in the system.59
Correct performance
The equipment and the subject are prepared for the test and the purpose and nature of the test are explained. It is useful to demonstrate the technique to the subject to enable better understanding of what is required of them. Ideally the subject should be sitting upright in a chair with arms, their feet flat on the floor. Patients should be asked to loosen tight-fitting clothing, where this is obviously restricting the movement of their chest wall and abdomen. Dentures should normally be left in place, unless they are loose, in which case it may be advisable to ask them to be removed. A noseclip is not essential for the measurement of forced expiratory manoeuvres; however, it is required for forced inspiratory manoeuvres and for relaxed manoeuvres.60
Relaxed vital capacity
Measurements of RVC, sometimes also referred to as SVC, should always be recorded prior to a forced manoeuvre, because forced manoeuvres may induce bronchospasm/obstruction. It is best practice to perform an initial measurement of an RVC manoeuvre because relying on FVC measurements alone can lead to an underestimation of lung volumes in the elderly and those with dynamic airway collapse (eg, COPD, emphysema).
RVC can be measured as part of another test (eg, static lung volumes) but should always be performed prior to any forced manoeuvre.
The subject is initially asked to breathe tidally through the mouthpiece, to establish a stable baseline at functional residual capacity (FRC). When the operator perceives that the subject is ready, they should be instructed to breathe in maximally and then to exhale fully at a sustained and steady flow rate until no further gas can be exhaled. It is important that the exhalation is continuous, and the subject should be encouraged to not hold back but to breathe out initially like a ‘big sigh’ followed by a determined effort to maximal exhalation. Consistent encouragement should be provided by the operator throughout, aiming to achieve a reproducibility of <150 mL between measurements.
Where specific equipment does not allow tidal breathing prior to the manoeuvre, it is essential that the operator observes and encourages the subject to ensure a maximal inhalation prior to attaching to the mouthpiece and that a tight seal is achieved quickly to prevent any effect on the measured exhalation.
Maximal flow-volume loop
For the accurate determination of forced expiratory indices, it is essential that the subject takes a maximal inhalation at the start of this manoeuvre, ensures that the exhalation is not delayed and is ‘blasted’ from the lungs as fast as they can, and that exhalation continues until no further gas can be exhaled.
The subject is again asked to breathe tidally through the mouthpiece to start. Once they are comfortable they are asked to take a maximal breath in and to exhale immediately ‘as hard and as fast as they can’. The exhalation should be encouraged throughout until the end of forced expiration criteria (see ‘End of forced expiration’ section) are achieved or the patient terminates the test. There should be minimal pause between achieving maximal inhalation and commencing exhalation (<1 s) as longer delays have been shown to impact on measured values of FEV1 and PEF.61
Once maximal exhalation is achieved, the subject should be encouraged to immediately breathe back in, forcefully and maximally, to full inspiration.
Where specific equipment does not allow tidal breathing prior to the manoeuvre, it is essential that the operator observes and encourages the subject to ensure a maximal inhalation prior to attaching to the mouthpiece and that a tight seal is achieved quickly to prevent any effect on the measured exhalation.
The subject should be carefully observed throughout testing to ensure they maintain the appropriate effort throughout the duration of the blow and that they do not cough or hesitate at the start of the blow.
A minimum of 30 s should be left between repeat attempts to allow the patient, particularly those with airflow obstruction, to recover. Patients should not be made to attempt repeat manoeuvres before recovery is complete.
Acceptability criteria
The objective is to obtain the best result for the subject on the day of the test. Various aspects of the manoeuvre need to be considered in order to be sure the subject has achieved the very best result.
Failing to satisfy all these aspects does not necessarily invalidate the results completely but will mean that they will be a less reliable estimate of their true lung function. Rather than deleting all the data from unsatisfactory tests, it is better to retain these and then base the final results on the best tests obtained. A single unsatisfactory test result may still be able to answer a clinical question, for example whether the subject has sufficient function to be able to undergo a surgical procedure. If results are derived from tests that are in some aspects unsatisfactory, then the operator must draw attention to this fact in their technical comments.
Throughout test performance the subject should be observed to ensure that they are carrying out the instructions correctly, do not exhale prematurely or lose expired gas around the mouthpiece. These and other examples of incorrect performance can be observed on the flow-volume loop (figure 6) The subject must be encouraged to ensure that they continue to exhale until the flow of gas has ceased. In patients with airflow obstruction exhalation, either forced or relaxed, can be in excess of 10 s. A test will be suboptimal in the following circumstances:

Examples of spirometry errors. The blue line is the ideal curve and the red line(s) the erroneous curves. Source: ARTP Spirometry Handbook.
The patient did not inspire to TLC at the start*.
A leak at the mouth.
An obstructed mouthpiece due to tongue or false teeth.
A poorly coordinated start to the manoeuvre, as indicated by a rise time of 10%–90% of PEF of greater than 150 ms, or a back-extrapolated volume of greater than 5% of the FVC or 0.1 L if the FVC is less than 2.0 L.3
A cough within the first one second of the manoeuvre or later if it is deemed to have interfered with the blow.
Early termination of the blow or a Valsalva manoeuvre**.
The test was conducted with a submaximal effort.
*If the maximum forced expiratory manoeuvre is followed immediately by a full inspiration back to TLC and recorded as a single manoeuvre, then the Forced Inspiratory Vital Capacity (FIVC) must not exceed the FVC by more than 100 mL or 5% of FVC, whichever is the greater. If FIVC exceeds FVC by more than this, then it suggests the blow was not started from TLC. Correct calibration of the recording device to account for the differences (temperature and content) between expired and inspired air is crucial for this determination.
**Early termination of a test is not a reason to eliminate all data obtained from the manoeuvre as indices such as FEV1 may not have been influenced and will still be valid.
A graphical display of the expiratory manoeuvre is essential to allow the operator to inspect the trace for accuracy. The correct aspect ratio for the graphical plot of a flow volume loop (flow versus volume) is two units of flow per one unit of volume.3
End of forced expiration
The end of forced expiration occurs when the subject can blow out no more air and defines the VC. Premature termination of the blow will lead to an underestimate of the FVC and will falsely increase the FEV1/FVC ratio.
One of the indicators of the end of a forced expiration is a plateau on the spirogram with less than 0.025 L being expired over the last 1 s of the test. However, some subjects with severe airflow obstruction never achieve such a plateau even after exhaling for 20 s. Previously it has been suggested the blow should be maintained for at least 6 s in adults, but younger subjects may complete the manoeuvre in less time than this, as do patients with a severe restrictive defect. The operator should always encourage the subject to blow out for as long as possible. Failure to obtain a plateau and/or 6 s of exhalation is not ground to reject the blow. Exhalation times of >15 s are unlikely to change clinical decisions.3
Repeatability criteria
Subjects must perform a minimum of three technically acceptable maximum forced expiratory manoeuvres. The performance of at least three blows ensures a greater probability of obtaining an accurate result.
The chosen values for FVC and FEV1 should not differ from the next best values for FVC and FEV1 by more than 150 mL. In subjects with a FVC of <1.00 L, this difference should not be greater than 100 mL.
If the repeatability criteria are not achieved, then the manoeuvre can be repeated up to eight times, after which the probability of getting a better result is greatly reduced. If after all manoeuvres have been performed the above repeatability criteria have not been achieved, the results must not be rejected. The operator should label the results as not being repeatable allowing the interpreter to use the data accordingly. Poor repeatability means that the subject’s results are not a reliable estimate of their best function, so a further test may yield a different result due to the inherent variability in the subject.
For PEF about 90% of subjects can achieve three measures within 30 L/min (0.5 L/s)62 and 95% are within 40 L/min (0.67 L/s). Persisting beyond five attempts to achieve a repeatable PEF is not likely to improve the repeatability.3 The highest reading of at least three acceptable blows should be recorded. These should be within 40 L/min of each other.63
Selection of test results
The results chosen should be the greatest values from three technically acceptable tests (the FVC and FEV1 may therefore be taken from different manoeuvres and FEV1/FVC calculated from these). Some electronic equipment automatically selects the best test, based on the individual manoeuvre, which gives the highest figure when FEV1 and FVC are added together. This practice is not recommended.
If three technically acceptable and/or reproducible results are not achieved, the reason should be given in the report (eg, patient coughing or too unwell to perform the manoeuvre).
Results from recordings that do not meet all the above criteria for acceptability may still be useable with clinical discretion.
Potential problems
Many devices for recording spirometry now use flow as the primary measure rather than volume. Many devices (eg, pneumotachographs, ultrasonic flow heads) need to register the signal that represents zero flow prior to a test. If this is registered incorrectly then all subsequent flow measurements are incorrect. These are termed ‘zero flow registration errors’.
If volume accumulating spirometers are used (rolling-seal or wedge bellows), then cooling errors can occur since the gas at the moment of registering the exhaled volume is above ambient and subsequently cools. When a BTPS correction is made to FEV1 and FVC using the ambient temperature, this assumes that the gas had reached ambient at the time the index value was recorded. This is untrue for FEV1 and also untrue for FVC if it is registered within just a few seconds. These cooling errors tend to lead to FEV1 being falsely high relative to FVC. Heating the volume accumulating spirometer to 33°C will remove these errors as this approximates to the expired gas temperature at the lips.
Bronchodilator response
Rationale
The reasons for delivering a bronchodilator drug in the context of lung function testing may include the following:
To see if useful improvement in lung function can be achieved.
To record lung function post bronchodilator to see if airflow obstruction is still present.
To help confirm the presence of asthma.
It has been argued that asking the patient whether any useful improvement is achieved may be a better indicator than any particular test for assessing ‘useful improvement’. However an improvement in FEV1 by >4% of the subject’s predicted value has been found to be associated with useful improvement as assessed both by the subject and their peers.64
Recording postbronchodilator spirometry has been recommended for determining if someone has COPD. The idea being that any ‘reversible’ component will then have been relieved and it would be reasonable to presume that any remaining obstruction would be ‘fixed’. However bronchodilator response may be variable day to day so this is not entirely true.
There is debate about what degree of responsiveness would indicate the presence of asthma to distinguish it from other respiratory diseases. The result from short-term bronchodilator responsiveness alone is not a reliable method for making a diagnosis of asthma, as this clinical diagnosis is based on clinical examination and history together with diagnostic tests.63
Methods
Depending on the purpose of the test, other bronchodilator drugs that the patient is taking may need to be stopped for an appropriate time prior to testing (see ‘Withholding bronchodilators’ section) so that the response to the bronchodilator being assessed can be determined.
Maximal forced expiratory manoeuvres are undertaken (as described in ‘Spirometry’ section) to record FEV1, FVC, RVC and PEF preadministration and postadministration of a bronchodilator. The drug used may be salbutamol or terbutaline for a β2 agonist and/or ipratropium bromide for an anticholinergic agent. Delivery may best be undertaken by supervising the use of a metered dose inhaler with a spacer device, but a nebuliser could be used alternatively. An appropriate delay after administration must occur to allow the drug to achieve maximum effect (15 min for a β2 agonist and 30 min for an anticholinergic agent).3 Administration and dose of any prescribed medication should be covered by local protocol.
Expressing the results
The absolute changes in FEV1, FVC and PEF are to be recorded. There have been many suggested thresholds for determining if a clinically important degree of responsiveness has occurred,65 and all those based on percentage of baseline value and/or absolute change from baseline can lead to bias.
Previous practice has been to express the change as a per cent of the baseline value, but this leads to sex and size bias in the results, since the lower the baseline value the easier it is to achieve a given threshold percentage change. Also an absolute threshold criterion is often added and this biases results towards male sex being responders. It has been proposed that change should be expressed as per cent of the subject’s predicted value32 65 or as change in z-score66 as these methods are free from sex and size bias (box 1).
Different methods for calculating bronchodilator response
Absolute change (mL) from prebronchodilator value.

Percentage of initial prebronchodilator value (% initial).

Percentage of possible reversibility (% possible).

ECCS recommendation.

Percentage of predicted (% predicted).

Δz-score.


BD, bronchodilator; ECCS, European Community for Coal and Steel; FEV1, forced expiratory volume in 1 s; RD, residual volume.
A change in FEV1 of >8% of predicted has been shown to be associated with a subsequent survival advantage that would favour a diagnosis of asthma and active treatment.65 A change in z-score of 0.7 has also been proposed as a clinically meaningful change,66 and the authors also found that improvement of FVC postbronchodilator of >0.64 was more pronounced in those with the most severe airflow obstruction, suggesting a clinically important relief of hyperinflation.
Ideally bronchodilator response should be expressed as Δz-score for both FEV1 and FVC, with the %predicted response being an acceptable alternative.
Static lung volumes: introduction
Residual volume (RV), FRC and TLC cannot be measured directly. There are several accepted methods for determining these volumes, and the related indices, which are frequently referred to as ‘static lung volumes’. These methods include whole body plethysmography, nitrogen washout and helium dilution. Whole body plethysmography is recognised as a ‘gold standard’ method for the measurement of static lung volumes.67
In individuals with normal lung function, there should be minimal difference between FRC measured by whole body plethysmography (FRCPLETH) and gas washout/dilution techniques. However in patients with obstructive pulmonary disease with gas trapping, most studies indicate that FRCPLETH exceeds the FRC measured by gas washout/dilution68 69 and may do so to a considerable degree as this technique includes an estimation of unventilated parts of the lungs (‘trapped’ gas).
Definitions
Total lung capacity
TLC is the volume of gas in the lungs and airways at the position of full (maximal) inspiration.
Vital capacity
When the term vital capacity is used without any further qualification, it conventionally refers to an RVC measurement (sometimes also referred to as SVC), which can be measured in two ways:
EVC: the maximal volume of gas which can be expired from the lungs during a relaxed expiration from a position of full inspiration.
IVC: the maximal volume of gas which can be inspired into the lungs during a relaxed inspiration from a position of full expiration.
Residual volume
RV is the volume of gas in the lungs and airways at the position of full expiration.
Tidal volume
Tidal volume is the volume of gas expired or inspired during one breathing cycle.
Functional residual capacity
FRC is the volume of gas in the lungs and airways at the end of a tidal expiration.
Expiratory reserve volume
Expiratory reserve volume (ERV) is the volume of gas which can be maximally expired from the position of FRC.
Inspiratory capacity
Inspiratory capacity (IC) is the maximum volume of gas which can be inspired from the position of FRC.
Inspiratory reserve volume
Inspiratory reserve volume is the maximum volume of gas which can be inspired from the position of end-inspiratory tidal volume.
Lung volumes should be expressed in litres at BTPS.
Calculation of the lung volume subdivisions
Using the directly measurable values obtained from a spirometry manoeuvre and the indirectly measured lung volumes estimated by one of the techniques discussed in the following sections, the lung subdivisions can then be derived (figure 7):
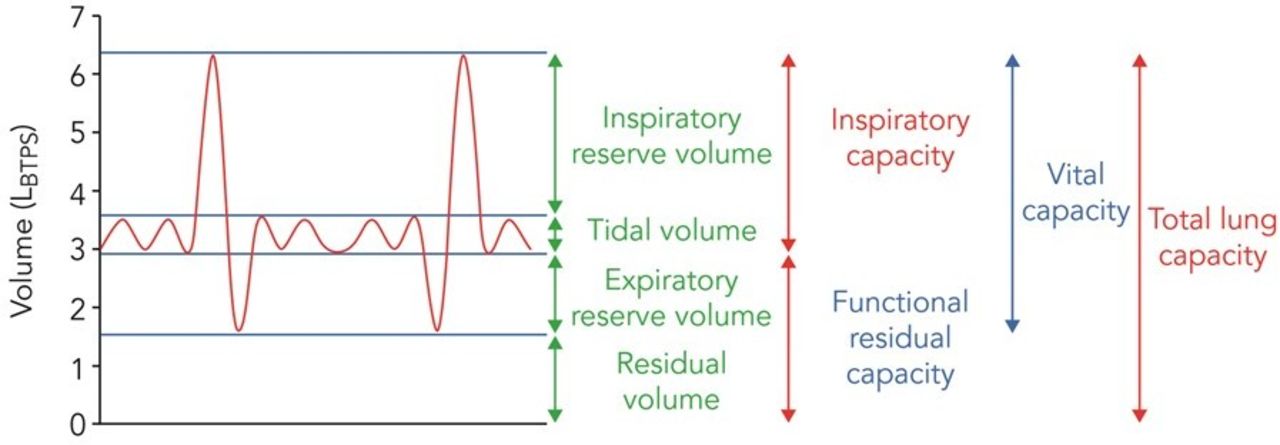
Static lung volumes shown on a volume versus time spirogram. The blue line is the ideal curve and the red line(s) the erroneous curves. Source: ARTP Spirometry Handbook. BTPS, body temperature and pressure saturated.
TLC can be calculated as either TLC=RV+VC or TLC=FRC+IC.
RV is either RV=FRC–ERV or TLC–VC.
The former equation is preferable and ideally should be calculated from measurements performed without the patient disconnecting from the mouthpiece as the RV can be miscalculated in patients with significant obstruction when using the VC from a separate spirometric measurement.4
Specific to whole body plethysmography
Thoracic gas volume
Thoracic gas volume (TGV) is the volume of compressible gas within the thorax at the time of airflow occlusion during plethysmographic measurement, which may be higher or lower than FRC depending on precisely where airflow occlusion occurs during the tidal breathing cycle.
FRC determined by whole body plethysmography
This is the volume of intrathoracic gas measured when airflow occlusion occurs at FRC. A correction may be applied to TGV to obtain FRCPLETH.
Alveolar dry gas pressure
Alveolar dry gas pressure (PALV) is the pressure in the alveoli at any point throughout the respiratory cycle. ΔPALV is the change in alveolar pressure. When the glottis is open with no airflow, PALV is the difference between ambient PBOX and saturated water vapour pressure at body temperature (PH2O,sat).
Mouth pressure
Mouth pressure (PMOUTH) is the airway pressure measured at the mouth at any point throughout the respiratory cycle. ΔPMOUTH is the change in pressure measured at the mouth during panting against a closed shutter.
Box pressure
Box pressure (PBOX) is the pressure measured within the sealed body box at any point throughout the respiratory cycle. ΔPBOX is the change in pressure measured within the body box.
Shift volume
Shift volume (ΔV) is the change in TGV as determined from the change in plethysmographic gas pressure during compression and decompression of thoracic gas, expressed as a volume.
Flow
Flow (V̇) is measured at the mouth or via a transmural port which when integrated electronically or mathematically yields volume.
Measurement of lung volumes: whole body plethysmography
Measurement principles
This section relates to constant volume plethysmography.70 The principle of whole body plethysmography is based on Boyle’s law, which states that at a constant temperature, the volume (V) of a given mass of an ideal gas is inversely proportional to its pressure (P), that is, PV=K. The constant (K) is proportional to the mass of the gas (the number of moles) and its absolute temperature. Assuming that temperature remains constant (isothermal conditions of measurement), the following mathematical expression is developed:
P1 × V1=P2 × V2
Determination of TGV is possible if the lungs can be treated as a closed compartment and if alveolar pressure can be measured simultaneously to the changes in volume. At the end of a tidal expiration, with the airway open (ie, at FRC), PALV closely approximates PMOUTH, which is equal to atmospheric pressure. The lungs are made a closed compartment by closing a shutter at the mouth at the end of a tidal expiration. This prevents airflow. The patient is instructed to make gentle panting efforts with the shutter closed. This causes rarefaction of the gas in the lungs during inspiratory efforts (TGV↑, PALV↓) and compression of the gas in the lungs during expiratory efforts (TGV↓, PALV↑).
TGV=PMOUTH × ΔV/ΔP
As the panting manoeuvre commences at the end of a tidal expiration where PMOUTH is equal to atmospheric pressure (PB) the equation can be simplified to the following:
TGV=PB × ΔV/ΔP
ΔV/ΔP represents the slope of the simultaneous changes in box volume versus the changes in PMOUTH.
The measured TGV includes equipment dead space (which is known and documented by the manufacturer) as well as any volume inspired above resting end-expiratory lung volume at the moment of occlusion. FRCPLETH is derived from TGV by subtraction of these two components of volume (figure 8).

Body plethysmographic method for lung volume estimation. Body plethysmograph (body box) for measuring thoracic gas volume (VL). The subject (in B) relaxes at end–expiration (~FRC) with PMOUTH=PALV=PBOX=Patmospheric (Pb). The shutter (see A) is closed in C, and the subject pants slowly and gently; on inspiration VL is rarefied and increases by ºΔV, PMOUTH falls and PBOX rises (box gas is compressed by + ΔV lung). ΔPBOX is plotted against ΔPMOUTH . Subsequently, the shutter opens and inspiratory capacity is measured using the pneumotachograph signal (see A). Note calibrating signal for assessing ΔPBOX in terms of ΔVbox. Reproduced from Hughes, ‘Physiology and Practice of Pulmonary Function’ published by the Association for Respiratory Technology & Physiology. FRC, functional residual capacity; PALV, alveolar pressure; PBOX, barometric pressure; PMOUTH, mouth pressure.
Assumptions of plethysmography
During plethysmographic measurements the airway opening is briefly occluded to hold the lung at a constant volume (normally at end expiration, ie, FRC). Respiratory efforts that compress and rarefy the thoracic volume are recorded. By relating changes in PALV (reflected by pressure changes at the airway opening during periods of no airflow) to changes in thoracic gas alveolar volume (reciprocal to pressure changes in the plethysmograph), TGV at the moment of the occlusion can be calculated. There are however a number of assumptions relating to this technique.
Pressure-volume changes in the body are isothermal
An underlying assumption of the technique is that the pressure-volume changes in the body are isothermal. During inspiration, air is warmed and humidified to body temperature and pressure under saturated conditions (BTPS), and air is cooled during expiration. It is assumed that any heat generated by warm, expired air is instantaneously lost to the surrounding tissue, such that changes of alveolar volume will occur under isothermal conditions. However, during rarefaction and compression of gas within the plethysmograph, heat may or may not be lost through the walls of the container (ie, conditions within the plethysmograph are not isothermal). The plethysmograph must therefore be calibrated at an appropriate frequency to mimic respiratory efforts. The plethysmograph is also open to the atmosphere via a small leak with a mechanical time constant of between 5 and 25 s. This controlled leak minimises slowly occurring pressure changes that are not related to respiratory manoeuvres, such as thermal drift (heating) caused by the presence of a subject breathing and body heat within a closed chamber.
Linear behaviour between changes in PMOUTH and PALV
The respiratory system comprises both elastic recoil forces and resistance forces; thus, a pressure change in the respiratory system will take a finite time to come to equilibrium. This time constant (τ) of the respiratory system is a function of the elastance/compliance and resistance of the system and is the time taken for 63% of a step change to stabilise.
Defined as τ=1/elastance × resistance; or τ=compliance × resistance.
Stiff lungs (low compliance) with a low resistance will therefore have a short τ and empty and fill rapidly, whereas lungs with normal/high compliance and high airways resistance will have a long τ and will empty/fill more slowly. The main assumption of body plethysmography is that changes in PMOUTH closely approximate changes in PALV during respiratory efforts against an occlusion (ie, there is equilibration); however, in airflow obstruction (where there is a long τ) the PMOUTH and PALV may not have time to equilibrate; hence, the change in PMOUTH may potentially underestimate the changes in PALV in the presence of airways obstruction and overestimate total TGV.
Pressure-volume changes are limited to the volume of gas within the thorax
Another assumption of body plethysmography is that changes in body volume during respiratory efforts against the occlusion are essentially only those of TGV and that abdominal gas is negligible. Guidelines therefore recommend avoiding consumption of fizzy drinks prior to plethysmographic measurements, since increased abdominal gas and/or pressure swings could be a potential source of error.71 Significantly, plethysmographic FRC measures all the volume in the lungs at the end of expiration (TGV) including any gas trapped behind closed airways. This contrasts with gas washout or dilution techniques (eg, nitrogen washout), which rely on gas mixing and only measure communicating ventilated areas of the lungs and not gas trapped in poorly or non-ventilated areas.
Pressure changes applied to the lung are homogeneous within the pleural space
Finally, the principles of body plethysmography are based on the assumption that pressure changes applied to the lung are homogeneous within the pleural space. The significant chest distortion observed in some infants with respiratory disease may be associated with inhomogeneous pleural pressure swings during airway occlusion. Similarly, in the presence of marked ventilation inhomogeneity, ∆PMOUTH may not reflect mean changes in PALV, potentially resulting in either overestimation or underestimation of FRC especially in severe small airways obstruction.
Equipment calibration/verification
Volume, flow and pressure measuring devices within the body plethysmograph should be calibrated daily or more frequently when atmospheric conditions are changeable. The leak time constant should be checked daily according to manufacturer recommendations.
Subject considerations
There may be reasons that a subject will be unable to perform body plethysmography and these could include the following:
Conditions that prevent the subject from entering the plethysmograph cabinet or adequately performing the required manoeuvres.72
Claustrophobia that may be aggravated by entering the plethysmograph cabinet.72
Presence of devices or other conditions, such as continuous intravenous infusions with pumps or other equipment that will not fit into the plethysmograph, that should not be discontinued, or that might interfere with pressure changes (eg, chest tube, transtracheal O2 catheter or ruptured eardrum).72
Continuous oxygen therapy that should not be temporarily discontinued.72
Test performance
The equipment and the subject are prepared for the test figure 9 and the purpose and nature of the test are explained. It is useful to demonstrate the technique to the subject to enable better understanding of what is required of them.

Effect of incorrect panting technique on plethysmograph trace. (A) Gentle, properly performed panting manoeuvre yielding a series of almost superimposed straight lines. (B) Panting with excessive force leading to hysteresis. (C) Grossly excessive panting manoeuvre yielding large, variable, invalid recording. (D) Demonstrates the effects of a leaking box seal.
A noseclip is required for the measurement. Dentures should remain in place as removal may introduce leaks at the mouthpiece. Ideally the subject should be sitting upright with their head in the neutral position while in the plethysmograph. The box door is closed and sufficient time is allowed for thermal equilibration prior to commencement of the test (the appropriate time for equilibration will depend on the particular box being used). A flange-type mouthpiece helps to prevent leaks during the measurements.
For lung volume measurement the subject should be requested to breathe normally on the mouthpiece. If there is excessive ‘looping’ of the trace, the flat of the hands can be placed against the cheeks to reduce their movement while the shutter is closed. However, raising the arms can lead to an alteration of FRC so time should be allowed for the FRC to adjust before proceeding. Prior to initiating the TGV manoeuvre, ensure there are no drift or leaks on the tidal volume trace.
The shutter is then closed at the end of a normal tidal expiration and the subject is asked to pant gently against the shutter at a frequency of approximately one breath per second. The shutter should remain closed for approximately 2–3 s to obtain 2–3 slopes of ΔPMOUTH versus ΔPBOX. Panting frequencies of >1.5 Hz may lead to errors and those <0.5 Hz may cause problems with the controlled leak of the body plethysmograph system; also panting pressures should not exceed ±1 kPa.4 A series of almost superimposed straight lines separated by only a small thermal drift on the ΔPMOUTH versus ΔPBOX plot should be seen. Without removing the mouthpiece the subject then performs an RVC manoeuvre immediately after the shutter is reopened. Some equipment allows these manoeuvres to be recorded prior to the shutter being closed.
This whole procedure should be repeated until a minimum of three technically acceptable measurements have been obtained. The subject may be permitted to remove the mouthpiece and take a short pause between measurements.
It is important that each ΔPMOUTH versus ΔPBOX trace is inspected and the line of best fit adjusted manually if necessary.
The measured TGV is the volume of intrathoracic gas at the time the airway was occluded. If this was not at the true FRC (figure 10), then an appropriate adjustment should be made to obtain the correct FRC (FRCPLETH).

Volume correction must be applied to TGV to determine FRCPLETH. FRC, functional residual capacity measured by whole body plethysmography; TGV, thoracic gas volume.
Repeatability criteria
At least three FRCPLETH values that are technically acceptable and agree within 5% (ie, the difference between the highest and lowest values divided by the mean is ≤5%) should be obtained and the mean value reported. If there is a larger deviation, additional values should be obtained until three values agree within 5% of their mean, and the mean value should be reported.
Quality control
Standard quality control procedures should be sufficient (biological control, volume/flow/pressure calibrations and leak check). However, if more detailed quality control procedures (eg, for research) are required, then a lung volume isothermal simulator, often referred to as an isothermal flask, can be used.68 73
Measurement of lung volumes: nitrogen washout
Measurement principles
At end-tidal expiration the volume of gas in the lungs (FRC) is unknown. It is known that this gas contains approximately 79% nitrogen; by measuring this volume of nitrogen, the FRC can be estimated. In this method the subject breathes 100% oxygen, which washes out the nitrogen from the lungs, and the total volume of nitrogen exhaled is measured (figure 11).

Calculation of functional residual capacity (FRC): breath by breath method.
Equipment
The components of a system comprise a flow transducer (heated wire flow sensor, ultrasonic flow sensor or pneumotachograph), an oxygen supply delivered via a demand valve or a flow bypass/reservoir system, a method of nitrogen analysis and a mouthpiece assembly with valve control.
Commercial systems provide automatic control of the equipment and incorporate calibration and quality control software to ensure the accuracy of lung volume measurements.
Equipment calibration/verification
The calibration of the gas analysers and flow transducer should be checked daily using certified gases and a calibration syringe. A record should be kept highlighting any trends in drift. Gas analysers should also be checked for linearity on a quarterly basis (if the system allows). FRC calibration should be verified daily by using a syringe of known volume (typically 2–3 L). A weekly biological control check should also be made by measuring the FRC in a normal control subject (see ‘Quality assurance’ section).
If using a filter, it is important to deduct the volume of the filter from the FRC measurement. This facility is built into the software of most commercial systems.
Subject considerations
System leaks may occur if the patient has a perforated eardrum (if the Eustachian tube is patent, atmospheric nitrogen could enter the system).
Subjects should not be tested if their supplemental oxygen therapy cannot be discontinued for a period that would allow the air in their lungs to return to ambient conditions.
Breathing 100% oxygen can be dangerous in patients who retain CO2. Since most patients tend to increase tidal breathing while attached to lung function equipment, CO2 retention is not normally a problem. It is important that the equipment provides a continuous reading of end-tidal CO2 throughout the test to check it does not increase.
Patients who are receiving bleomycin are at risk of developing pulmonary toxicity when breathing high concentrations of oxygen. For this reason, it is advised that lung volumes should not be measured using the nitrogen washout test.74
It is important to note that other tests which may be influenced by oxygen breathing (eg, transfer factor, blood gases and so on) should not be performed immediately after measuring FRC. To allow the partial pressure of oxygen (PO2) to return to baseline before proceeding with a further test, at least twice the previous washout duration must have elapsed.75 76
Test performance
As with all lung volume measurements, a flange-type mouthpiece should be used for this procedure to prevent leaks during the course of the measurement.
The purpose and nature of the test are explained. The height of the mouthpiece should be adjusted so that the patient is sitting upright. Both feet should be positioned on the floor directly in front of the seat. The patient should not be able to view the recording during the course of the test as this may influence their breathing pattern. The patient is connected to the mouthpiece with noseclip attached. Once a stable breathing pattern is obtained, the subject is switched into breathing 100% oxygen at the end of a normal tidal expiration.
The subject continues with tidal breathing on 100% oxygen until the concentration of expired nitrogen falls below 1.5% for three consecutive breaths. If this is not achieved within 10 min the test should be terminated and a note made of the final FRC reading, the remaining expired nitrogen concentration and that the end of test criterion was not satisfied.
The time taken for the nitrogen washout test will vary depending on the degree of airflow obstruction present. The duration of the test will be very similar to the helium dilution method.
Once the FRC measurement is complete, a minimum of three acceptable VC measurements should be made by asking the patient to perform a relaxed exhalation to RV, followed by a maximal inspiration to TLC. This is the preferred method in patients with airflow obstruction where marked differences in VC may be observed between IVC and EVC manoeuvres. At least 30 s rest should be allowed between measurements, and repeatability between the best two VC measurements should be within 150 mL (figure 12).77 78
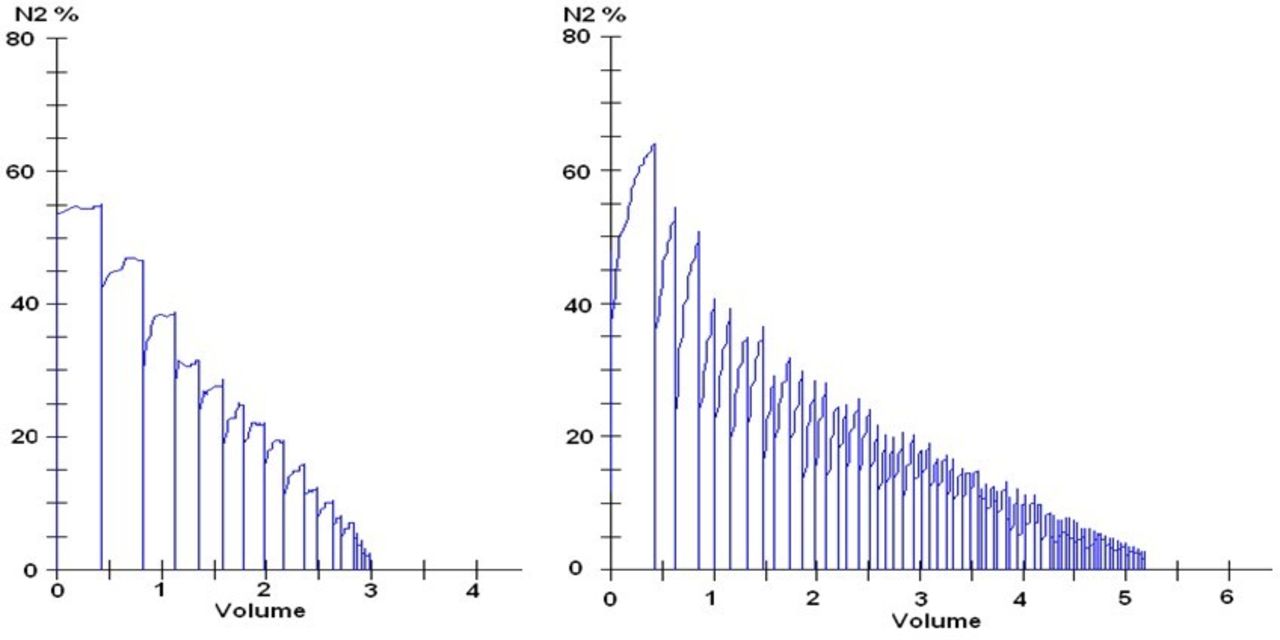
(Left) Normal washout profile. (Right) Abnormal washout profile typical of emphysema.
The time taken for the nitrogen washout test will vary depending on the degree of airflow obstruction present. The duration of the test will be very similar to the helium dilution method.
Repeatability criteria
Traditionally one technically acceptable result has been reported; however, there is little published evidence to support this as best practice and caution should therefore be used in the interpretation of a single FRC N2 measurement.4 ERS/ATS guidelines recommend performing three measurements.76 The time between measurements must be at least twice the length of time of the previous test to allow alveolar gas concentrations to return to normal. Repeatability between technically acceptable measurements should be within 10% and the average value quoted.
Quality control
It is important that a true FRC is measured, so care must be taken to ensure the switch to breathing 100% oxygen occurs at the end of a tidal breath during a period of stable tidal breathing. Most computerised systems will automatically adjust the FRC for small switch-in errors of less than 500 mL.
As the exhaled nitrogen is being analysed at the mouthpiece on a breath-by-breath basis, the exhaled nitrogen profile will instantly display a spike should any leak occur at the mouthpiece or via the nose (figure 13). The test should then be discontinued and not repeated until twice the duration of the failed test has elapsed. System leaks occur most frequently as a consequence of the lips not being tightly sealed around the mouthpiece or a poorly fitting noseclip.

Nitrogen washout profile demonstrating a leak.
Measurement of lung volumes: helium dilution
Measurement principle
Multiple breath gas dilution measurements of static lung volumes are based on the principle that helium (being used as a physiologically inert tracer gas) of known concentration contained in a spirometer of known volume will be diluted by alveolar gas when the subject is switched into the system and a closed spirometer circuit is maintained (figure 14). A circulating pump within the spirometer maintains an even distribution of the test gases and the volume of the circuit is kept constant by absorbing the CO2 that the subject produces during the measurements and replenishing the O2 taken up. After a few minutes of tidal breathing, the tracer gas should be evenly distributed throughout the subject’s lungs, and a second, lower tracer gas concentration will be established, hence allowing the calculation of the FRC.

Calculation of FRC: helium (He) dilution method. Closed circuit for He equilibration and calculation of thoracic gas volume and FRCHe. System volume includes spirometer and all tubing and so on, up to the valve in the mouth, and is filled initially with 10% He. Because of CO2 absorption and O2 consumption, spirometric trace has rising baseline, made horizontal by continuous O2 addition. Time course of He equilibration and in normal and in patient with chronic obstructive pulmonary disease (COPD) shown. Reproduced from Hughes, ‘Physiology and Practice of Pulmonary Function’, published by the Association for Respiratory Technology & Physiology. FRC, functional residual capacity; IC, inspiratory capacity; TLC, total lung capacity.
Helium (He) is traditionally chosen as the tracer gas in multiple breath gas dilution methods as it is easily measurable in low concentrations with the degree of accuracy required and the analysers require little maintenance.
To calculate the unknown value (FRC), the following equation can be used:
FRC=V1 × ((He1 − He2)/He2)
where V1=circuit vol, He1=initial helium concentration and He2=final helium concentration.
All measurements are made at ambient temperature, pressure and saturated with water vapour. The appropriate correction factor must be applied to allow values to be reported at BTPS. If the equipment used does not have a built-in thermometer and barometer to automatically correct for room temperature and PBOX, then these variables should be entered into the software prior to testing.
Equipment
For this steady-state method the basic components of a closed circuit include a spirometer (eg, a rolling-seal spirometer), a circulating pump, helium analyser, O2 source and CO2 absorber. An O2 analyser is desirable, but not essential. Most equipment are now fully computerised, but the test conditions should be easily configurable by the operator. Optimum equipment characteristics are shown in the ‘Equipment specifications: helium dilution’ section).
Quality control
The volume calibration of the spirometer should be checked daily and its linearity weekly. The helium analyser should be calibrated daily, and should be checked for linearity on a quarterly basis with different gas mixtures within the usual measurement range. Alternatively, the change in helium concentrations can be recorded when a known volume of air is introduced into the circuit from a calibration syringe. The volume of air added can be calculated from the helium dilution using the FRC equation (see ‘Measurement principles’ section) and compared with the actual volume introduced, although care should be taken with applying the correct volume correction factor if calculated using the manufacturer’s software.
Tubing should be checked regularly for leaks and the CO2 absorber replenished as soon as signs of colour change are observed (CO2 absorber mediums usually have a colour indicator that changes colour when the absorber is depleted). Manufacturers usually suggest changing the absorber after a predetermined number of tests. All other cleaning and maintenance should be carried out on a regular basis as recommended by the equipment manufacturer.
Measurement procedure
The closed circuit is prepared according to the manufacturer’s instructions with the appropriate volume, which is a mixture of air, oxygen and helium (typically using a cylinder of premixed gas containing 14% helium, 18% O2, balance air). This represents volume V1 and comprised the dead space of the equipment and the total volume of gas in the circuit. The gases are mixed within the circuit by the circulating pump, and the helium concentration should be recorded once the circuit has been allowed to stabilise (He1).
The subject, wearing a noseclip, should be given adequate time for their breathing to adapt to the mouthpiece before the measurement of FRC begins. They should then be switched into the system at the end of a normal tidal exhalation. The subject should continue to breathe tidally through the mouthpiece throughout the test. Ideally the patient should not be able to see the chart trace or the computer screen during measurements as this can influence their breathing pattern. The volume of the circuit is maintained by either manual or automatic addition of O2 as it is consumed and also to replace the CO2 which has been absorbed (figure 14).
The helium concentration should be observed throughout the test and equilibrium will be considered to have been reached when the helium concentration varies by ±0.02% (if absolute values are displayed) or FRC varies by ±0.025 L (if FRC is displayed) over a 30 s period.4 This is the He2 value, which is required for the subsequent calculation of FRC. If the readings have not stabilised after 10 min have elapsed, then the readings should be noted at this point and the fact that a stable reading has not been achieved should be recorded.
Once a stable FRC (or helium) reading has been established (or after 10 min if no stable readings have been achieved), the subject should be asked to perform a relaxed ERV manoeuvre, followed by an IC manoeuvre and then a VC manoeuvre. In patients with significant airflow obstruction, sufficient time should be allowed for the patient to return to FRC in between manoeuvres to negate the effects of air trapping. The highest technically acceptable values for ERV, IC and VC should be used for subsequent calculations. Depending on the equipment (and software) used, the VC, IC and ERV manoeuvres may be performed at the start of the test or at the end after a stable FRC has been established. Measurements made after the determination of FRC are of greater physiological relevance. Up to three measurements of ERV may be performed, with the mean of all technically acceptable ERV manoeuvres used in subsequent calculations.79
Repeatability criteria
Evidence suggests that the intertest variability is so small that only one test needs to be performed; however, more attempts will improve accuracy.79 If a second measurement of FRC is to be made, there should be an interval equivalent to the duration of the first measurement (or 10 min, if no stable FRC was obtained) before the second measurement begins. The value quoted for FRC should be a mean of the two values, assuming that there is no significant difference (ie, <0.2 L between the values). Repeatability between technically acceptable measurements should be within 10% and the average value quoted. The highest values for ERV and IC from the two measurements should be used to calculate the subdivisions of lung volume.
Equipment specifications: helium dilution
Spirometer
The spirometer is capable of recording volumes ≥8 L with an accuracy of ±3.0%. If a flow transducer is used for the measurements, then this needs to be calibrated using gas of identical composition to that used during testing to compensate for changes in gas density.
The equipment volume should be kept as low as possible as this will increase the accuracy of the measurements. With no gas in the spirometer the volume of the equipment (including valves, analysers and breathing tubes) should ideally be <4.5 L.4 The volume of the patient’s mouthpiece and any disposable bacterial/viral filter should also be kept as low as possible (ideally <0.1 L).
Helium analyser
Most equipment use thermal conductivity (katharometer) helium analysers, but other types of analysers can be used,80 as long as they have a fast response time (<15 s to respond to a 2% change in helium concentration) and a resolution <0.01% over the 5%–15% range of helium. There should be very little drift, with the value for helium concentration changing by <0.02% in 10 min in a closed circuit.
The circulating pump in the circuit should be capable of delivering flows of 50–60 L/min.
Gas conditioning agents (ie, desiccators and CO2 absorbers) should be easily accessible and should be of a colour changing type, which will make it easy to identify when they are in need of replacement. Replacement of gas conditioning agents after a fixed period of patient testing is a suitable alternative strategy, but depends on adequate laboratory records being maintained.
Potential sources of error
The main sources of measurement error when measuring lung volumes by helium dilution are subject error or technical error. With the exception of switch-in errors (see Technical errors below), the most common problem encountered during measurement is leak. The definition of what constitutes a leak has never been published, but should be considered when the volume of oxygen added to the spirometer circuit exceeds the expected metabolic requirements (typically 0.20–0.25 L/min or 0.04 L/kg/min) or when the system is not maintained at the turn in volume. A leak should also be suspected when current results for FRC are significantly different from previous values for the same subject (even if stability criteria have been met), especially if there is no apparent change in the subject’s clinical condition.
Technical errors
The most common source of error is that the subject is not switched into the circuit at their true FRC, either because they were turned in too early or too late; however, most modern systems will automatically switch the subject in at the appropriate point in the breathing cycle. Small differences in volume (~50 mL) can be discounted as being of limited clinical significance, but larger differences (>500 mL) should result in the test being abandoned and then restarted after the equipment has been checked for leaks and reset. For differences between 50 mL and 500 mL, the subject should be maintained at the switch-in volume and the difference subtracted (or added) to the measured FRC after the test is completed.
Equipment leaks can occur almost anywhere in the system, but the most likely places are in breathing tubes and around absorbers. Breathing tubes can be checked for leaks by plugging both ends of the tube securely to ensure an airtight fit and immersing the tubes fully in a container of water and watching for bubbles. Any tubes showing signs of leaks should be discarded immediately.
Leak checks of the system (as described by the equipment manufacturer) should always be carried out after absorbers have been changed, as these are frequently a source of leaks. Removal and reinsertion of the absorbers often solves the problem.
Subject error
Leaks are most common around the mouthpiece or due to loose-fitting noseclips. A wider flanged mouthpiece and tight-fitting noseclips will minimise leaks. If a subject has perforated eardrums (and this should always be suspected if a leak occurs), using disposable gas impermeable earplugs should prevent this problem. Close observation and regular reminders to keep a tight seal against the mouthpiece will help to reduce the incidence of subject leaks.
Measurement of carbon monoxide transfer factor
Introduction
The primary function of the lungs is to exchange gas between the atmosphere and the pulmonary circulation. The ability of the lungs to exchange gas across the alveolar capillary membrane is determined by its structural and functional characteristics. Structurally these include lung volume, path length, membrane thickness, the surface area of the lungs and the capillary blood volume. Functionally it is influenced by the level of ventilation and perfusion of the lung and its matching, haemoglobin (Hb) levels, blood transit time, the alveolar capillary membrane characteristics and the chemical reaction rate with Hb (θ). In the lung function laboratory, CO is used as a surrogate for oxygen. CO is an ideal test gas because it has the same diffusion coefficient and rate of reaction with Hb as oxygen, binds to the same site on the Hb molecule, and their respective Hb dissociation curves are affected in the same way by temperature, O2, CO2, pH and 2–3 diphosphoglycerate (DPG). In addition, its high affinity for Hb (210 times that of oxygen) means that the PO2 remaining in the physiological state does not influence the measurement. Additionally, CO is safe to breathe at low concentrations and easy to measure by infrared/electrochemical analysis.
The Roughton and Forster equation from 195781 partitions alveolar-capillary diffusion of oxygen and CO into a membrane component (Dm), a red cell component (θ) and a capillary blood volume component (Vc).
Equation 1, the Roughton and Forster equation:
1/Tl=1/Dm+1/θ.Vc
where Tl is the transfer factor, Dm is the membrane diffusing capacity, θ is the rate of reaction of CO with Hb, and Vc is the capillary blood volume in contact with the inhaled CO.
Although there is more than one technique for measuring CO uptake (and it is acknowledged that other techniques have been tried), this section will describe the single-breath technique, which is the most widely adopted and the one for which regression equations are readily available.
Definitions
TLco: transfer factor, the product of Kco and VA.
Kco: transfer coefficient, the rate of transfer of gas between the alveoli and the erythrocytes into the alveolar capillaries.
VA: alveolar volume, the volume of the lungs during the measurement of gas transfer.
VIN: volume inspired, the volume of test gas inhaled during the measurement of gas transfer.
Dm: the diffusing membrane capacity.
Vc: the pulmonary capillary blood volume.
θ: theta, the chemical reaction rate of CO with Hb.
Measurement principles
Gas transfer is governed by Fick’s law of diffusion, which states that ‘the rate of transfer of a gas through a membrane of constant thickness is proportional to its surface area (A) and the difference in gas partial pressure between the two sides (P1−P2), and inversely proportional to the membrane thickness (t)’. Consequently, TLco is the product of the rate of CO uptake (Kco) and the alveolar volume (VA) (see equation 2).
Equation 2, Fick’s law of diffusion:
dV/dt=A/T×D×(P1−P2)
Volume of gas (per unit time)=area/thickness × diffusion constant × (partial pressure 1 – partial pressure 2).
CO uptake is measured as a concentration fall in alveolar CO per unit time per unit driving pressure. Alveolar volume is determined by the dilution of a tracer gas in the RV and the volume of gas inspired (VIN). Analysis of Kco and VA individually provides information on disease pathology that would not be identified by the use of TLco alone.
The SI units of transfer factor are mmol/min/kPa and represent the uptake of a gas (mmol/min) per unit pressure gradient (kPa). The SI unit of transfer coefficient (Kco) is mmol/min/kPa/L. The ATS continues to prefer traditional units of mL/min/mm Hg. To convert from SI to traditional units, divide by 0.335. To convert from traditional units to SI, divide by 2.987.
Single-breath technique
Equipment specifications
The ERS/ATS technical standards7 provide detailed information with regard to the required equipment specifications for gas transfer measurement devices. Table 5 summarises this information and details the minimum equipment specification by system with discrete sample system referring to the traditional method of measuring exhaled sample gas rather than the more modern rapid gas analysis method.
Gas transfer equipment specification by sampling method
Calibration and verification
Volume/flow calibration must be undertaken daily with a 3 L syringe across varying flow rates, as per spirometry recommendations. Gas analysers should also be calibrated daily using medically certified gases and the analyser should be zeroed prior to each test.
Quality control
As detailed in the equations for calculating TLco, the ratios of inspired and expired gas concentrations are paramount in the determination of gas exchange. It is therefore essential that the gas analysers used are linear throughout their working range. Linearity assessments should be undertaken monthly; however, it is recognised that modern systems do not readily enable users to test analyser linearity, and there is a call from the ERS/ATS7 to further evaluate the use of calibration syringes to dilute test gas.
Weekly physical and biological control of TLco systems should be undertaken. For physical control a TLco test should be undertaken using a 3 L syringe in patient test mode and according to the manufacturer’s instructions. Biological control should be undertaken using a ‘normal’, healthy, non-smoking subject. Variability in mean TLco should not vary by more than 10%, and errors greater than 10% should result in equipment being evaluated prior to further clinical use.82
Test gas composition
The test gas mixture will consist of CO, O2, N2 and the tracer gas. The most commonly used tracer gases are helium (traditional systems) and methane (rapid gas analysis systems). All test gases must be certified as being suitable for medical use, and the certificate, gas concentrations and gas expiry date must all be visible on the cylinder while it is in use.
Test gas composition can alter the measured transfer factor, and therefore it is important to standardise the concentration used. PAO2 levels influence CO uptake, and therefore altering the oxygen concentration in the inspired test gas will have an impact on the measured transfer factor. For example increasing the fraction of inspired oxygen (FiO2) concentration in the test gas from 0.17 to 0.21 will decrease the measured TLco by between 8% and 9%.83 It is important to recognise this effect and to identify, where possible, the inspired oxygen concentrations used to develop the regression equations applied and how they may differ. The recent 2017 ERS guideline7 recommends 21% oxygen be used in the inspired gas mix.
Procedure
Test considerations
For pretest considerations see the ‘General procedures’ section. An additional requirement is to remove supplemental oxygen from patients for a minimum of 10 min prior to performing the test, when safe to do so, to maintain appropriate oxygen saturation (SpO2) levels. Measurements of lung volumes using the nitrogen washout technique should be undertaken after measurements of gas transfer as this requires inspiration of 100% O2. If this is not possible then then a rest interval of twice the washout time required to complete the N2 washout test is required prior to performing gas transfer measurements to ensure complete washout of oxygen.7
Correct performance
The correct performance of gas transfer measurements requires the subject to exhale maximally (unforced) to RV then inspire maximally to TLC and hold their breath for approximately 10 s. This is followed by a complete exhalation. The importance of each of these steps is outlined in the following sections.
Inspiration
It is important that subjects familiarise themselves with the equipment prior to commencement of the measurement. Therefore they should be encouraged to breathe tidally, while wearing a noseclip, through the mouthpiece for a minimum of five breaths or until normal, steady breathing is noted. Once stable the subject is asked to exhale to RV.
Once at RV, the patient is connected to the test gas mixture and requested to inhale as far as possible. This inhalation should be to at least 90% of the subject’s previously best measured VC.
The influence of lung volume on gas transfer is widely known, with decreases in lung volume resulting in an underestimation of TLco and an overestimation of Kco because the surface to volume ratio for CO increases as alveoli become smaller (figure 15) . TLco falls because VA falls more than Kco rises. At lung volumes of greater than 90% of the subject’s VC, both TLco and Kco have reached an approximate plateau and therefore further increases will have little effect on the estimate. Evidence suggesting that lowering the VIN to 85% influences measured TLco by less than 5% should be reviewed with caution due to the limited number of participants.84 It would be acceptable to suggest that if technically satisfactory tests were obtained but a VIN of 90% was not achieved, data from tests where a VIN of 85% or more was achieved could be analysed; however, the individual reporting the results should be aware of the reduced inspired volume and its potential impact on results.85

Effects of lung volume on both the TLco and the Kco from residual volume to TLC.175 Kco, gas transfer coefficient for carbon monoxide; RV, residual volume; TLC, total lung capacity; TLco, carbon monoxide transfer factor.
In addition to the inspired volume requirements specified above, the inhalation should be rapid and ideally achieved within 2 s in normal subjects; however, 85% of VIN must be inspired in <4.0 s.7
Breath hold
The breath hold time should be set at 10±2 s.85 It is important that the subject relaxes during breath holding and should be encouraged to not breathe out (Valsalva) or breathe in (Müller), as this will alter the intrathoracic pressure and the pulmonary haemodynamics, resulting in either an increase (breathing in) or decrease (breathing out) in TLco.
The breath hold time calculation method by Jones and Meade is the recommended method. With this method breath hold time is calculated from 0.3 of the inspiratory time until halfway through the sample.83
The Ogilvie breath hold method tends to overestimate TLco when airflow obstruction is present. This is due to the increased time it takes to obtain an alveolar sample in airflow obstruction and that the Ogilvie method terminates at the beginning of the alveolar sampling period. In contrast the Jones-Meade method includes a proportion of the alveolar sample time and consequently offers the least overestimation of TLco in the presence of airflow obstruction.
Washout and sample collection
During exhalation, following breath hold, the initial portion is discarded (washout) since this contains gas from the anatomical and instrument dead space.
Systems using a sample collection technique require the volume of washout to be set in advance, usually between 750 and 1000 mL.83 In patients with small VC this value can be reduced to allow sufficient sample volume; however, it must be recognised that this will inevitably lead to some contamination of sample gas with dead space gas, ultimately reducing the measured transfer factor.
After the dead space gas has been discarded, a sample representative of alveolar gas is analysed. This sample volume is typically between 500 and 1000 mL and will depend on the response time of the system’s gas analysers. With traditional systems this means that subjects with small VC may require adjustments to the washout and sample volumes in order to achieve a result. Where settings for washout and/or sample volume are reduced, this should be clearly documented to allow the individual interpreting the results to acknowledge the potential impact on measured values.
Modern rapid gas analysis systems allow the operator to inspect the continuous exhaled gas concentration curves and more accurately identify the end of dead space washout. Huang and Macintyre86 found that 50% of patients tested had dead space contaminate the sample using the ATS/ERS criteria (arbitrary 750–1000 mL) when compared with visual analysis of exhaled gas concentration; this leads to a falsely low TLco measurement. It is therefore vital with these systems to inspect the exhaled gas waveforms to ensure that the sample is taken from the alveolar plateau, that is, the initial fall in exhaled tracer gas concentration from inspired values to the plateaus at expired values. Rapid gas analysis systems enable the operator to identify more accurately the end of washout enabling true alveolar gas concentrations to be obtained in patients with much smaller VC and in those with increased dead space.
Time between manoeuvres
Since the previous ARTP/British Thoracic Society guidelines1 were published in 1994, there has been little if any new evidence with regard to the time required to wait in between tests. An interval is required to allow adequate time for tracer gas to be eliminated from the lungs and prevent interference with subsequent tests. In the absence of new evidence the recommendation to allow at least 4 min between tests remains. It should be recognised that patients with severe airflow obstruction may require longer time intervals to completely remove tracer gas from their lungs. Failure to achieve reproducible results in this patient group may indicate this. With newer rapid gas analysis systems, by sampling expired CO prior to the test sample inhalation, it is possible to determine the CO baseline so that time between tests can be minimal (<2 min).
End of test criteria
A minimum of two technically acceptable gas transfer manoeuvres should be performed with a maximum of five (see figure 16 for illustration of a technically acceptable trace). Five gas transfer manoeuvres will increase carboxyhaemoglobin (COHb) by approximately 3.5%, which will ultimately decrease measured transfer factor by 3.5%.87 TLco results should be within the repeatability criterion of 0.67 mmol/min/kPa, Kco within 0.10 mmol/min/kPa/L and alveolar volume within 5%.88 89 The mean of two technically acceptable manoeuvres should be reported.
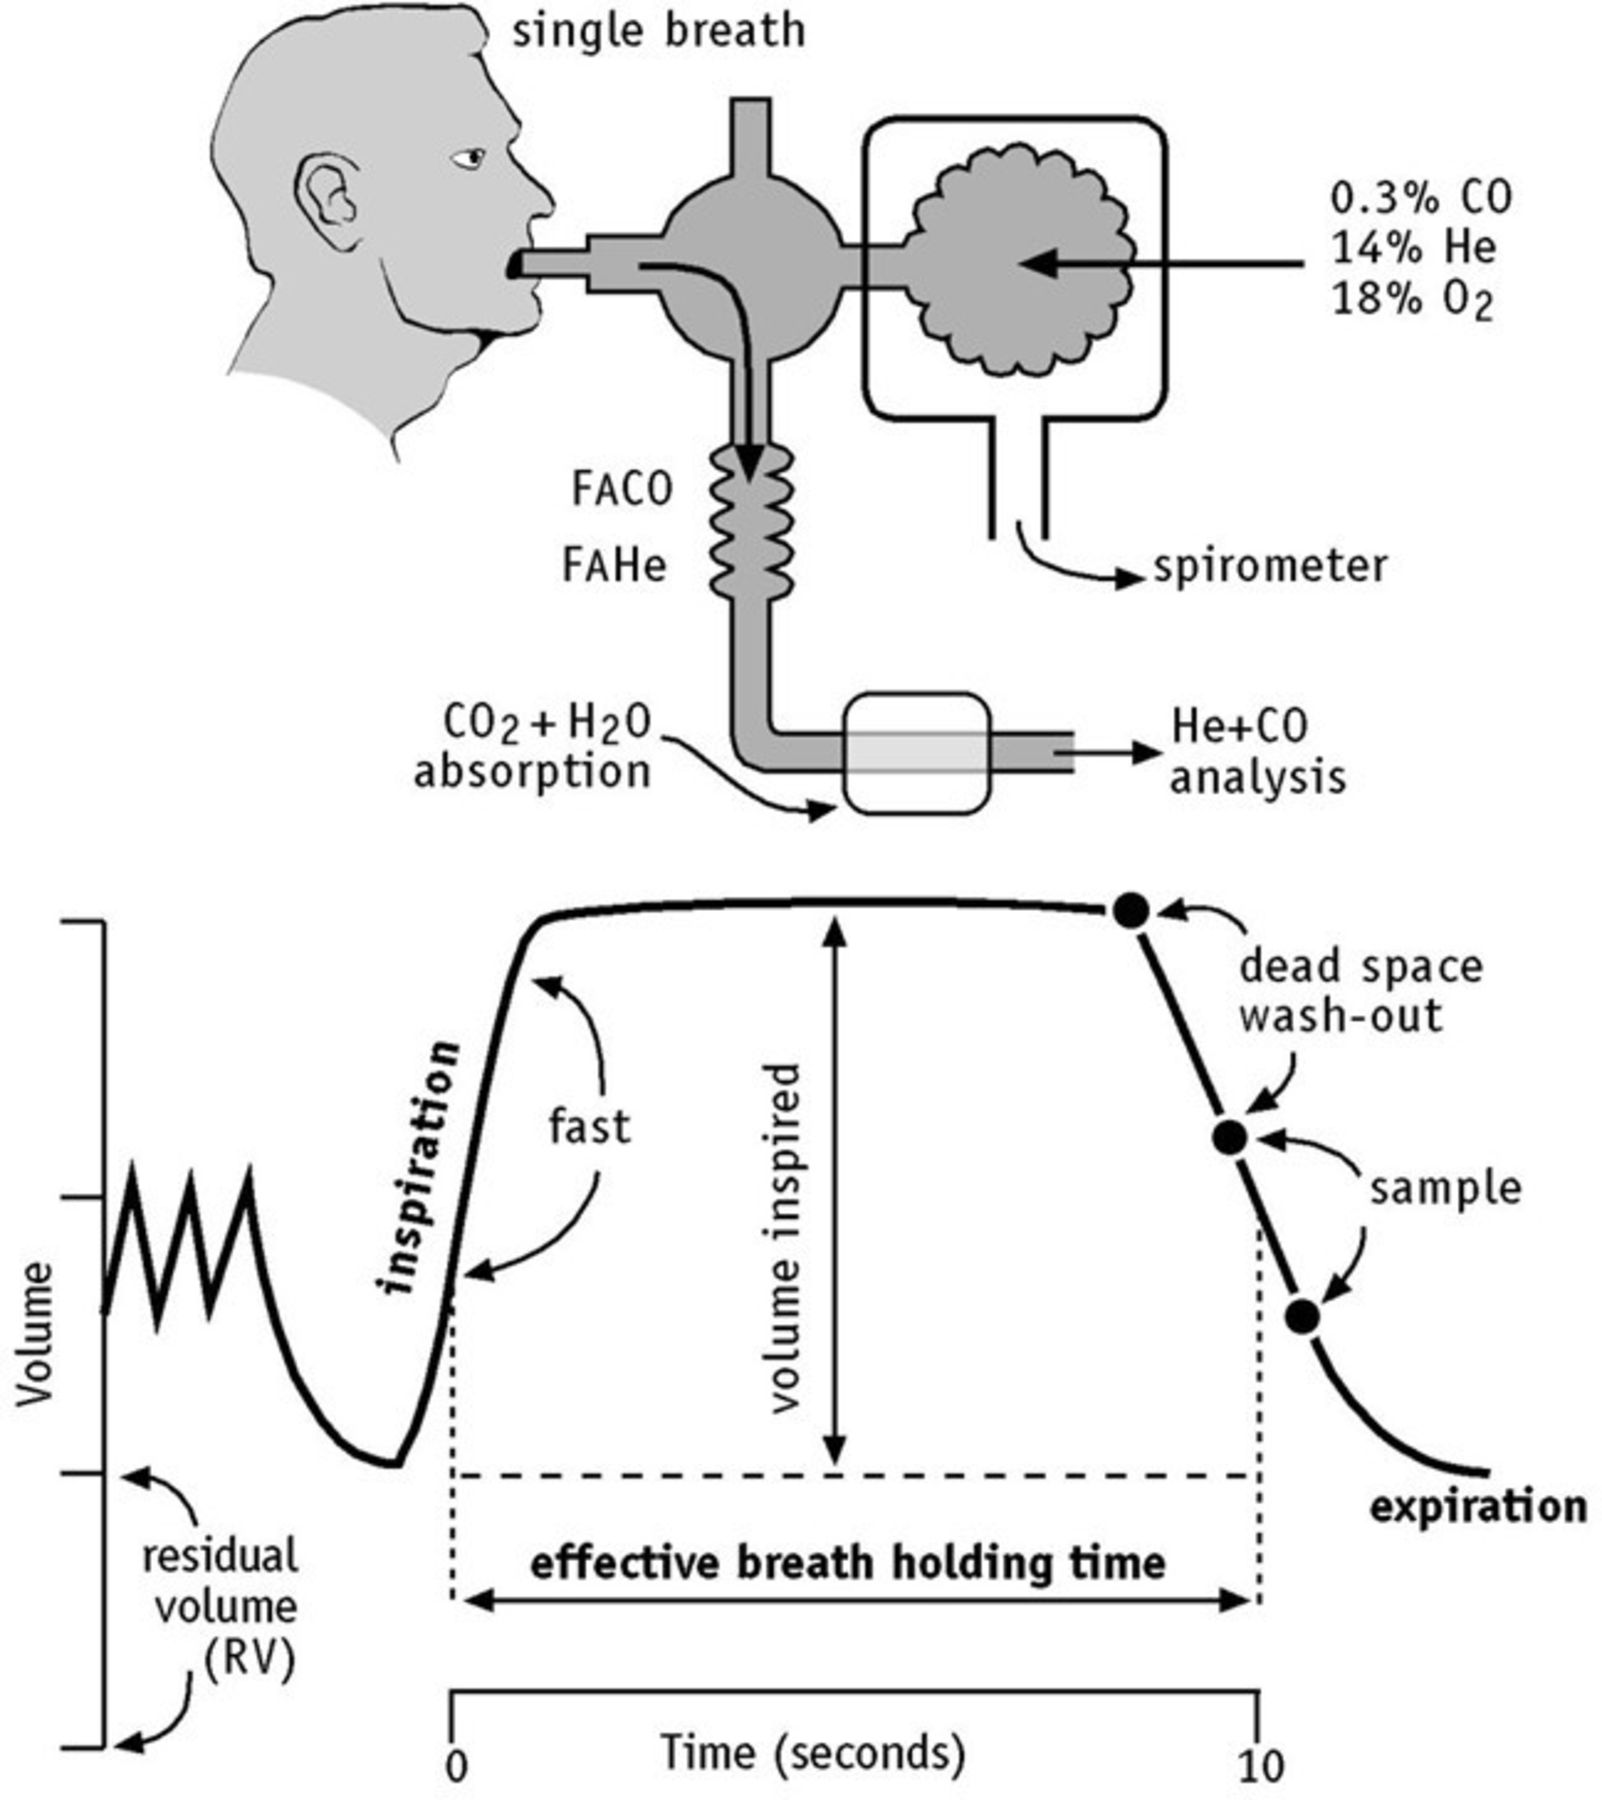
A technically acceptable TLco trace. Reproduced from Hughes, ‘Physiology and Practice of Pulmonary Function’, published by the Association for Respiratory Technology & Physiology. TLco, carbon monoxide transfer factor. FACO, Fraction of Carbon Monoxide in Alveolar Gas. FAHE, Fraction of Helium in Alveolar Gas.
Calculations
The transfer factor for carbon monoxide (TLco) equals the rate of uptake of CO (changeCO/changet) from alveolar gas multiplied by the alveolar volume (VA) at which the measurement is made. During the measurement of gas transfer, subjects are requested to exhale to RV then take a maximal breath in (VIN) during which they inhale the test gas. As the tracer gas does not readily pass across the alveolar capillary membrane, the dilution of tracer gas is proportional to the volume of gas in the lungs prior to inhalation (RV).
Alveolar volume can therefore be estimated by the following equation:
Equation 3, calculating alveolar volume (VA):

VA is reported as BTPS and is converted to standard temperature (0°C or 273 K) and pressure (760 mm Hg) and dry (no water vapor) (STPD) for the purpose of calculating TLco (see equation 4), FICH4 is the initial tracer gas concentration and FACH4 the final tracer gas concentration. VD is the dead space of the measuring system.
In the 1994 guidelines1 an alternative calculation for VA was proposed as VA=RV+VIN. This was suggested as an alternative and more accurate estimate of VA in patients where large differences between VA and TLC were observed due to maldistribution of inspired gas. However the TLco equation is based on the volume of gas that the tracer gas distributes into and not necessarily the TLC. It cannot be presumed that the Dm and Vc properties of the unmeasured lung regions are identical to those directly measured regions, and for this reason the use of VA calculated in this way is no longer advocated. For quality assurance purposes the measured VA should be compared with the subject’s measured TLC and should always be less. Large discrepancies between the two (>500 mL) are suggestive of maldistribution of inspired gas.
Equation 4, calculating gas transfer (TLco):
The following equation demonstrates how transfer factor is determined from VA and Kco.


To obtain TLco both sides are divided by Pb* (barometric pressure less water vapour pressure at 37°C in alveolar gas).
Equation 5:

units mL (STPD)×min/mm Hg=mL/min/mm Hg
During breath holding, CO is removed from alveolar gas at an exponential rate [loge (CO0/COt)/BHT], where CO0 and Cot are the alveolar concentrations at the start and finish of the breath holding time (BHT).
Equation 6:

The test assumes that both CO and the tracer gas are diluted equally on inspiration, and therefore the concentration of CO in the alveoli (CO0) can be calculated by the ratio of the inspired tracer gas (Tr1) and the alveolar tracer gas (Tr2) concentrations.
Equation 7:

where FICO is the inspired concentration of CO and FACO is the fractional concentration of CO in the alveoli prior to breath holding.
Equation 8:
The equation for TLco now becomes:

Equation 9:
If VA is converted to STPD conditions and SI units (mmol/min/kPa), the equation becomes:

where 60 000 arises from the conversion of seconds to minutes and litres to millilitres, and 22.4 from the conversion of millilitres (STPD) to mmol.
Equation 10, calculation of Kco:
As demonstrated in equation 6, the calculation of Kco is determined from the logarithmic change in CO concentration during breath hold divided by t and the Pb of dry gas.

units mol/min/kPa/L(BTPS).
Correction for Hb concentration
As part of the Pathology Harmonisation Initiative in 2012, the units of measurement for Hb were standardised to g/L.90 If a subject’s Hb is >190 g/L or <117 g/L, then the adjusted transfer factor will be 10% lower or higher respectively than that recorded. It is desirable that measurements of TLco be reported at a standard Hb of 146 g/L for adult men and adolescents and 134 g/L in adult women and children <15 years.91 92
The following is the equation for adult men and adolescents:

The following is the equation for adult women and children <15 years:
TLco,ad=TLco,ob [(9.38+Hb)/(1.7*Hb)]

where TLco,ad and TLco,ob are the adjusted and observed TLco, respectively, and Hb is the patient’s measured Hb concentration. It should be noted that these equations were developed using Hb in g/dL and therefore Hb values in g/L will need to be adjusted to g/dL (Hb g/dL=Hb g/L/10) prior to putting them into the equation. If a correction for Hb concentration has been made, then this should be made clear on the report form.
Correction for CO concentration
CO inhalation from pollution or cigarette smoking forms COHb, which will influence measured transfer factor values. First, by occupying Hb binding sites, it produces an ‘anaemia effect’, lowering the measured gas transfer value. Second, increased partial pressure of CO in the blood will reduce the driving pressure for CO diffusion between the alveoli and the capillary blood. The impact on measured TLco is a 1%–2% reduction for every 1% increase in COHb.16 17 As endogenous COHb (1%–2%) would have contributed to the measured TLco values used to generate predicted equations, adjustment for COHb is only recommended when COHb values are greater than 2%.
Correction for CO:

Transfer factor for nitric oxide
The transfer factor of the lung for nitric oxide (Tlno) is potentially of interest. However, at present this technique is not used in routine respiratory assessments. Despite a number of clinical papers suggesting its usefulness, there is further work needed.
Blood gas analysis
Introduction
Blood gas sampling and analysis play a vital role in the diagnosis of clinical problems and monitoring of possible treatment modalities such as supplemental oxygen (O2) or assisted ventilation.
Blood gas analysis can measure several indices, which can aid diagnosis when interpreted in relation to the clinical state of the patient. Blood gases reflect the ability of the cardiopulmonary system to maintain the relationship between cellular respiration and supply of O2 and elimination of carbon dioxide (CO2) via the lungs.
Nomenclature
This nomenclature was taken from Rowe and Arrowsmith93 (A, alveolar; a, arterial; Fi, inspired fraction; P, partial pressure exerted; S, saturation).
Directly measured
PaO2: measured using a polarographic (Clark) electrode. Hb is the major carrier of O2, each molecule binding four molecules of O2. A small amount of O2 is dissolved in blood, but it is this fraction that diffuses through capillaries to supply tissues. PaO2 is the partial pressure of undissolved oxygen, which is in equilibrium with dissolved oxygen.
PaCO2 : measured using a Severinghaus electrode. CO2 is carried as bicarbonate (60%), with proteins (30%) and dissolved (10%).94
pH: measured using a pH electrode. pH=−log10 ([H+]): the negative logarithm of [H+]. pH falls as [H+] rises. pH 7.0 corresponds to [H+] 100 nmol/L. A change of one pH unit represents a tenfold change in [H+].
Derived
Actual HCO3: the actual amount of bicarbonate contained in a sample. Plasma is equilibrated with partial pressure of carbon dioxide (PCO2) 5.3 kPa (40 mm Hg) at 20°C and actual HCO3− calculated from the volume of CO2 evolved when acid (HCl) is added to the sample.
Standard HCO3−: this is the concentration of bicarbonate when the sample is equilibrated with PCO2 5.3 kPa (40 mm Hg) at 37°C, and with Hb fully saturated with O2. The effects of respiratory acidosis/alkalosis are eliminated.
Base excess: the quantity of strong acid (or base) required to titrate 1 L of blood back to pH 7.4 at PCO2 5.3 kPa (40 mm Hg) and 37°C.
FiO2: the fraction of oxygen in inspired gas especially that supplied as supplemental oxygen via a mask or nasal cannula. The alveolar gas equation can be used to predict the greatest partial pressure of oxygen in alveoli (PAO2) that can be achieved for a given FiO2. In normal, the difference between PAO2 and PaO2 is usually small (<1 kPa/7 mm Hg). The FiO2 must be known to assess the adequacy of oxygenation.

The alveolar gas equation: assuming barometric pressure (PB)=101 kPa; saturated water vapour pressure (PH20) at 37°C=6.3 kPa; alveolar CO2 (PACO2)=5.2 kPa; respiratory quotient (RQ)=0.8.
SaO2: the percentage of haemoglobin saturated with oxygen (oxyhaemoglobin), that is, oxygen saturation.
Acid-base balance
Acid-base balance is tightly regulated by the respiratory system and renal system to maintain a pH between 7.36 and 7.42. The relationship between PaCO2/acid [H+] and bicarbonate/base [HCO3] is shown in figure 17.

Acid-base nomogram.175 PCO2, partial pressure of carbon dioxide.
Blood gas normal ranges
Table 6 shows the blood gas reference values.
Blood gas reference values
Measurement of arterial blood gases
National and international guidelines recommend accurate and reliable measurement of arterial blood gases (ABGs) that must comply with specific criteria for the prescription of long-term oxygen therapy (LTOT).36 95–97 The ‘gold standard’ technique for blood gas analysis is arterial blood obtained via an indwelling arterial catheter (most often sited at the radial artery in adults) or by arterial puncture.
By nature of the complexity and invasiveness of arterial catheterisation, this method is usually reserved for the intensive care setting where patients may require frequent blood gas testing. Technical and safety considerations determine that for most patients who require blood gas analysis, placement of an arterial catheter is either not justified or only for a limited period (such as serial measurements during cardiopulmonary exercise testing).
Arterial blood is most often sampled by arterial puncture using a needle and syringe. Although traditionally performed by medical staff, arterial sampling is now often practised by senior healthcare scientists who have met the acceptable competency standards required by local policy. Importantly periodic re-evaluation relative to common precautions, correct syringe preparation, site determination, puncture technique, sample aspiration, storage and disposal of blood specimens, as well as postpuncture care should be performed.98
Equipment
There are now many commercially available arterial blood sampling kits available. The sampling kit used in any one centre should have been determined based on the current understanding of preanalytic phase considerations, which include needle size, anticoagulation type, sample collection, handling and transportation, since these factors account for up to 70% of all errors in the process of collecting and processing a blood sample.99 100
The use of plastic syringes is considered the norm for blood collection so an awareness for the potential for error in PO2 measurement due to permeability should be minimised by maintaining the sample at room temperature (rather than an ice/water bath) since lowering the temperature has a deleterious effect of increasing permeability giving rise to artefactual increase in PO2.101 Every effort should be made to analyse the sample immediately after it has been drawn (or at least within 15 min after sampling) to minimise the in vitro changes in pH, PCO2 and PO2 due to contaminating ambient air. It is also well known that air bubbles erroneously introduced into blood collected in syringes can affect results. This PO2 interference is greater if the air bubble is vigorously mixed with the blood, such as by intense shaking or pneumatic tube transport.102
A separate problem of analysis delay is posed by the fact that blood cells continue to metabolise glucose following collection. This glycolysis is associated with oxygen consumption and carbon dioxide generation. Therefore, reducing the temperature would have a beneficial effect of slowing this process; however, this has a positive effect of increasing PO2 as mentioned in the paragraph above.
Aspiration of a homogeneous whole blood sample into the blood gas analyser requires that the sample be artificially anticoagulated to prevent clotting. Dry (lyophilised) heparin is the anticoagulant most suitable for blood gas testing. Liquid heparin prepared syringes are largely avoided due to its diluting effect lowering PCO2 values. However, due to the cost of preprepared dry (lyophilised) syringes, the practice of liquid prepared syringes still continues in some areas.103 A 2 min programme of slowly inverting and rolling the syringe after the sample is collected to allow for correct homogeneity is recommended. Inadequate or delayed mixing can result in the formation of fibrin and subsequent rejection from blood gas analysers.104 105
Calibration and quality control
Calibration of modern blood gas analysers is automated and should consist of a one-point calibration every 1–2 hours and a 2-point calibration every 4–6 hours. In addition to calibration, it is essential that blood gas analysers undertake quality control measurements. Again most automated blood gas instruments will have internal quality control built into its system. Quality control is vital to identify electrode drift not established by calibration. Routinely, quality control solutions are aqueous buffers equilibrated to a known PO2, PCO2 and pH across a range of physiological reference ranges, including acidaemia, alkalaemia and hyperoxia. A limitation of aqueous buffers is that they do not have the viscous properties of blood. Quality control with tonometered bovine blood is considered the gold standard for assessing analyser accuracy.
Guidelines106 recommend that point-of-care users should participate in an external quality assurance programme in addition to internal QC. These schemes provide an external assurance that blood gas analysers are performing within an expected range. They aim to measure systems for precision and accuracy, using defined standards to supplement internal quality control.
Procedure for radial artery puncture
Allen’s test
The modified Allen’s test should be performed prior to taking an arterial blood sample to determine arterial competency via the ulnar artery in the unlikely event of radial artery thrombosis.
The patient should be instructed to clench their fist tightly.
The operator should then apply occlusive pressure to both the ulnar and radial arteries, to obstruct blood flow to the hand.
While applying the occlusive pressure to both arteries, have the patient relax the hand, and check if the palm and fingers have blanched. If this is not the case not enough pressure has been applied to occlude the arteries.
Release the pressure on the ulnar artery only, to determine whether the test is positive or negative.
A positive test—if the hand flushes within 5–15 s—indicates that ulnar circulation is viable.
A negative test—if the hand does not flush within the same time frame—indicates the ulnar circulation is not viable and arterial sampling of the radial artery should not occur.
Other relative contraindications to performing an arterial sample include inflammation, infection or poor integrity at the selected puncture site and Raynaud’s phenomenon.
Pretest considerations
Previous evidence supports that patient experience could be greatly improved if four areas of consideration were addressed107:
Pain caused during the procedure.
Competence of practitioners performing the test.
Good pretest provision of information.
Concern regarding changes to treatment in the long term.
An undesirable characteristic of arterial sampling is the pain experienced by the patient. The use of a local anaesthetic such as lidocaine proves to be a contentious one with a high degree of anaesthetists advocating its use, but far fewer non-anaesthesia providers using it.108 In a study of 270 subjects it was shown that subcutaneous infiltration of a local anaesthetic before arterial puncture reduced pain by more than 50%.109 The use of topical, local anaesthetic such as Emla cream has shown mixed opinion of effectiveness compared with local injection. Its application is largely non-logistically acceptable due to its time to work of between 40 and 60 min. ABG analysis in most settings is often required in a more timely manner than topical anaesthetic will allow.
The variance reported by patients regarding the care provider’s ability to perform ABG sampling raises the importance of training issues to improve skills and implement best practice at local level. Patients need to be confident in the healthcare professional they see and in the standard of care received.
Robust information concerning the procedure itself must be provided. This may help to reduce anxiety and pain levels experienced by patients and provide more of an association of the clinical procedure with treatment the patient may receive as a result of the procedure.
Health and safety considerations
All blood should be regarded as potentially infective and therefore disposable surgical gloves should be worn when sampling blood. Health and safety issues need to be considered when using needles. In order to prevent needle stick injury, the operator should not resheathe the needle; it should be disposed of in a sharps box immediately after use. If a needle stick injury occurs, the wound should be squeezed to encourage bleeding and washed out thoroughly. The hospital policy for a needle stick injury would need to be followed. Blood samples should also only be taken in designated work areas where it is safe to do so and any blood spillage that occurs should be dealt with according to departmental policy. If a spillage has occurred, access to that area should be restricted until it has been cleaned. Glass capillary tubes should also be disposed of in a sharps bin after analysis of the sample.
Consent
Appropriate information about the procedure including any benefits and risks and what treatment may result as a consequence of the sampling procedure must be conveyed. Prior to blood sampling the patient must be capable of providing voluntary consent.
Sampling procedure
Palpate both radial pulses and select the pulse that is the most prominent. Perform the modified Allen’s test to ensure adequate collateral circulation. The syringe and needle should be prepared and the syringe cap used to ensure sterility. Stabilise the wrist with use of a pillow and clean the puncture site with a suitable skin preparatory wipe. Remove the cap from the needle and present the tip to the puncture site inserting at a 35°–45° angle. Pierce the skin and slowly advance the needle in one plane. When the artery is punctured, blood will enter the syringe. If the needle goes through the vessel, slowly withdraw the needle until blood appears again in the syringe. After enough blood has filled the syringe (which will be dictated by the volume needed for correct heparinisation), withdraw the needle and immediately apply pressure directly on the puncture site with sterile gauze or cotton wool for 5–10 min. Failure to do this may cause haemorrhage or thrombosis. Remove the pressure pad and check that it is possible to palpate a pulse distal to the puncture site.
To prepare the sample for analysis, hold the syringe vertically, gently tap the barrel and advance the plunger until it forces air bubbles out of the syringe. Remove the needle and cap the syringe and then gently roll and invert the syringe to aid mixing of heparin. The sample should be analysed straight away or at least within 15 min at room temperature. The FiO2 should be recorded in addition to any ventilatory indices that may apply.
Possible complications
Adopting the correct procedure for arterial sampling will help to minimise any complications following the procedure:
Correct aseptic sampling will aid in reducing infection. A sterile technique will help to ensure no pathogens are passed directly into the patient’s bloodstream.
Bleeding from the artery into the surrounding tissue can occur if insufficient time or pressure is applied to the puncture site. The resulting haematoma can be worse if sampling has been performed on a patient managed with an anticoagulant such as aspirin or warfarin. Even after anticoagulation therapy has ceased, there is a period of washout that needs to be observed.
Trauma to the artery following its puncture can result in a thrombus, which could subsequently block blood flow. Performing the Allen’s test and checking for a pulse distal to the puncture site can help minimise this complication.
The radial and brachial nerves run adjacent to the artery and if the needle is inadvertently passed through them, peripheral nerve damage can occur.
Practitioners should be aware of the possibility of a vasovagal response during or immediately following arterial sampling and observe the patient carefully.
Capillary blood gas sampling
Acknowledging the invasive nature and discomfort that can be associated with direct arterial puncture, the method of arterialised earlobe capillary sampling can be used as an alternative method to determine pH, PCO2 and PO2. It is the least invasive and safest blood collecting technique and can be performed by all healthcare personnel following suitable training.110 The relative simplicity and safety profile of capillary blood sampling and the necessity for only small volumes (90–150 µL) of blood make the method an attractive substitute for arterial sampling. However, the clinical value of capillary blood gas results depends on the extent to which pH, PCO2 and PO2 of capillary blood accurately reflect pH, PCO2 and PO2 of arterial blood.
Theoretical considerations
The validity of obtaining capillary blood gas samples for clinical value remains contentious. There is evidence showing that earlobe sampling can be a direct replacement for arterial pH, PCO2 and PO2 if performed properly; however, it has also been postulated that if precision is required, this method should not be relied on for determination of PO2 when conducting LTOT assessment.111–113
Of paramount importance is the theoretical understanding of the relationship between arterial and capillary blood when earlobe sampling. Blood obtained by skin puncture is not actually representative of pure capillary blood, but a mixture of blood from punctured arterioles, capillaries and venules (as well as a variable contribution of interstitial fluid and intracellular fluid from damaged tissue cells). However, due to the relative high pressure on the arterial side of the circulation, this blood mixture contains a greater proportion of blood from the arteriole side of the capillary bed than the venule side. Therefore, a capillary sample approximates closer to arterial blood than venous blood. It is this arteriovenous (AV) difference which represents the major determinant between arterial and capillary blood gas values. The magnitude of the AV difference for PO2 is greater than PCO2 and pH and represents the problem for insufficient accuracy when determining the strict threshold criterion for LTOT provision.
Arterial PO2 should be higher than PO2 of arterialised blood flowing from the earlobe following piercing because the skin capillary bed from the earlobe uses oxygen. Also acknowledging that arterialised earlobe samples generally underestimate arterial PO2 due to AV difference but that reduced PO2 is associated with a reduction in AV difference, there is good theoretical reason to suppose that capillary and arterial blood PO2 agree more closely if arterial PO2 is reduced than if normal or raised.114 In the resting state, oxygen utilisation and carbon dioxide production will remain relatively constant. Increasing blood flow through capillaries has the effect of reducing the AV difference and subsequently the capillary/arterial difference for pH, PCO2 and PO2. This can be achieved by warming the site of puncture with a vasodilating agent to ensure optimal arterialisation of the capillary bed. With this in mind it is conceivable that under most capillary blood gas sampling situations, the difference between arterial and arterialised values is minimal.115 However the accuracy of capillary blood gas sampling is diminished in more hypoxaemic patients and underestimation of the true PaO2 can result in overprescription of LTOT.114
Sampling procedure
The procedure should be explained in full and any questions answered. Ensure that the patient has been in a rested state for at least 20 min prior to sampling; this includes no change to FiO2 or ventilator settings for 30 min. The FiO2 or prescribed oxygen flow should be noted. Reference should be made to the respiratory rate, position or level of activity, and the clinical appearance of the patient.
The hair should be tied back, any earring or piercing in the area to be sampled should be removed, and the patient’s clothing protected by covering the shoulder.
The earlobe to be sampled should be primed with a vasoactive agent for at least 15 min prior to sampling. The inferolateral aspect of the pinna should be presented with a preparation containing nicotinate to ensure sufficient warming and vasodilatation of the area. (Topical analgesic preparations containing only salicylate may not have adequate rubefacient properties so it is unclear whether alternative products will produce sufficient ‘arterialisation’ of the capillaries to produce accurate results.)
The cream is removed with gauze or wool and vigorously rubbed again, followed by cleaning with suitable skin preparation. This rubbing aids to increase local circulation and sampling.
The earlobe is then held at 90° to the head with the aid of a bung or wool, and using a sterile manual, or automated, lancet of no less than 3 mm a stab is made approximately 3 mm from the edge of the earlobe. Proper technique will negate the requirement for multiple incisions.
A good flow of blood should be generated from the puncture site. The initial purge of blood should be wiped away and then the collection/capillary tube used (which depends on sample volume and analyser) introduced into the drop of blood that forms. The tube should have a dry phase heparin preparation on the internal walls. Care should be taken to ensure that the tube is central to the drop of blood to ensure an anaerobic sample is taken. The earlobe can be gently ‘milked’ by gently stroking to encourage blood from the puncture. The tube should be held horizontal to the puncture site and blood will flow into the tube by capillary action. Any visible air bubbles that may pass into the tube must be removed by blotting on gauze or wool. Great care must be made not to squeeze as this may introduce interstitial and intracellular fluid from damaged tissue cells and affect blood values.
Good presample preparation and sampling technique should ensure that the blood sample is collected within 30 s. The sample tube should be filled to minimise contact with air in the collected sample. The patient is asked to hold gauze or wool to the puncture site for several minutes to ensure that bleeding stops. A plaster may be used if required. The blood sample should be kept at room temperature and sampled as quickly as possible to avoid coagulation and ambient temperature equilibration.
Pulse oximetry
Pulse oximetry is a non-invasive technique for monitoring SpO2 either continuously or as a ‘spot check’. Pulse oximeters are often used for serial or continuous measurements of SpO2 and pulse rate during physiological tests.
The SpO2 (%) measured by pulse oximetry is not always identical to the actual arterial oxygen saturation (SaO2); there is potentially a ±2%–3% error in SpO2 measurements, but generally the two readings are considered close enough for clinical purposes. Pulse oximetry simultaneously measures the pulse rate (beats per minute), but users should be aware that artefact can also give rise to incorrect readings and that it may not necessarily correspond to actual heart rate.
Commonly the sensor is placed on a thin part of the patient’s body, usually a fingertip, toe or earlobe, or in the case of an infant, across a foot. The device passes two wavelengths of light (red and infrared) through the capillary bed to a photodetector. It measures the changing absorption of each of the wavelengths (typically 660 nm and 940 nm), allowing it to determine the absorption due to the pulsing arterial blood alone, while excluding the confounding effects of venous blood, skin, bone, muscle and fat.
As with any recording, it is essential that the inspired oxygen (or room air) and whether or not the patient is ventilated is recorded, which is key to the interpretation of any recorded data.
Measurement procedure
The precise nature of the set-up depends on the actual application being undertaken. However, in general:
The patient should be rested for at least 5 min prior to the measurement.
Remove nail polish and artificial nails before using a finger probe. Determine if earlobe piercings will affect measurements if using the earlobe.
Ensure there is good circulation to probe site: check for cold hands or known circulation problems.
If supplemental oxygen is being used record the flow or percentage. Also if the patient is on a ventilator or Continuous Positive Airway Pressure (CPAP), record the settings being used.
Check the quality of the pulsatile signal by checking the oximeter heart rate agrees with the palpated pulse of the patient and/or reviewing the pulse pressure signal.
The probe should be left in situ for at least 30 s before taking a reading.
Calibration, quality control and accuracy
Pulse oximeters are calibrated during manufacture by comparison with direct measurements of oxyhaemoglobin saturation. Current commercial pulse oximeters are calibrated using data from healthy volunteers where an ABG sample has been obtained. Very few normal subjects are studied at an SaO2 of <80%, so in general the accuracy of a given pulse oximeter is usually within ±2% over the range of 80%–100%. Below 80%, the accuracy is estimated by extrapolation and therefore is subject to poorer accuracy >±2%.
Other technical considerations
There are a number of considerations that can limit the effectiveness of oximetry:
Blood flow: the measurement site must be perfused such that the pulsatile waveform and the actual blood flow can be detected. Reduced blood flow can be present in peripheral circulatory disorders such as Raynaud’s disease, simply having cold hands, or even if a patient just lies on their arm during long-term monitoring.
Sampling rate: the sampling frequency used can vary between one sample every second to one sample every 8 s, and in some models of oximeter can be adjusted. The correct sampling rate needs to be appropriate to the application for which it is being used. For example, in an overnight sleep study, a patient with severe sleep apnoea requires a relatively high sampling rate to reflect the fast changing signal. Sampling rates may also be governed by the memory capacity and data storage capabilities of the equipment being used.
Averaging time: oximetry measurements are smoothed by performing a ‘running average’ with a moving window that varies from 1 to 15 s in length, and the speed of response may vary between different machines. For overnight pulse oximetry in sleep medicine, it is important that the oximeter is set to the shortest time interval for measurement; 5 s or less is regarded as being acceptable.
External light interference: external light absorbed by the photodetector may alter the SpO2, for example, fluorescent light, sunlight and overhead lights in theatre. Correct probe positioning and covering the probe with an opaque material will help eliminate external light interference.
Substance interference: skin pigmentation may affect readings as calibration curves have usually been established using Caucasian subjects. Nail polish (especially green, blue and black) and synthetic nails may affect the accuracy of pulse oximeters as they are likely to cause a reduction in SpO2 reading. Nail varnish and false nails must be removed before the pulse oximeter probe is applied to the finger. Intravenously administered dyes, for example, methylene blue and fluorescein (orange colour), may decrease the measured SpO2.
CO and methaemoglobin: the wavelengths of light used in the process of estimating SpO2 are unable to distinguish three or more forms of Hb. In the presence of COHb, for example, in heavy smokers or patients with acute CO poisoning, the SaO2 will be overestimated. In the presence of methaemoglobin concentration, SpO2 measured by oximetry will plateau at around 85% regardless of whether the true SaO2 is much higher or lower.
Anaemia: anaemia can affect the accuracy of pulse oximetry since the reading depends on the light absorption of Hb. When Hb amount is reduced, this has a direct effect on the measurement obtained.
Respiratory muscle assessment
Introduction
The scope of this section is limited to non-invasive tests of respiratory muscle function and associated pulmonary function tests which may suggest the presence of respiratory muscle weakness. All the tests described could be undertaken within a clinical physiology department.
Direct assessment of respiratory muscle strength cannot be performed; however, methods based on measuring the pressure-generating capacity of the respiratory muscles have been developed. Simple non-invasive volitional manoeuvres can be undertaken to determine the absence, rather than the presence, of profound respiratory muscle weakness and so avoid the necessity of further complex, invasive, non-volitional tests, which may be needed to elucidate and diagnose true respiratory muscle weakness.
Equipment
Measurements of airway pressures are used to provide a surrogate index of respiratory muscle output rather than directly measuring respiratory muscle contractile properties. Pressures measured during volitional manoeuvres reflect the synergistic action of several respiratory muscle groups, whereas those produced by motor nerve stimulation reflect the contractility of the individual muscles under investigation, for example, phrenic nerve stimulation to assess diaphragm function.
The ATS/ERS have jointly published guidelines describing the appropriate characteristics for equipment required to measure respiratory muscle function.116 When measuring maximum inspiratory and expiratory pressures generated during volitional manoeuvres, a pressure transducer with a resolution of approximately 0.05 kPa (0.5 cmH2O) and a range of up to ±20 kPa (±200 cmH2O) should be sufficient. Transducers should have a flat frequency response up to 15 Hz. Validation to ensure linearity across the entire operating range should be performed regularly. This should be performed with the tubing and any additional fittings connected as these can significantly affect transducer performance. This is of particular relevance when measuring sniff nasal inspiratory pressure (SNIP) due to rapid pressure changes that occur during the manoeuvre.
A visual display of the pressure waveform produced during the manoeuvre is advantageous as visual inspection can help ensure the manoeuvre has been performed correctly. This is of particular relevance for sniff pressures when a short sharp effort is required to produce a rapid pressure spike which conforms to the recommended characteristics. The sampling frequency of the recording system should be at least 100 Hz to provide an accurate representation of the generated pressure.
Measurements of respiratory muscle strength are generally unfamiliar manoeuvres, so an experienced operator should provide careful instructions and a demonstration of the test procedure, as well as provide encouragement, motivation and feedback in order to obtain the best results.
Maximal static inspiratory and expiratory pressures
Maximal static inspiratory pressure (PImax) and maximal static expiratory pressure (PEmax) (referred to as maximal inspiratory pressure and maximal expiratory pressure in older literature) performed at FRC reflect the pressure generated by the respiratory muscles alone. Manoeuvres performed at RV for PImax or TLC for PEmax also reflect the significant additional contribution from lung and chest wall recoil. Although this contribution can be significant if weakness is present, clinical measures and normal values of PImax and PEmax do not conventionally correct for respiratory system recoil. Many reference ranges for PImax were developed in healthy subjects performing the manoeuvre from FRC rather than towards RV despite clinical testing, requiring the patient to exhale fully before performing a maximal inspiratory effort.
Patients generally find it easier to perform PImax from RV and PEmax from TLC, and adopting such an approach helps to standardise measurement. In addition the force-generating capacity of the respiratory muscles is directly influenced by the lung volume at which the test is performed as this will directly affect the operating length of the muscles themselves. In addition, despite tests being performed at fixed lung volumes, these may not completely represent isometric conditions, and gas compression and rarefaction result in muscle shortening or lengthening, and changes in muscle force–velocity and force–length relationships.117–119 Despite the complex relationship between respiratory muscle force generation and the pressure produced in the thorax or mouth and the varying contribution of the muscle force–length relationship and lung and chest wall recoil, PImax and PEmax reflect global respiratory muscle strength.
Equipment
Self-contained electronic devices with either a digital display or computer display are commercially available. The ATS/ERS statement116 recommends a short rigid tube connected to a valve which allows the manoeuvre to be performed and the mouthpiece occluded following a short period of normal breathing. The device should contain a small air leak (2 mm internal diameter and 20–30 mm in length) to prevent glottis closure during the PImax manoeuvre and prevent the patient from generating pressure using their cheek muscles during the PEmax manoeuvre. A flanged mouthpiece is generally recommended due to their ease of use by patients and the ability to form a leak-free seal. The type of mouthpiece employed can significantly affect the pressure generated,120 particularly PEmax, although it is felt to be of little significance in clinical testing.116
Patients with severe orofacial muscle weakness may be unable to form a leak-free seal using a standard mouthpiece and a face mask interface may be used. A tube interface, consisting of a large diameter rubber tube pressed firmly against the face around the lips, may be used in patients who do not have respiratory muscle weakness but who break the seal around a mouthpiece or face mask during the manoeuvre, most commonly during the PEmax manoeuvre.120 121 Reference ranges are available for both the flanged mouthpiece and tube interface.116 122
Test performance
With the patient seated and wearing a noseclip, they should be instructed to seal (pinch) their lips firmly around the mouthpiece. If a good seal is hard to obtain, either the patient or the operator can use their hands to press the lips against the mouthpiece during each manoeuvre.123 Alternatively, a face mask interface or tube mouthpiece (as described in the equipment section above) can be used. If a satisfactory seal cannot be achieved, an alternative test of respiratory muscle strength such as SNIP should be used.
PImax: the patient should be instructed to exhale slowly and fully to RV and then perform a sustained maximum inspiratory effort against the occlusion. It has been described to patients as ‘sucking in hard, like trying to suck up a thick milkshake through a straw’.
PEmax: the patient should be instructed to inhale fully to TLC and then perform a sustained maximum expiratory effort against the occlusion. It has been described to patients as ‘blowing up an uninflated party balloon’.
The patient should be encouraged to maintain pressure generation for a minimum of 1.5 s, as estimated by the operator, and the largest negative (PImax) or positive (PEmax) pressure sustained for at least 1 s (not a transient spike) is recorded figure 18.116 The patient should be allowed to rest for approximately 1 min between manoeuvres and the manoeuvre repeated until the operator is confident a maximal manoeuvre has been performed,116 which may need five or more attempts.124 125 The largest value for PImax and PEmax should be reported alongside the predicted value and the lower limit of the normal range (table 7). At least three additional measures should be performed if the last measurement was the largest of the testing session or if the second largest measurement was less than 90% of the largest. The operator should aim for the variability across measurements to be less than 1 kPa (10 cmH2O)124 or less than 20% across the largest three values.116 In general approximately 85% of healthy adults achieve less than 1 kPa difference between measurements.126 127 Because the tests require volitional effort, it is good practice to report the degree of patient cooperation and effort alongside the test results.

Maximum static mouth pressure traces. Mouth pressure versus time during maximal expiratory and inspiratory manoeuvres against an obstructed mouthpiece. Maximum pressure is sustained for approximately 3 s. PEmax and PImax measured as mean pressure over 1 s around peak pressure. Adapted from the American Thoracic Society/European Respiratory Society statement, 2002.120Reproduced from Hughes, ‘Physiology and Practice of Pulmonary Function’, published by the Association for Respiratory Technology & Physiology. PEmax, maximal static expiratory pressure; PImax, maximal static inspiratory pressure; RV, residual volume; TLC, total lung capacity.
Regression equations used to calculate mean values and LLN for PImax and PEmax
Mean reference values and LLN for SNIP
Sniff nasal inspiratory pressure
SNIP is a non-invasive test of inspiratory muscle strength requiring the patient to perform a short, sharp sniff, during which nasal inspiratory pressure is measured by means of a bung inserted in one nostril connected by a catheter to a suitable pressure transducer. As the test involves a simple natural manoeuvre, it is relatively easy for patients to achieve maximal efforts with a little practice. The most patent nostril for testing is selected by asking the patient to sniff while occluding alternate nares.
SNIP generally produces pressures in excess of those obtained during a PImax manoeuvre.128 The nose acts like a Starling resistor with flow through the unoccluded nostril remaining low during SNIP and independent of driving pressure. In severe airways obstruction pressure, transmission through the lungs to the nose may be impeded,129 but otherwise the pressure measured in the nostril closely reflects intrathoracic pressure and inspiratory muscle strength.120 130
Equipment
Self-contained electronic devices with either a digital or computer display are available. Sniff bungs of different sizes are available commercially. A sensitive transducer (resolution of approximately 0.05 kPa (0.5 cmH2O) and a range of up to ±20 kPa (±200 cmH2O)) with a flat frequency response up to 15 Hz, with the SNIP bung and tubing attached, should be used. Validation to ensure linearity across the entire operating range should be performed regularly.
Performance
Prior to testing the patient should be asked about nasal patency and upper airway obstruction relevant to performance of the SNIP test. Clearing any nasal congestion by blowing the nose prior to testing can help improve test performance. With the patient seated comfortably and the sniff bung wedged firmly in a patent nostril, they should be instructed to make short, sharp, maximal sniffs through the unoccluded nostril, starting from relaxed end expiration (FRC) with the peak pressure being measured for each attempt. Suitable sniffs for analysis show a regular upstroke on the pressure trace and sharp peak and total sniff duration of less than 0.5 s.131 As the sniff is a natural manoeuvre, it can be performed easily, and reproducibly, by most patients with little practice. Most patients are able to achieve a maximal effort with encouragement from the operator in less than 10 attempts. At least three additional measures should be performed if the last measurement was the largest of the testing session or if the second largest measurement was less than 90% of the largest. The largest peak pressure for SNIP should be reported alongside the predicted value and the lower limit of the normal (see table 8).
Interpretation
These tests are volitional requiring patient motivation and cooperation and can exclude clinical respiratory muscle weakness if pressures within the normal range are achieved. Low pressures may reflect either muscle weakness or poor test performance. Tests of respiratory muscle strength such as PImax, PEmax and SNIP used in isolation tend to overdiagnose weakness. Multiple tests of respiratory muscle function increase both diagnostic precision and make assessment possible in a range of clinical circumstances.132 It is best practice when assessing inspiratory muscle strength to perform both PImax and SNIP measurements. If low values are obtained then referral for advanced testing at a specialist centre should be considered.
Reference ranges
The normal ranges are wide, so that values in the lower quarter of the normal range are compatible both with normal strength and with mild or moderate weakness. The ATS/ERS statement on respiratory muscle testing116 indicates that significant respiratory muscle weakness is excluded if PImax reaches −8 kPa (−80 cmH2O), or if PEmax exceeds 8 kPa (80 cmH2O) for males, or 6 kPa (60 cmH2O) for females, or SNIP reaches −7 kPa (−70 cmH2O) in males or −6 kPa (−60 cmH2O) in females. A normal PEmax with a low PImax suggests isolated diaphragmatic weakness.
Evans and Whitelaw133 reviewed the available data and compiled estimated mean reference values and lower limits of normal for PImax and PEmax (table 7) that demonstrate the normal age-related decline of maximal respiratory pressures and sex differences. Male and female data are reported separately, with male exceeding female values for PImax by 34%–66% and PEmax by 41%–57%, depending on age. Age also correlated with respiratory muscle strength and was therefore used as the independent variable in prediction equations.
For male and female PImax the weighted means of the slopes and intercepts for flange mouthpiece data of Hautmann et al134 and Windisch et al.135 Male PEmax used the weighted means of the slopes and intercepts for flange mouthpiece data from Vincken et al,136 Wilson et al137 and Neder et al.138 Female PEmax used the data from Neder et al.138
PImax, SNIP and PEmax can reliably track change in respiratory muscle strength139 and guide clinical management.140–144 Based on data from studies in healthy subjects,145 a change of more than 2.5 kPa (25 cmH2O) can be used as the threshold to identify true change in respiratory muscle strength. No correlation has been observed between smaller improvements in PImax or PEmax and symptoms.146–148
Erect versus supine VC
A reduced VC is common in respiratory muscle weakness and reflects both inspiratory and expiratory weakness, preventing full inflation and expiration, respectively, as well as reduction in lung and chest wall compliance, which are observed in patients with chronic respiratory muscle weakness.149 150 The change in VC is however less sensitive than PImax, SNIP and PEmax in mild weakness.151 In adults a fall in VC greater than 30% when supine compared with the upright posture is indicative of isolated or disproportionate diaphragm weakness.152 The marked change in VC is a result of the action of gravity on the abdominal contents and the change in diaphragm geometry and load. The change in VC from standing to supine in healthy subject is approximately 5%–10%.153
Performance
The procedure is not particularly well defined, but the patient should be fully supine; however, this will depend on how well the patient can tolerate this posture due to orthopnoea. Semirecumbency may be a better approach under such circumstance, but this should be recorded.
Specialist respiratory muscle function tests
Sniff oesophageal pressure is a test that is only carried out in more specialist centres but is recognised as the best overall volitional measure of inspiratory muscle strength.154 This is an invasive test with discomfort from swallowing an oesophageal balloon. Sniff transdiaphragmatic pressure can be obtained in a similar manner using a second pressure catheter located in the stomach to provide a measure of abdominal pressure. Measuring the gastric pressure during a maximal cough reflects expiratory muscle strength and better discriminates expiratory muscle weakness141 than PEmax. The transdiaphragmatic pressure can be elicited by unilateral or bilateral electrical or magnetic phrenic nerve stimulation providing a non-volitional but invasive and unpleasant measure of inspiratory muscle contractility.155 156 Additionally recording the diaphragm electromyogram using an oesophageal electrode catheter allows phrenic nerve and diaphragm function to be assessed.157
Although PImax, PEmax and SNIP provide easily applicable tests of respiratory muscle strength, such tests are volitional and should be best viewed as simple screening tools. Clinical weakness can be excluded if high pressures within the normal range are achieved. Low pressures are difficult to interpret, indicating either muscle weakness, poor test performance or the impact of pulmonary function; airway pressure measurements during dynamic manoeuvres such as sniff may be affected by airway calibre resulting in poor pressure equilibration across the lung to the upper airway. PImax, PEmax and SNIP used in isolation therefore tend to overdiagnose weakness.
It is therefore best practice when assessing inspiratory muscle strength to perform both PImax and SNIP measurements.132 If low values are obtained then referral for advanced testing at a specialist centre should be considered.
PImax SNIP and PEmax may be more reliable when tracking change by regular, repeated testing.139 A change of more than 25 cmH2O can be used as the threshold to identify true change in respiratory muscle strength.145
In addition to the usual contraindications (see ‘Contraindications for lung function testing’ section), there are also conditions where suboptimal performance of volitional tests of respiratory muscle strength is likely:
Chest or abdominal pain of any kind.
Oral or facial pain exacerbated by a mouthpiece.
Stress incontinence.
Dementia or confused state.
Chest infection or acute exacerbation of lung disease.
Paediatric lung function testing
Paediatric lung function testing is often as much an art as it is a science to perform. Routine lung function measurements can now be performed in paediatrics from the age of 3 years through to the age of 16–18, where they are commonly seen in adult physiology services. This age range encompasses a large and dramatic change in both the lung physiology and the cognitive development of the child. Paediatric services therefore need to be able to adapt to these complexities.
When assessing children, attention should be given to the suitability of different tests compared with the cognitive development of the child. Spirometry can often be successfully performed from the age of 3 years when assessed in the appropriate environment with trained clinical physiologists, and attempting spirometry from a young age is encouraged, particularly if regular follow-up is required. Other tests are more complex and therefore may need greater cognitive awareness. Gas transfer and lung volumes should be considered from the age of 7 years, while acknowledging that some children will need to be older to obtain successful measurements and some will be capable at an earlier age. Age should always be documented to one decimal place to minimise error in relation to reference values.44
Physiologists working with children should be experienced in doing so and should demonstrate enthusiasm and patience with the children in order to obtain the best results for them. In services where both adults and children are routinely assessed, specific staff members should be responsible for paediatric testing, and ideally there should be a child-friendly environment. These physiologists should gain specific experience in dedicated paediatric laboratories and attend paediatric-specific courses if experience of paediatric testing is required.
The environment in which children are tested should be suitable for children of all ages. The room should be bright and decorated in a child-friendly manner. It should contain suitable distractions such as books and toys and with incentives, such as stickers, available for reward. Child-specific patient leaflets should be used and should be appropriate for the age of the child as well as the child’s parents/carers. Children should not be tested alongside adult patients.
When testing young children in particular, the tests should be considered a game or a challenge, with every test seen as a success regardless of the technical quality or clinical outcome of the test. This approach emphasises testing as a positive and allows young children to engage with the testing session. As a result, testing sessions need to be longer than for adults to allow for the extra time needed to engage the child, for example a time slot of 1 hour is required for assessing spirometry, gas transfer and lung volumes in children younger than 12 years of age.
Care should be taken to accurately measure height in centimetres (barefoot) and weight in kilograms (after removing outer garments) and be documented to one decimal place. The rapid rate of growth of a child requires this information to be reassessed at every visit. For patients where measuring height is inappropriate/unfeasible, for example wheelchair users or those with spinal deformities, either an accurate measure of arm span or ulna length can be used as a surrogate. There are published reference data for the use of both of these measurements as a substitute for standing height.14 158 Caution should be applied when using arm span as a direct substitute for standing height as recent evidence suggests that the ratio between arm span and standing height varies throughout childhood and across different ethnicities.14 Technical comments should be available on the report when a substitute for height is made, for example: ‘Predicted values are calculated from standing height but since we were unable to obtain accurate measurements of standing height arm span/ulna length were used to estimate height. Interpret results with caution’.
Paediatric spirometry
The spirometry test protocol is very similar to adults: It should be performed with the child wearing a noseclip and seated in an adjustable chair ensuring the child’s feet can touch the floor. There should be a minimum of three attempts; however, since children often need several attempts to perfect the technique and do not fatigue as readily as adults, there should be no set number of maximum attempts. Young children often have to perform >10 attempts to achieve repeatable results. In order to ensure the child maintains concentration levels, there should be no minimum wait time between successive attempts.
Start of test criteria for older children (>6 years) is similar to adults with a back extrapolation volume of <5% of FVC or 100 mL, whichever is the greater. However, in preschool children (<6 years), due to increased relative lung volume to airway size, back extrapolation criteria is more lenient with an absolute back extrapolation of <75 mL or 10% of FVC, whichever is the greater.159 There is no minimum forced expiratory time requirement in children. Younger children will empty their lung volume rapidly, with preschool children often completing exhalation in <1 s. A volume plateau on the volume–time graph can assist in determination of successful end of forced expiration. The exception to this is in preschool children, where lung emptying is rapid, when the end of test criteria is successful if the volume curve is approaching a plateau on the volume–time graph. It is important to note that practice attempts should not be discarded and all efforts recorded within the software of the equipment. For paediatric spirometry, repeatability of FEV1 and FVC differs for preschool and school-age children. In all children the child should ideally perform at least three technically acceptable attempts, but results should not be discarded if this is not the case. In school-age children the highest and second highest values for FEV1 and FVC should be within 100 mL or 5%, whichever is the greater value, while for preschool children this value should be 100 mL or 10%, whichever is greater.
In paediatric spirometry visual feedback incentives or games must be available in order to aid the child to perform the test correctly. Visual incentives can also help sustain the expiratory effort to achieve the best FVC. Ideally the games should be manually adjustable to enable the difficulty to be adjusted to ensure the operator can achieve the desired outcome with each child. The use of these incentives helps ensure that the spirometry session is seen more as a ‘game’ than a ‘test’.
The display should have a zoom capability to view results from young children appropriately.
The reporting of spirometric values should follow that of adult guidelines with the best FEV1 and FVC reported from all accurate measured attempts with flow data reported from the flow volume loop with the greatest sum of FEV1+FVC. FEV1 should not be reported if the forced expiratory time is <1 s, using the FEV0.75 instead. In this circumstance the ratio of FEV0.75/FVC should be used to define airflow obstruction using the GLI 2012 LLN for this index.44 Technical comments on the acceptability and repeatability should always be included in the report, particularly when the technique is suboptimal.
In the assessment of bronchodilator response, the standard procedure should be to administer 400 μg of salbutamol via a metered dose inhaler plus spacer device. A noseclip should be worn to ensure mouth breathing, and in younger children a face mask with the spacer may be required. The absolute change and percentage change from baseline should be reported.
Paediatric static lung volumes
Body plethysmography is often the first method of choice when measuring static lung volumes in paediatrics for several reasons; it is well tolerated by children (>6 years) and several efforts can be made in a short space of time. Also the currently recommended reference data for paediatric lung volumes160 were performed using body plethysmography. In addition to lung volume measurements, airway resistance can be easily measured in children during the plethysmography protocol. This should be performed prior to FRC occlusions during initial tidal breathing and the child should be instructed to breathe tidally at 30–40 breaths per minute.161 If animations are available they can be used to facilitate obtaining this breathing frequency, otherwise the operator should guide the child’s respiratory rate.
A footrest should be available for children whose feet do not touch the floor. If this is required, the box calibration should be performed with the step inside the box. Children often find it difficult to perform adequate relaxed VC manoeuvres and therefore forced manoeuvres can be considered.
Paediatric single-breath gas transfer for CO
The measurement of gas transfer in paediatric patients follows the same process as for adults. Measuring gas transfer in children is not part of ‘routine’ lung function assessments, but it is still an important clinical tool in certain patient groups frequently seen in specialist centres.
The complexity and practicalities of the single-breath technique mean that the measurement can be challenging in young children <6 years. If using slow responding gas analysers, some small children may not be able to exhale a large enough sample volume (1.2 L) to achieve a valid result. However, most children from age 6 to 7 years and onwards should attempt the measurement if there is a clinical need. With fast responding gas analysers it is possible to determine lung gas transfer in subjects with a VC <1.2 L (see ‘Washout and sample collection’ section). Test performance is very similar to an adult patient; however, there is no need to emphasise a relaxed exhalation prior to inhalation of the gas mix. As mentioned in the ‘Spirometry’ section, many young children will be more likely to reach RV if they perform a forced manoeuvre. The other modification from the adult protocol is that the inspired volume threshold is lowered to be at least 85% of the measured VC.
Refer to ‘Measurement of carbon monoxide transfer factor’ section for more information on test protocol and quality control.
Paediatric respiratory muscle testing
Assessment of respiratory muscle function in children involves an integrated approach using both direct and indirect tests of respiratory muscle function. The most common tests performed in children measure the pressures generated within the thorax during maximal ‘sniffing’ (SNIP), inspiratory (PImax) or expiratory (PEmax) manoeuvres. All three of these tests require maximal effort and cooperation from the child to perform accurate manoeuvres; despite this, children as young as 4 years can perform maximal SNIP manoeuvres and can usually generate PImax and PEmax successfully from the age of 5–7 years.
SNIP reflects inspiratory diaphragmatic strength in children and should be used as the first-line test of inspiratory respiratory muscle function. The technique is relatively non-invasive and intuitive to young children and can be performed longitudinally to monitor the effects of progressive neuromuscular disorders such as Duchenne muscular dystrophy. It is performed using a pressure transducer attached to a nasal probe that is seated in one nostril. The ‘sniff’ manoeuvre is then performed through the unobstructed contralateral nostril by performing a maximal short ‘sharp’ sniff. Performing the manoeuvre from FRC rather than RV is more common in paediatric practice due to intuition; however, it is important to document which method is used and then to be consistent for any longitudinal assessments as the two different lung volumes may produce differing results. It is not uncommon to perform >10 attempts in order to obtain accurate maximal efforts with efforts made through both nostrils to counter the effects of poor airflow through either nostril. The operator should aim to obtain accurate maximal efforts aiming for the best two attempts agreeing within 10% of each other.
Paediatric reference equations available to assess abnormality are available.162 163 A SNIP value greater than the LLN rules out significant diaphragmatic weakness; however, a low value is not diagnostic of weakness. In the case of a low value, a PImax manoeuvre should be performed if not already routine practice. A normal value in either of these measures can rule out significant inspiratory respiratory muscle weakness.
Indirect measures of respiratory muscle function also play a key role in assessment. These may include spirometry, cough PEF, the monitoring of blood gases and the simple measurement of respiratory frequency and tidal volume. Spirometry, alongside tests such as SNIP, remains the key measurement of indirect muscle function and should be performed at every visit, as soon as the child is old enough. FVC and cough PEF in particular should be monitored longitudinally. An FVC of <1.1 L coupled with a cough PEF of <160 L/min is associated with an increased risk of severe chest infections in children with neuromuscular disorders; however, caution should be applied when using these cut-offs as they do not consider the age/size of the child.164 Cough PEF should be performed routinely at each visit and measured using a fast-response pneumotachograph as opposed to a handheld PEF metre.165 Spirometry may also play a role in highlighting isolated diaphragmatic weakness by performing the test in supine position. A >25% reduction of VC in the supine position can be regarded as significant for diaphragm weakness.166
In summary routine follow-up of children with neuromuscular disease should include at the least measures of spirometry, SNIP and cough PEF, with the addition of PImax and PEmax when needed. It is imperative that these results are plotted as trend data and interpreted in a longitudinal manner in known neuromuscular patients.
‘Paediatric Reference Values’
Despite similar functions, the size, shape and composition of the respiratory system change dramatically from infancy to adulthood. At birth, all generations of the conducting and respiratory branches have been generated; however, it is estimated that only a third to half of the adult complement of alveoli are present at birth.167 Consequently infants/young children have a large airway size relative to lung volume. Rapid increases in size and number of alveoli occur in infancy and early childhood, with lung function increasing 20-fold during the first 10 years of life.168 During childhood, FVC outgrows FEV1, leading to decreases in FEV1/FVC, with these trends being reversed during adolescence.169 Accurate descriptions of the ‘normal range’ need to take these physiological factors into account if respiratory impairment is to be detected accurately.
The principles behind normative reference data are based on the theory that a summary measure of values obtained from ‘normal’ individuals will represent the range of values expected in a healthy population. A literature search on PubMed will reveal hundreds of paediatric reference equations relating to different populations, age groups and nationalities. Until recently, no lung function reference equation spanned the entire lifespan, with many focusing on discrete age groups (eg, preschool children (3–6 years), school-aged children (often commencing at 6–8 years of age and finishing at 16–18 years of age) or adults (some commencing at 25 years of age)). This resulted in different reference equations being ‘stitched together’ so that a wider age range could be tested without the user needing to manually switch between equations when testing patients of different ages. However, arbitrary breakpoints between specific age groups can lead to serious misinterpretation of results, particularly when trending results over time in a growing child (figure 19).170

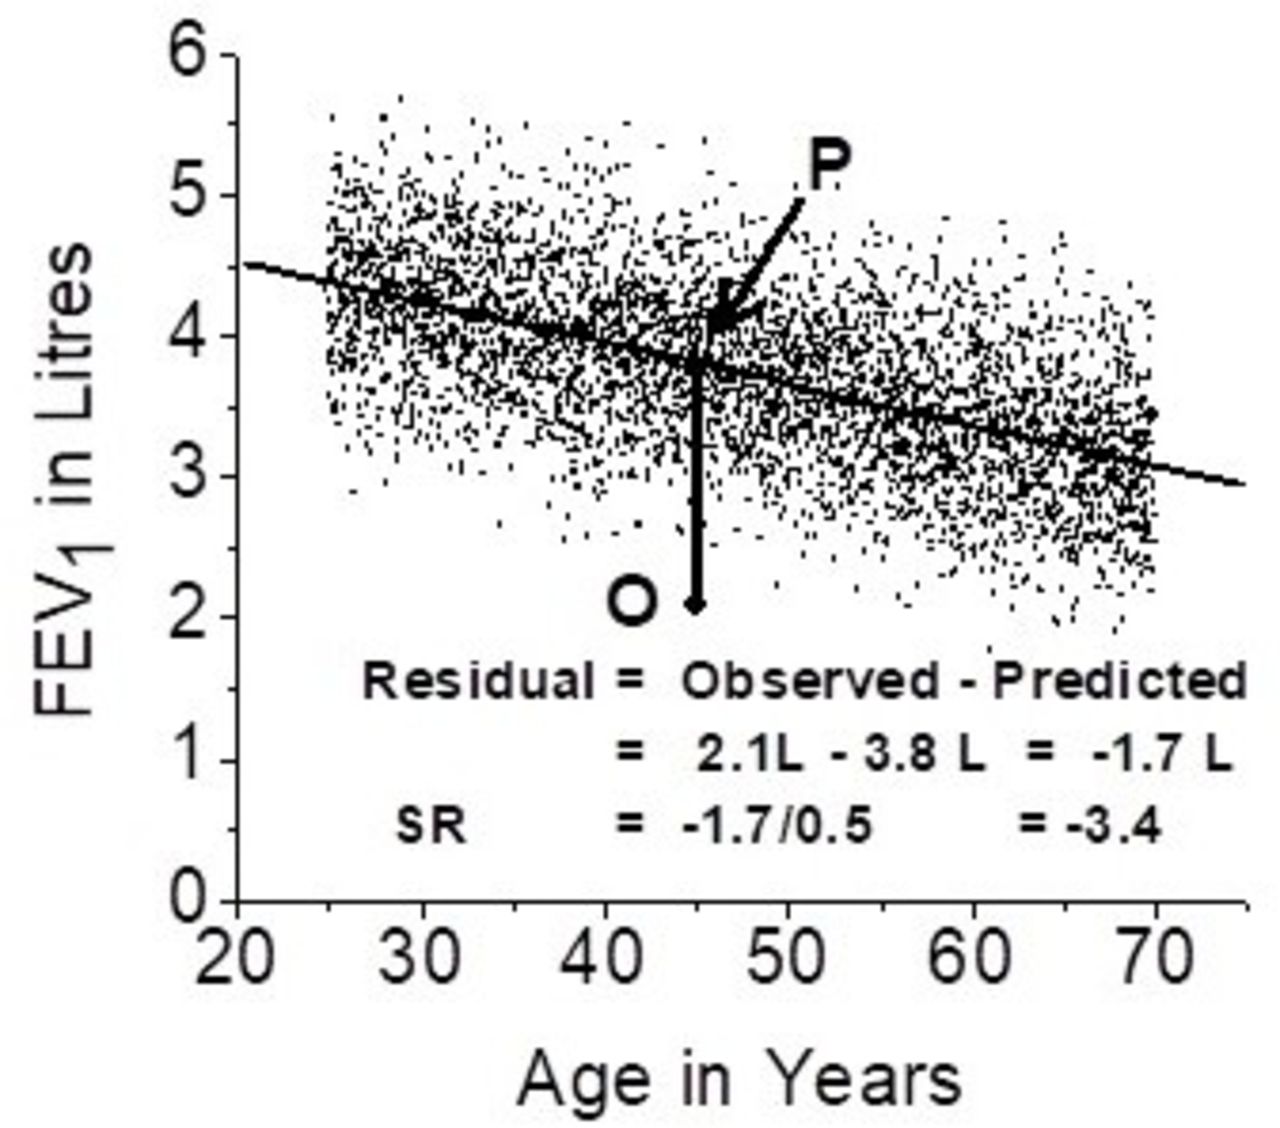
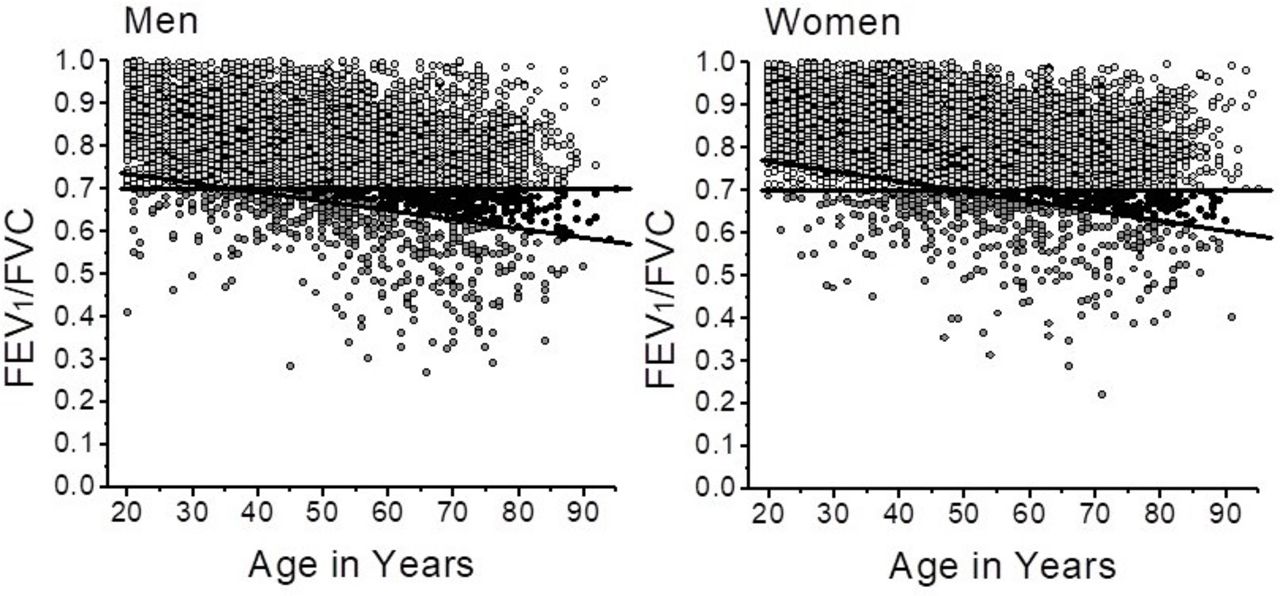
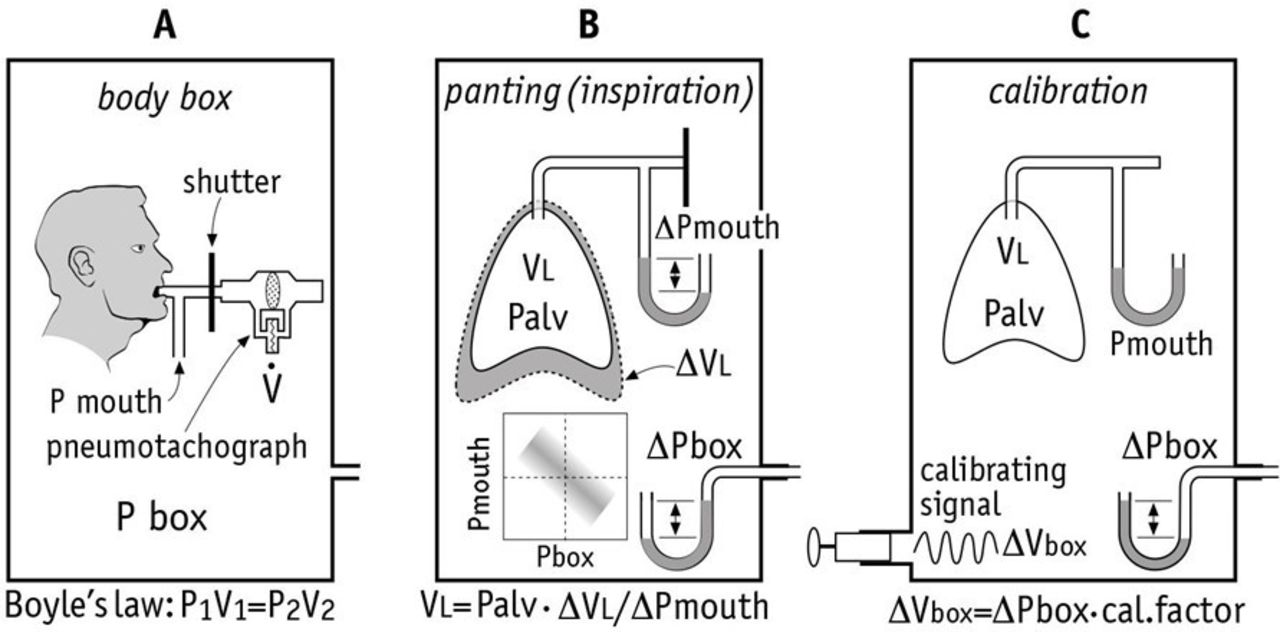
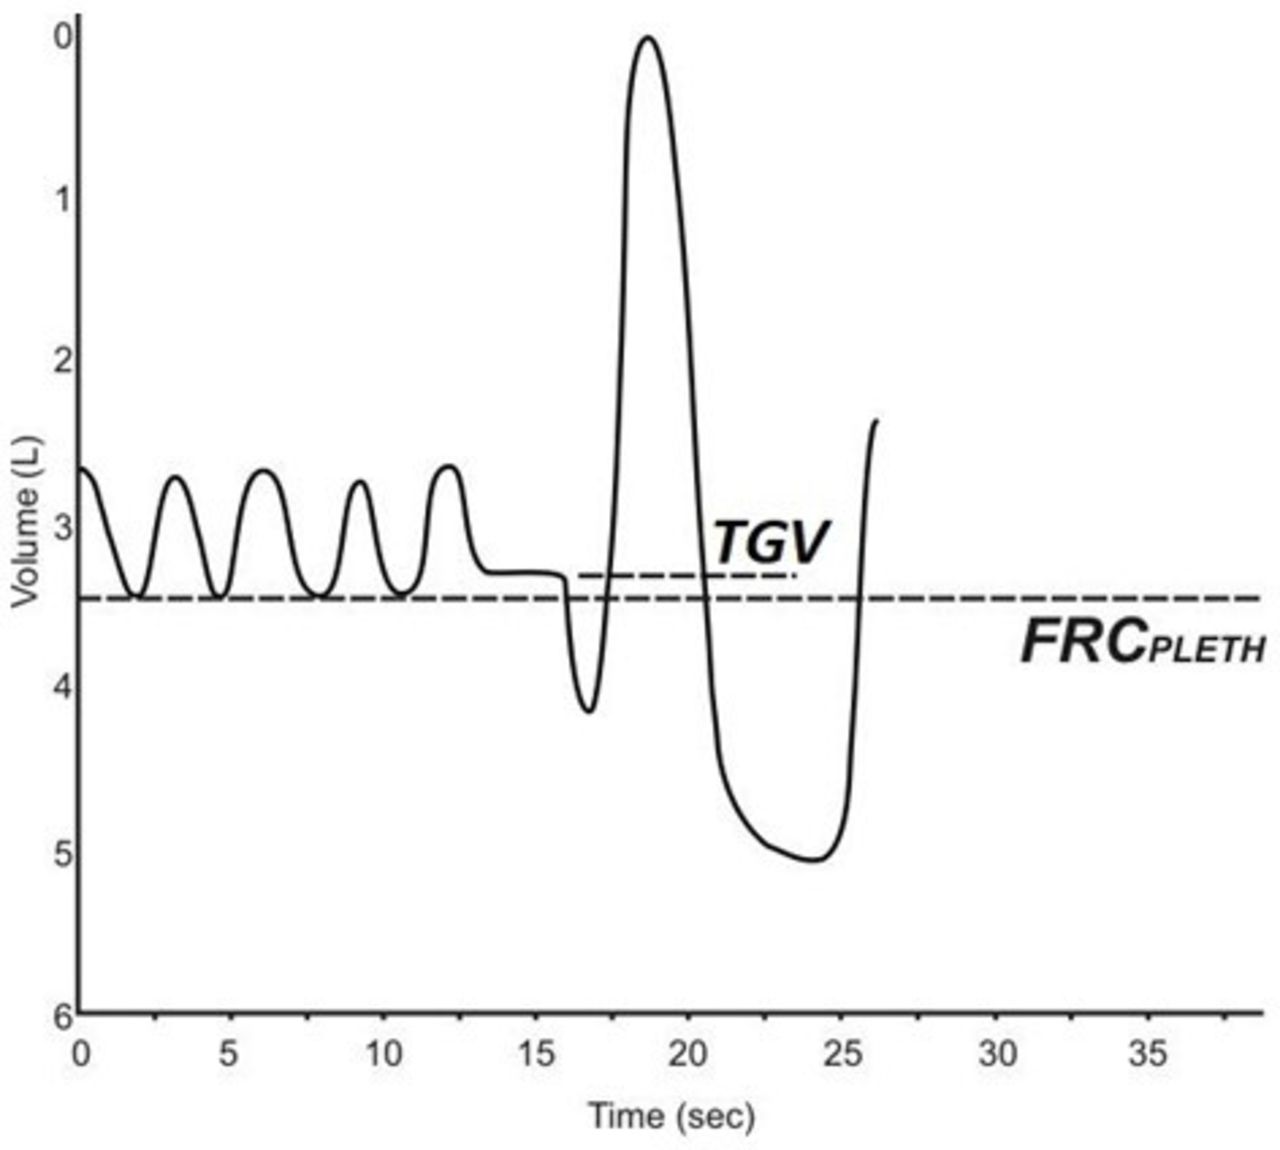
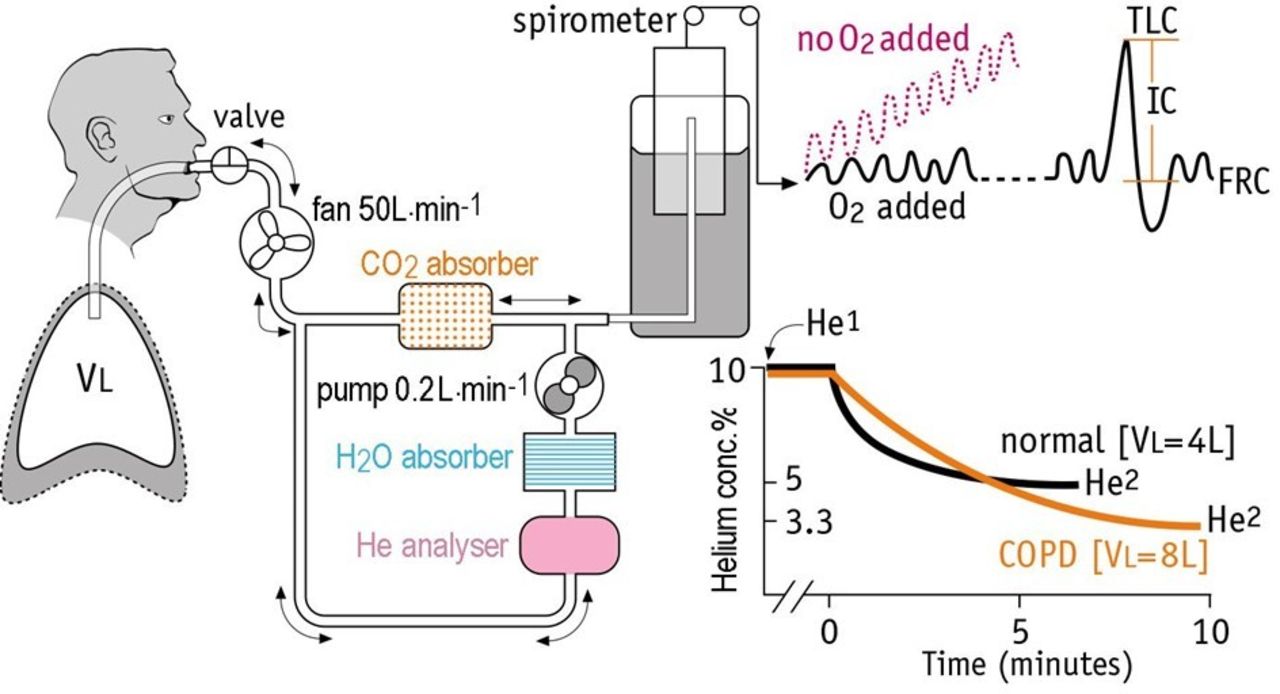
A comparison of reference equations.176 (Top) An amalgamation of the Rosenthal (paediatric) and the European Community for Coal and Steel (adult) equations. (Bottom) The multiethnic Global Lung Initiative equations. Source: ARTP Practical Handbook of Spirometry.176 FEV1, forced expiratory volume in 1 s.
The all-age, multiethnic GLI spirometry reference equations44 should be used routinely for paediatric spirometry. The GLI equations offer a smooth transition across the ages (ie, no changes from paediatric to adult equations) and a well-defined LLN for all ages. Approximately 30 000 out of the 74 000 subjects in the GLI data set were <20 years of age.
At the time of publication the GLI reference equations were only available for spirometry and gas transfer, with equations for static lung volumes expected in future publications. Table 9 summarises the reference equations that are most appropriate for the other paediatric lung function tests. It is unrealistic to expect a single set of reference data to include multiple lung function indices over the entire age range and for multiple ethnic groups. Therefore the most appropriate equations have been selected with the knowledge that the manufacturers of lung function equipment are able to develop appropriate ‘prediction modules’ which represent the appropriate reference equation for each index. When interpreting lung function it is important to take into consideration the limitations of each reference equation and ensure, where applicable, these limitations are clearly documented on each report.
Summary of lung function reference equations recommended for use in paediatrics
The GLI spirometry equations focused on indices recommended by the ATS/ERS guidelines (ie, FEV1, FVC, FEV1/FVC and FEF25-75)3 and were only able to develop robust equations where there were sufficient data. PEF and FEFxx subdivisions were not included; however, there are several publications that have demonstrated that FEF does not offer any interpretative advantage over FEV1 and FEV1/FVC.171–173
The plethysmographic lung volume equations48 suggested in table 9 are limited to Caucasian children, and caution should be applied when interpreting results from non-Caucasian children and those going through puberty or transitioning to adulthood.
All reports should state ethnicity and include a comment to state if results have been adjusted for ethnicity. Results should be interpreted using z-scores and the LLN as discussed in the ‘Reference values’ section. For the longitudinal assessment of lung function tests, the absolute value alongside the z-score should be plotted over time. As children have a rapidly developing respiratory system, plotting the absolute values alone will not provide a meaningful assessment of the z-score alongside the absolute value allows for the current age and growth of the child to be considered.
References
Footnotes
Contributors All authors were involved in writing, editing and review of this manuscript.
Funding The authors have not declared a specific grant for this research from any funding agency in the public, commercial or not-for-profit sectors.
Competing interests None declared.
Patient and public involvement The ARTP Council comprises a number of non-executive positions, one of which is held by a patient representative who has been given the opportunity to comment on the development of this manuscript.
Patient consent for publication Not required.
Provenance and peer review Not commissioned; internally peer reviewed.
Data availability statement Data sharing not applicable as no data sets generated and/or analysed for this study.
Author note The group was originally convened in 2016 and a review of the current literature undertaken by each chapter contributor for their relevant section. Literature was further reviewed throughout the development process up until the point of submission, in light of newer best practice publications. The manuscript was reviewed by two independent editors to produce a final manuscript which was sent for consultation to the ARTP Editorial Board prior to submission.
Linked Articles
- Respiratory physiology