Article Text

Abstract
Introduction Associations between air pollutants, meteorological conditions and respiratory diseases have been extensively shown. The aim of this study was to investigate associations between daily meteorological data, data on air pollution and emergency department (ED) visits depending on the day of the week, season and year (study period from 2013 to 2015).
Methods Highly correlated environmental data entered a categorical principal components analysis (CATPCA). We analysed cross-correlation functions between the time series of the respective daily environmental factors and daily ED visits. Time lags with peak correlations of environmental variables obtained by the CATPCA on ED visits together with day of the week, year, running day (linear, quadratic and cubic), season and interaction terms entered the univariate analysis of variance (UNIANOVA) model.
Results The analyses demonstrated main effects on ED visits for the day of the week with highest admission rates on Mondays (B=10.69; ƞ2=0.333; p<0.001). A significant time trend could be observed showing increasing numbers of ED visits per each year (p<0.001). The variable ‘running day’ (linear, quadratic and cubic) indicated a significant non-linear effect over time. The variable season showed significant results with winter, spring and summer recording fewer ED visits compared with the reference season autumn. Environmental variables showed no direct associations with respiratory ED visits.
Discussion ED visits were significantly associated with temporal variables. Our data did not show direct associations between environmental variables and ED visits.
In times of rapid urbanisation, increases in respiratory diseases, temperature and air pollution, our analyses can help focus future studies and enhance strategies to reduce increasing numbers of respiratory diseases and ED visits. Because the potential costs of medical care in hospitals can be high compared with physicians, public health recommendations for reducing the increasing ED visits should be promoted and evaluated.
- COPD epidemiology
- asthma epidemiology
This is an open access article distributed in accordance with the Creative Commons Attribution Non Commercial (CC BY-NC 4.0) license, which permits others to distribute, remix, adapt, build upon this work non-commercially, and license their derivative works on different terms, provided the original work is properly cited, appropriate credit is given, any changes made indicated, and the use is non-commercial. See: http://creativecommons.org/licenses/by-nc/4.0/
Statistics from Altmetric.com
Key messages
The study provides detailed analysis of the association between respiratory emergency department (ED) visits from a large German hospital and meteorological data and data on air pollution depending on the day of the week, year and the season.
This study shows that the temporal variables highly affect respiratory ED visits with highest admission rates on Mondays. Furthermore, respiratory ED visits increased over time.
Our data did not result in direct associations between environmental variables and ED visits.
Analyses such as presented herein can help focus future studies and enhance strategies to reduce increasing numbers of respiratory diseases, ED visits and to reduce the potential higher costs of medical care associated with increasing ED visits.
Introduction
Environmental and meteorological factors are likely to influence respiratory morbidity and mortality. The correlation between exposure to ambient air pollutants and adverse health effects has been shown in a variety of studies1–3 and is of concern to governments and public health organisations worldwide.4 5 The effect of ambient particulate matter on respiratory mortality has been consistently reported.6 7 In a multicity study conducted in Italy, an increase of particulate matter with an aerodynamic diameter of ≤10 µm (PM10) resulted in an increase in respiratory mortality of 2.29% (95% CI 1.03 to 3.58) at a lag of 0–3 days. This effect was higher in summer.8
Simulation models of the future climate suggest that extreme weather events such as the heat phenomena in Europe during the summer 2003 are likely to increase.9 The effect of meteorological conditions such as high ambient temperature on mortality has been demonstrated in many epidemiological studies.10–13 Urban populations are of specific interest due to the increasing numbers of urban individuals and the often risk-aggravating environmental conditions such as the so-called ‘urban heat island effect’, which describes the temperature differences between an urban area and the rural surroundings.14 15 An impact of thermal stress on heat-related morbidity and mortality in urban settings has been shown in several studies.16–18 The effect of heat stress on hospital admissions for respiratory diseases during summer months was demonstrated in a spatial analysis conducted in Berlin, Germany. Results showed significant intraurban disparities in the relative risk for hospital admissions with respiratory diseases, adjusted for socioeconomic covariables.19 The United Nations project that the number of people living in urban areas might rise to more than 70% by 2050 worldwide.20 Hence, the combined effect of increases in urban populations together with increases in heat events might become more important, even in more temperate climates.21 Increases in respiratory diseases were also found to be associated with cold weather conditions as it has been shown, for instance, by Hashimoto et al 22 or by Goldstein.23 Therefore, short-term effects of high air pollutant concentration or high ambient temperature on health might plausibly vary by season and can result in changes of morbidity and mortality.17 24 25
Effect modification between highly correlated air pollutants (eg, near surface ozone, summer smog) and meteorological conditions (eg, heatwaves) with respect to health has been analysed in several studies. Breitner et al 26 investigated interactive effects of temperature and air pollutants (PM10 and O3) on mortality in three cities of Bavaria, Germany. Findings suggest that modifying effects for O3, but not for PM10 exist. Same modifying effects could be found, for instance, for a study conducted in Berlin, Germany, by Burkart et al 27 or a study conducted in Brisbane, Australia, by Ren et al.28
However, so far only a few studies have focused on the multicollinearity of pollutants and meteorological conditions. The objective of the study is to investigate the association between daily meteorological data and data on air pollutants classified with a number of indicators as a principal components analysis (PCA)-based score and hospital admission rates of respiratory diseases, adjusted for seasonality, year and day of the week.
Methods
Study area
This study was conducted at the University Medical Center Hamburg-Eppendorf in Northern Germany (figure 1). Hamburg is the second largest city in Germany with a population size of approximately 1.9 million (census 2016).29 The topography of the study area is generally flat. The city of Hamburg is characterised by a maritime influenced climate with a mean annual ambient temperature of ≈9°C (reference period from 1981 to 2010) and four distinct seasons: winter (months December, January and February with mean seasonal ambient temperatures of ≈2°C); spring (months March, April and May, mean seasonal ambient temperature of ≈9°C); summer (months June, July and August with mean seasonal ambient temperature of ≈17°C) and autumn (months September, October and November with mean seasonal temperatures of ≈10°C).30

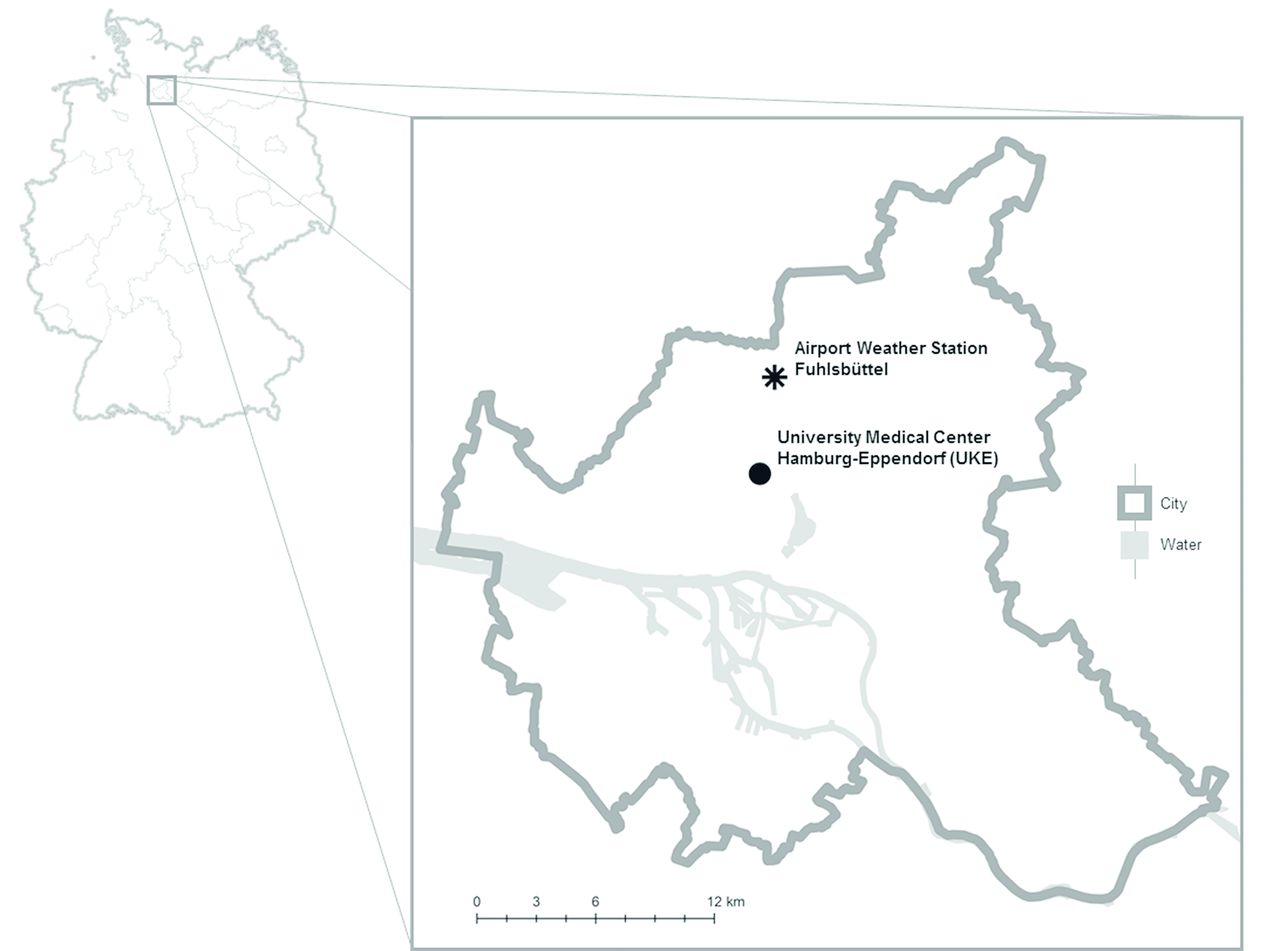
Map of the city of Hamburg with the location of the hospital and the airport weather station Fuhlsbüttel, Northern Germany.
Hamburg has 31 hospitals of which the University Medical Center Hamburg-Eppendorf is one of the largest, located in the city centre. Driver of ambulances are obliged to transport emergency cases to the next hospital available with free capacities. In cases where ambulance transport is not required, patients can choose their preferred hospital.
Data collection
Emergency department (ED) visits for respiratory diseases
Data about daily ED visits were obtained from the University Medical Center Hamburg-Eppendorf (2013–2015). The data do not allow any conclusions to be drawn about persons. The following initial diagnoses classified by International Classification of Diseases 10 (ICD-10) code were considered for the respiratory health outcome: ICD-10 J44 (chronic obstructive pulmonary syndrome (COPD)) and ICD-10 J45 (Asthma bronchiale). Both indications were summarised to one respiratory health outcome and used for all analyses. Additionally, the admission date and day of week was provided (table 1).
Variables considered for the statistical analyses
Environmental data
To avoid a bias between the location of the study hospital and the environmental data, we chose the meteorological station located closest to the University Medical Center Hamburg. Meteorological data of mean temperature, relative humidity, vapour pressure and wind speed as well as maximum and minimum temperature per day were obtained from the airport weather station Hamburg-Fuhlsbüttel which is operated by the German Meteorological Service.31 Based on hourly values for air temperature, relative humidity, wind speed and cloudiness, mean radiant temperatures have been calculated using the algorithm described by Staiger.32 Mean radiant temperatures summarise the amount of short and long wave radiative conditions received by the human body. From those hourly values, diurnal mean, maximum and minimum physiological equivalent temperatures (PET)33 are derived to describe the thermal stress experienced by a person. PET is a rational thermal index based on the heat balance of the human body, which summarises the effects of all relevant meteorological quantities on heat stress into one value.
Besides the meteorological data, measurement results for air pollution have also been obtained: Daily mean values for concentration of nitric oxide (NO), PM10 and O3 were retrieved from the same airport station.34 To account for the ED visits, which occurred at the beginning of January 2013, additional environmental data from December 2012 were used. Table 1 lists the meteorological factors, data on air pollutants per day and medical indications that were considered in our model.
Statistical analyses
To account for seasonality, the variable ‘season’ was computed by using the respective months (table 1) and considered for statistical analyses. Additionally, the variable ‘running day’ was included as a linear, quadratic and cubic term to account for a potential continuous time trend; furthermore, we included the year of ED visits. We also assumed the day of the week as a variable potentially explaining ED visits. We examined correlations between the environmental and the temporal variables season, year and day of the week. Additionally, relationships among environmental variables were examined by Pearson and Spearman correlations and by non-linear categorical principal component analysis (CATPCA, table 1),35 36 considering a three-dimensional solution and applying a Promax axis rotation. The estimated component scores were used as continuous variables in further analyses, instead of the original environmental variables. Two different sets of environmental conditions were tested in the CATPCA: one with PET, excluding temperature, and one with temperature, excluding PET and the remaining environmental variables, respectively. We used two different sets, since PET already includes the effects of the environmental variables on the thermal stress experienced by the human body (see above) and shows highest correlation with temperature. To model temporal associations between the number of respiratory ED visits and the variables obtained from the CATPCA, the cross-correlation functions between the time series of the respective daily environmental factors and daily ED visits were analysed. A time lag of up to 7 days prior to the admission data was chosen.8 37 Environmental variables at time lags displaying peak correlations with the dependent variable were used as covariates in general linear model analyses (SPSS routine UNIANOVA) to estimate respiratory ED visits based on environmental data, day of the week, a linear, quadratic and cubic term of running day, year and season as covariates as well as interaction terms between these variables. As a measure of association between a covariate and the respiratory health endpoints, the respective regression coefficient B, along with estimated partial eta-square (ƞ2) of the UNIANOVA model was calculated. Regression coefficients are shown with their 95% CI and p values. The adjusted R2 was provided as a measure of overall goodness-of-fit of the statistical model. In a further step, a stepwise hierarchical-backward elimination regression approach38 was applied. Criterion for inclusion of an independent variable in the final model was p<0.05. To check stability of our results, we also conducted analyses using only the environmental variable, which had highest positive loadings on a factor computed by the CATPCA, respectively, together with the temporal variables. An autocorrelation function of the residuals of the final model was examined to verify that the residuals were not significantly autocorrelated. The IBM SPSS Statistics 25 program was used for calculations.
Results
In total, 11 820 respiratory ED visits (7777 COPD and 4043 Asthma bronchiale) were recorded during the study interval of 3 years (January 2013– December 2015, 1095 days).
As expected, all meteorological variables were significantly correlated with season (Spearman rank correlation, all p values <0.001), no pattern was found with day of the week. Furthermore, the year of investigation was significantly associated with all meteorological variables (data not shown). The environmental data describing air pollution resulted in different patterns where NO showed highly significant correlations with season and PM10 with day of the week (all p values <0.001). O3 showed no significant correlation with any temporal variable (table 2).
Correlation coefficients of the cross correlation function between air pollution and temporal variables using Spearman rank correlation
Because PET is calculated from temperature data and to avoid that temperature enters the CATPCA more than once, two analyses were conducted. The CATPCA with PET considered resulted in slightly higher variances explained by the nine original variables compared with the CATPCA where T and the respective environmental variables were included (Total (Eigenvalue)=7.66 compared with Total (Eigenvalue)=7.63). Hence, the results of the CATPCA, which included PET were considered for further analyses. The following nine daily variables entered the CATPCA: PET (mean, maximum and minimum), mean relative humidity, mean vapour pressure, mean wind speed as well as concentrations of NO, PM10 and O3. The results of the CATPCA are presented in table 2. The CATPCA resulted in three main components: Factor 1 showed high positive loadings at the variables ‘PET’ (mean (0.98), maximum (0.93) and minimum (0.97)) and ‘mean vapour pressure’ (0.97) and therefore was associated with thermal conditions; for example, cold stress in winter and heat stress in summer and moderate conditions in between. Factor 2 showed high negative loadings at the variable ‘mean relative humidity’ (−0.92) and high positive loadings at the variable ‘ozone concentrations’ (0.89) and hence was associated with dry conditions together with high ozone levels. Finally, factor 3 showed high positive loadings at ‘NO concentrations’ (0.79) and ‘PM10 concentrations’ (0.70) and high negative loadings at ‘mean wind speed’ (−0.80) and hence was associated with high air pollution (table 3, respective numbers in bold).
Results from the categorical principal component analysis
By using a histogram, clumping and truncation were checked (data not shown). The distribution of the respective scores showed internal coherence, suggesting appropriate and sufficient choice of environmental variables.
Results from the cross-correlation functions between the time series of the respective factors obtained from the CATPCA and daily ED visits showed highest peaks of the cross-correlation functions at the same day (time lag=0 days) for all three factors (data not shown).
The results from the UNIANOVA models are shown in table 4. In the initial model, a significant main effect on respiratory ED visits could be detected for the day of the week (p<0.001). We found a clear weekly pattern with highest numbers of ED visits on Mondays (B=10.59; p<0.001) and lowest numbers on weekends (Sunday: B=1.09, p<0.001; Saturday (reference day) B=0). For Mondays, the ƞ2, which describes the proportion of the variability in the ED visits that is attributable to the day ‘Monday’, was 0.330. Hence, 33% of the explainable variability of the respiratory ED visits can be attributed to the variable ‘Monday’, followed by approximately 25% by the variable ‘Tuesday’ (ƞ2=0.250, table 3). The variable ‘running day’ entered the model as a third degree polynomial with all terms (linear, quadratic and cubic) being highly significant (B=−0.02, p=0.002; B=3×10⁻⁵, p=0.006; B=−2×10⁻⁸, p=0.002, respectively) and indicating a non-linear effect over time. Furthermore, the results also indicate that respiratory ED visits significantly increased over the 3-year study period (variable ‘year’, table 3). The variable ‘season’ as well as the three environmental factors obtained from the CATPCA did not result in any significant effect on ED visits in the initial regression model. Only one significant interaction, ‘spring’ together with ‘high ozone levels’ (factor 2), could be found (B=−1.03, p=0.022). The determinants showing the least significant effects were successively excluded in a stepwise regression model to obtain a parsimonious regression model containing only significant independent variables. The first variable excluded was ‘factor 1’, followed by ‘factor 3’, and finally ‘factor 2’.
Associations between determinants and respiratory emergency department visits*
In the final model, the results showed again main effects of ‘day of the week’ on ED visits (explaining up to 33% of the explainable variability of the respiratory ED visits with the variable ‘Monday’ (ƞ2=0.333)). Furthermore, the variable ‘season’ was now significant with winter, spring and summer recording significantly fewer ED visits compared with ‘autumn’ (winter: B=−1.46; ƞ2=0.011; p=0.001; spring: B=−1.28; ƞ2=0.008; p=0.004; summer: B=−0.86; ƞ2=0.005; p=0.023). The study year again showed highly significant increases in respiratory ED visits (year 2013: B=−6.38; ƞ2=0.023; p<0.001; year 2014: B=−3.43; ƞ2=0.020; p<0.001; year 2015 (reference year) B=0). Finally, the variable ‘running day’ (linear, quadratic and cubic) indicated again a significant nonlinear effect over time (all p values <0.05).
The final model explains 47% of ED visit variation (adjusted R2=0.47) (table 3).
To check stability of our results, we also conducted the analysis by using only the environmental variable, which had highest positive loadings on a respective factor computed by the CATPCA (table 3) together with the temporal variables. Hence, the variables PET mean instead of factor 1, O3 concentration instead of factor 2 and NO concentration instead of factor 3 entered the UNIANOVA model. However, the stepwise regression model resulted in the same final model with only temporal variables included.
Discussion
The analysis of the respiratory ED visits in the University Medical Center Hamburg-Eppendorf during the study interval of 3 years (January 2013–December 2015) clearly indicated a strong association between the day of the week and hospital admissions, showing a pattern with high numbers of ED visits at the beginning of the week and low numbers on weekends. Additionally, the variable ‘season’ showed significant contributions to explainable variability of respiratory ED visits in the final model and depicted lowest numbers of ED visits in winter. The association between respiratory ED visits and the variable ‘running day’ (linear, quadratic and cubic) indicated a significant non-linear time trend suggesting increasing numbers of ED visits during the study interval. These results are supported by the variable ‘year’ showing increasing numbers of respiratory ED visits during the study interval of 3 years. No direct associations between any factors obtained by the CATPCA could be detected in the final UNIANOVA model.
The direct association of day of the week and hospital admissions is congruent with other studies reporting similar variations in hospital admissions with highest numbers of emergency visits early in the week and reduced numbers on Saturdays and Sundays.39 40 Most patients are aware of the reduced numbers of medical and nursing staff during weekends and resulting possible longer waiting times for patients not being classified as emergency patients. Therefore, patients with no acute respiratory disease might avoid EDs during weekends but go instead on Mondays. A further explanation for higher numbers of ED visits during the week might be the location of the hospital where the study was conducted. The University Medical Center Hamburg-Eppendorf is one of the largest hospitals and centrally located in the city of Hamburg (figure 1). Due to the working population during the week, the intraurban population in the surrounding area of the hospital is higher than on weekends, which might result in rising numbers of ED visits. However, no data on the exact time of admission was available; hence, we cannot examine if an ED visit possible occurred during work hours. The working population might also explain the high correlations between the day of the week and PM10 as shown in the Spearman rank correlations. Many people commute during the week to work by using their car, which hence, influences the PM10 concentrations.
Additionally, the variable ‘season’ showed significant associations with respiratory ED visits in the final model showing the highest effect in winter and significant less ED visits compared with autumn.
As expected, all meteorological factors showed highly significant correlations with season. Furthermore, NO was highly correlated with season. This is in line with other studies: The German Environment Agency (Umweltbundesamt), for instance, published a study showing increasing NO emissions with decreasing temperatures.41 Same results were found in a study conducted in a city located in Southern Germany.42
Other seasonal cofactors such as allergen pollen (spring/summer) or influenza season (winter) might be associated with the number of respiratory ED visits, as it has been investigated in other studies: the temporal association between the increased occurrence of airborne pollen concentrations and increased respiratory diseases was investigated in several studies. Brunekreef et al,43 for instance, found strong associations between the day-to-day variations in pollen concentrations and that of deaths due to COPD and pneumonia. Results from the second National Health and Nutrition Examination Survey suggest strong associations and interactions of specific allergens with upper and lower respiratory diseases.44 Additionally, studies found strong associations between the occurrence of seasonal influenza and increased hospitalisations for respiratory health outcomes.45 46 However, no data on airborne pollen concentrations or data on influenza infections were available for the city of Hamburg and hence could not be adjusted for our model. Furthermore, holiday season might influence the occurrence of ED visits. During summer time, for instance, more people are likely to travel, especially when they have school-age children, which might result in possibly lower numbers of ED visits.
To check stability of our model, we also conducted the analyses by using the variable ‘months’ (January–December) instead of the variable ‘season’ (winter, spring, summer and autumn). However, we obtained similar results showing less numbers of ED visits during winter months and higher numbers of ED visits during summer months. However, no significant interactions between ‘months’ and any of the three environmental factors could be found and the adjusted R2 was slightly less (0.45 compared with 0.47 at the model were ‘season’ was considered). Hence, the variable ‘season’ remained in the final model.
Our results showed a significant independent time trend (variables ‘running day’ and ‘year’) which suggests an increase in respiratory ED visits, possibly forecasting a trend of increasing numbers of respiratory diseases. According to the WHO, an increasing amount of people is of greater risk to acquire respiratory disease due to an unhealthy lifestyle (eg, smoking, no physical activity47). For instance, data (year 2015) provided by the Robert-Koch-Institute in Germany suggest that only about two-fifths of adults in Germany comply with the WHO’s exercise recommendations.48
Furthermore, the Association of Statutory Health Insurance Physicians Hamburg (Kassenärztliche Vereinigung Hamburg) report an increasing trend of patients going directly to the ED instead of going to a physician as demanded by the German health system. Patients hope to find better and prompt medical support by going directly to the hospital.49 50 This negative trend is already recognised and several projects such as the ‘doctor’s call Hamburg’ (Arztruf Hamburg) are implemented to counter this trend. By calling a specific number, patients can receive telephone advice from a physician. Besides a reduction of the ED visits, the concept also helps to reduce the potentially high costs of medical care in hospitals compared with the costs of medical care in medical practices.50
A further explanation for higher numbers of ED visits might be an increasing awareness of people for respiratory diseases due to programmes such as the ‘Global Initiative for Chronic Obstructive Lung Disease (GOLD)’51 or the ‘Global Alliance Against Respiratory Disorders (GARD)’ project.52 Apart from strategies for diagnoses and management, one main goal of this initiatives is to prevent COPD and asthma by increasing awareness in the general public.51 52 Furthermore, the population of the city of Hamburg increases to approximately 40 000 people per year.30 In addition, data show an increasing amount of people aged 65 and older,29 which also might explain the increasing numbers of respiratory diseases.
To account for multicollinearity, a CATPCA was conducted. A PCA is a multivariate statistical technique used to reduce dimensionality in a data set while preserving maximum variability of the included covariables, which allows the highly correlated variables to be grouped into a regression model.53 54 An advantage of a PCA is that it reduces the complexity of correlated data. On the other hand, the process of generalisation leads to a loss of information, the criteria for the selection of variables for PCA are not well defined and the number of selected components or the type of rotation (if any) is arbitrary. Whether a single principal component can sufficiently determine an environmental variable as conducted in this study is entirely dependent on the data and the correlation matrix of the variables, their validity and reliability.53 55 To consider the high correlations between the environmental covariables (p<0.001), conducting a PCA was the appropriate choice and is in line with other studies.56–58 In the analyses of the present study, none of the environmental factors obtained by the CATPCA showed significant associations with respiratory ED visits in the final UNIANOVA model.
Many studies demonstrate a significant temporal trend of temperatures or thermal stress on adverse health effects.10–13 Due to the simulated consequences of global warming and the projected increased frequency and intensity of heatwaves,9 heat-related morbidity and mortality may increase.59 However, Hamburg has a maritime and mild climate, although heat stress conditions became more frequent in recent years.60 Heatwaves are less frequent compared with other more continental or southern cities. Therefore, longer time series or extreme value statistics might be needed to appropriately consider the impact of heat stress in Hamburg. Additionally, only environmental data from one weather station close to the airport was used. Due to its characteristics and location, the measurements at the airport station might be different from those conditions experienced by the patients admitted to the hospital. In future, environmental data on the micro level shall be collected and used for further analyses.
In times of rapid urbanisation accompanied by increases in respiratory diseases, increases in ED visits, temperature and air pollution, analyses such as ours can help focus future studies and enhance strategies to reduce increasing numbers of respiratory diseases and ED visits. Because of the potential higher costs of medical care associated with ED visits compared with physicians, public health concepts and recommendations for reducing the increasing ED visits should be further promoted and evaluated, as it is already been implemented in Hamburg.50
Acknowledgments
We thank Phillip Mannweiler from the University Medical Center Hamburg-Eppendorf for providing us with the data of emergency department visits for respiratory diseases. The German Meteorological Service and the Institute for Hygiene and Environment provided all environmental data. The program to estimate the mean radiant temperature from meteorological measurements was provided by Henning Staiger. Additionally, we would like to thank Sara Tiedemann, Pia Dahlhoff, Rebecca Malsam and Mario Gehoff as part of the scientific communication team of the IVDP for copy editing.
References
Footnotes
Contributors ACK, JA, MA, PH and JF conceived and designed the study. ACK, HP and CS performed and analysed the data. JF contributed materials. ACK, JA, PH, JF, HP and CS wrote the paper.
Funding The authors have not declared a specific grant for this research from any funding agency in the public, commercial or not-for-profit sectors.
Competing interests None declared.
Patient consent Not required.
Provenance and peer review Not commissioned; externally peer reviewed.
Data sharing statement Data can be requested from the author.