Article Text

Abstract
Purpose Disturbances, such as in-room activity and sound, are significant sources of sleep disruption among critically ill patients. These factors are potentially modifiable. We tested the impact of an intensive care unit (ICU) sleep promotion protocol on overnight in-room disturbance.
Methods Our protocol restricted non-urgent bedside care from 00:00 to 03:59. Patients were assigned to usual care (n=30) or the sleep protocol (n=26). The primary outcomes were measures of in-room activity, sound and light. These three types of disturbance were compared between arms during a baseline time block (20:00–23:59) and a rest time block (00:00–03:59). We assessed the sleep protocol effect with generalised linear models.
Results Usual care and sleep protocol patients had equivalent levels of in-room activity, sound and light during the baseline time block (20:00–23:59). In contrast, during the rest time block (00:00–03:59), the sleep protocol arm had 32% fewer room entries (rate ratio (RR) 0.68, p=0.001) and 9.1 fewer minutes of in-room activity (p=0.0002). Also, the length of time between room entrances increased from 26.4 to 45.8 min (p=0.0004). The sleep protocol arm also had lower sound during the rest time block. Mean A-weighted sound was 2.5 decibels lower (p=0.02), and there were 36% fewer peaks (RR 0.64, p=0.02). Light levels were highly variable and not changed by the sleep protocol.
Conclusions Sleep promotion protocols can improve in-room activity and sound. This provides a better sleep opportunity and may, therefore, improve ICU sleep.
Trial registration number 1112009428
- sound
- light
- lux and sleep
- delirium
- critical illness
- intensive care unit
This is an open access article distributed in accordance with the Creative Commons Attribution Non Commercial (CC BY-NC 4.0) license, which permits others to distribute, remix, adapt, build upon this work non-commercially, and license their derivative works on different terms, provided the original work is properly cited, appropriate credit is given, any changes made indicated, and the use is non-commercial. See: http://creativecommons.org/licenses/by-nc/4.0/.
Statistics from Altmetric.com
Key messages
Can an overnight sleep promotion protocol provide critically ill patients with a better sleep opportunity?
This sleep promotion protocol can significantly improve in-room activity and sound.
Sleep promotion protocols, such as this one, which cluster and reschedule care, are inherently difficult to implement; this work demonstrates the significant environmental impact that is possible.
Introduction
Sleep and circadian disruption may contribute to intensive care unit (ICU) delirium,1 which is associated with higher mortality, long-term impairment of cognitive function and increased length of ICU and hospital stay.2–6 Acute sleep deprivation has also been linked to impairments in immune function, metabolic function, cardiovascular function and skeletal muscle function.7–10 Such impairments in multiple organ systems add to allostatic and physiologic stress that patients experience in the hospital as they attempt to recover from the effects of the original acute illness.11 Environmental factors, such as in-room activity, sound and light, are key sources of the disruption of both sleep and circadian rhythm among critically ill patients.12–15 Because these domains are modifiable, they represent important therapeutic targets for improvement of sleep, promotion of circadian rhythmicity and improved ICU outcomes.
Overnight bedside care disrupts the sleep of ICU patients.16 17 Retrospective chart reviews have demonstrated averages of 43 and 51 nocturnal care interactions per patient-night.16 18 Average ICU sound levels are between 43 and 66 decibels on the A-weighted scale (dBA)15 19–21 with peak sound levels ranging between 80 and 90 dBA.15 19 20 22–26 The WHO recommends limiting hospital sound averages to 30 dB and sound maxima to 40 dBA.27 In addition, abnormal light exposure in hospitalised patients is a significant source of sleep disruption.28 Day–night light patterns are the most potent cue for the entrainment of circadian rhythms29 as well as being key determinants of the timing and quality of sleep.30 Studies reveal a common pattern in ICU light levels: dim overnight light punctuated with multiple brief exposures to bright light; and low daytime light levels that are insufficient to promote normal circadian entrainment.
Patients, clinical staff and hospital administrators share a growing awareness that sleep is severely disrupted among hospitalised patients, and this may represent an important target to improve recovery.31–33 Nonetheless, there remains a large gap between this awareness and the implementation of nocturnal sleep promotion protocols.31 Current critical care guidelines for the prevention of delirium in critically ill patients emphasise sleep promotion with multidisciplinary approaches that address the modifiable disruptors of sleep in the ICU.34 35
The objective of this study was to investigate the environmental effects of an overnight sleep promotion protocol designed to reduce non-urgent bedside care during a designated rest time from 00:00 to 03:59. We hypothesised that patients assigned to the protocol would be exposed to lower levels of in-room activity, sound and light during the rest time block.
Materials and methods
Setting
The study was conducted in a 38-bed medical ICU (MICU) of an academic, tertiary hospital. This MICU admits over 3000 patients per year. There is a hospital-wide quiet protocol in place from 23:00 to 06:00 in which hallway lights are dimmed, and overhead pages are limited. All patients receive a quiet pack with earplugs, an eye mask and television headphones. All patient rooms are private with three solid walls and one glass wall, which includes the room doorway.
Patients
Patients admitted from home ≤24 hours prior to 23:59 on the day of enrolment were eligible. Patients were excluded if they were expected to die in the next 24 hours, receiving comfort care only, undergoing therapeutic hypothermia or expected to be transferred from the MICU before the first overnight environmental monitoring period. This study was registered with ClinicalTrials.gov.
Patient and public involvement
The development of the research question and outcome measures were informed by patient comments during preprotocol interviews.32 Patients were involved in protocol development; patients were not involved in study design, recruitment to or conduct of the study.36 Results will be not be disseminated directly to study participants; study participants were notified of this limitation in the consent process. The burden of the intervention was not assessed by patients.
Randomization
This study had a parallel group assignment. Patients were enrolled and then underwent simple randomisation (1:1) via a random order generator to either the usual care or the sleep protocol.
Sleep protocol
The sleep promotion protocol restricted non-urgent bedside care between 00:00 and 03:59 every night from enrolment through MICU discharge. The protocol has been described in detail previously.36 Briefly, the protocol was implemented on an individual patient basis with the patient’s nurse serving as the ‘gatekeeper’. All routine care, medications and diagnostic tests were scheduled before or after the 00:00–03:59 rest time block. Urgent or time-sensitive care that could not occur outside of the rest time block was clustered to minimise the frequency and length of room entrances between 00:00 and 03:59.
Clinical data collection
Medical, social and sleep history were obtained via detailed interviews. We extracted clinical data about the current ICU admission from the electronic medical record and included the following: reason for ICU admission, mechanical ventilation, vasopressor need and severity of illness. Delirium was ascertained daily with the Confusion Assessment for the ICU scale.37 Mechanical ventilation was defined as the use of invasive or non-invasive ventilation for at least 1 hour during the overnight period of environmental monitoring. Vasopressor use was defined as the use of any of norepinephrine, epinephrine, neosynephrine, dopamine or vasopressin for at least 1 hour during the period of environmental monitoring. Severity of illness was described by the Acute Physiology and Chronic Health Evaluation II (APACHE II) score according to the published algorithm.38
Outcomes: in-room activity, sound and light
For all outcomes, we calculated mean values for every hour between 20:00 and 11:59 the following day for up to three nights following enrolment. We aggregated mean hourly values for the following time blocks: 20:00–23:59 (baseline), 00:00–03:59 (rest), 04:00–07:59 and 08:00–11:59.
In-room activity was obtained with time-stamped, motion-activated, videography focused on the door of the patient’s room. When single or multiple persons entered the room, we scored a timestamped ‘room entry’. When the last person (other than the patient) exited the room, we scored a timestamped ‘room exit’. The time between ‘room entry’ and ‘room exit’ was used to calculate the average length of room entrances and the number of minutes per hour that a room had activity. In addition, we measured the time between each ‘room exit’ and the next ‘room entry’ to calculate the average length of rest between room entrances.
We measured sound levels with two sound meters placed at the head of the bed (SDL600, Extech Instruments, Nashua, NH, USA). The meters recorded sound equivalent levels (Leq) every 10 s either on a dBA or decibels on the C-weighted scale (dBC) as previously described.15 dBA Leq reflects the sound levels most readily heard by the human ear; dBC Leq reflects a wider range of sound frequency and better captures low-frequency sound, such as that made by air handlers and ‘electronic hum’. The sound Leq reflects the mean amplitude or sound pressure over a defined interval (10 s). For each patient, a mean and maximal Leq per hour was calculated. Hourly counts of sound peaks were also calculated. We defined peaks as a measurement greater than 5 dB above the mean Leq level during the 5 min period centred around the index measurement.
We measured light levels with a single light meter (SDL400, Extech Instruments) that recorded lux every 10 s. Light metres were placed on the wall at the head of the patient’s bed and at the angle of the patient’s gaze. Consistent with the sound measurements, mean and maximal light levels were calculated on an hourly basis. Light peaks, defined as a single reading greater than 250 lux, were counted per hour.
Statistical analysis
Continuous clinical and demographic characteristics were described with means and SD, and categorical data were described with frequencies.
The effects of the sleep protocol on continuous disturbance outcomes were evaluated with simple linear regression on treatment assignment, time block and their interaction, which enabled the estimation of time block-specific effects (ie, mean effect for continuous variables and rate ratios (RRs) for count variables) as well as least-square means (LSMs). The LSM represent the mean levels of a given outcome in its original scale and complement the effects directly estimated from each model, for example, adjusted minutes of extra rest versus the RR from a count model. For count variables, the effect of the sleep protocol was tested using unadjusted negative binomial regression. For all outcome types, the within-person correlation was addressed using generalised estimating equations with an autoregressive correlation structure. Data analyses were performed with SAS software V.9.4. Statistical significance was defined as a p value less than 0.05.
Results
Patient characteristics
We assessed 263 patients for participation. A total of 207 were excluded, most frequently because of anticipated MICU transfer within 24 hours (n=86). In total, 56 patients were enrolled and randomised to usual care (n=30) or sleep protocol (n=26). The mean age of enrolled patients was 62.5 years (SD 16.4); 24% were non-white; 62% were women and the mean APACHE II score was 19.1 (SD 6.2) (figure 1 and table 1).
Patient clinical and demographic characteristics
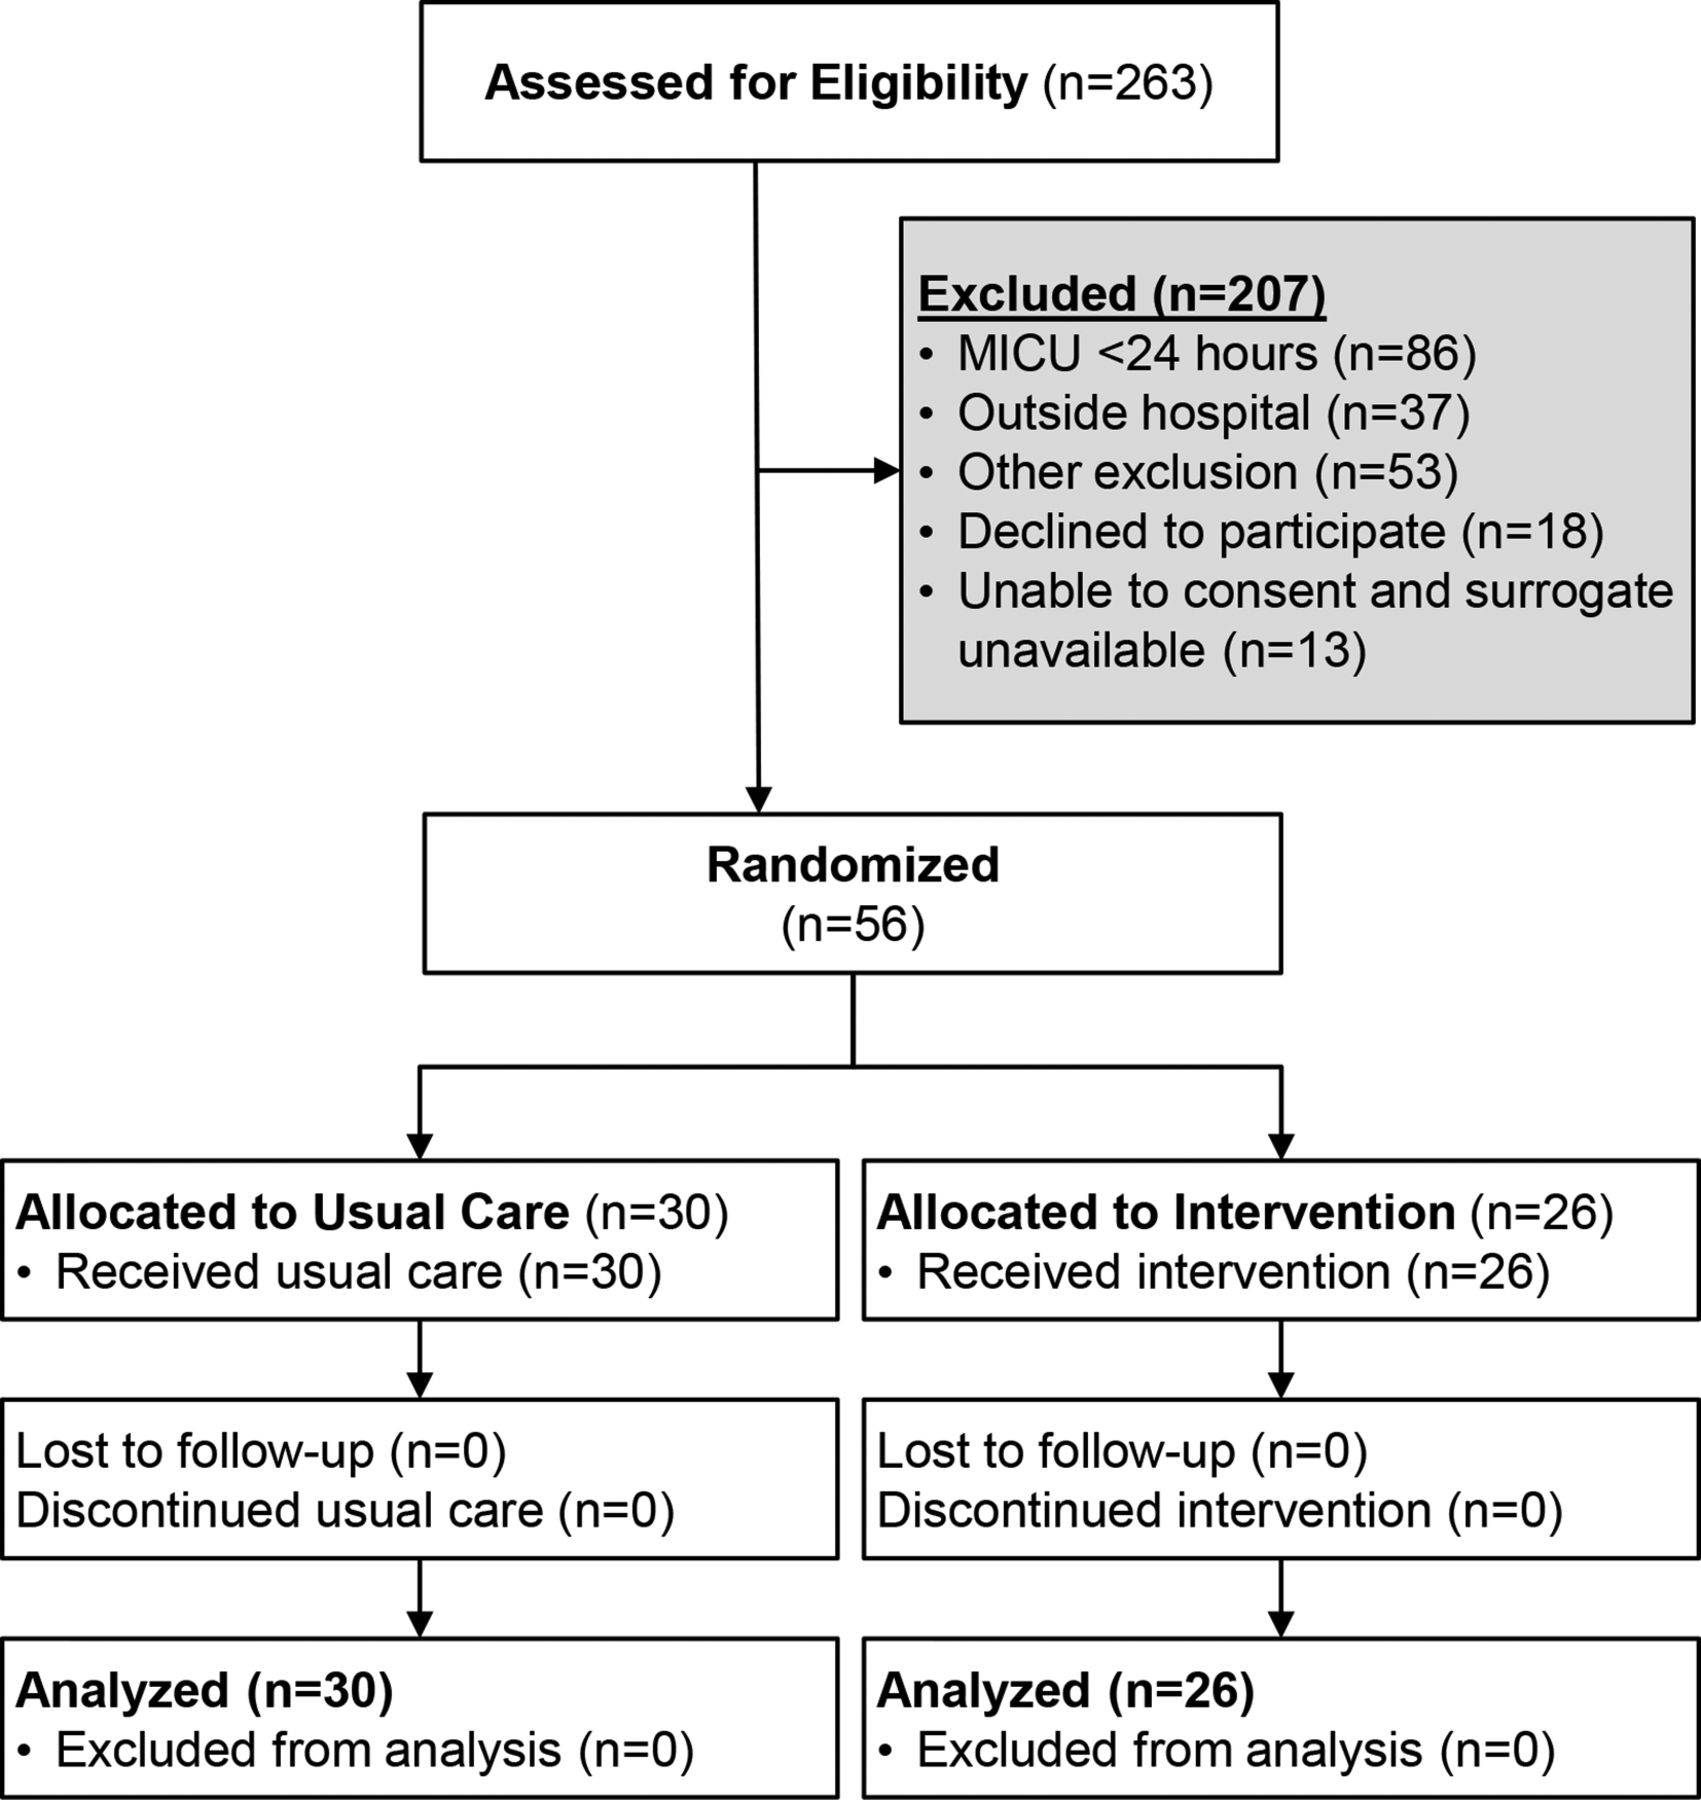
Consort diagram. MICU, medical intensive care unit.
In-room activity
Model-generated LSMs of hourly measures of in-room activity are depicted in figure 2. During the baseline time block, there is no statistical difference between study arms in any of the activity outcomes. During the rest time block, there are statistically significant differences for all activity outcomes. Panel A shows that the sleep protocol arm had on average 1.4 entrances per hour while the usual care arm had an average of 2.1 entrances. This corresponds to a RR of 0.68 (p=0.001). Panel B shows that the sleep protocol arm had an average of 9.6 min per hour of in-room activity compared with 18.7 min for the usual care arm. This corresponds to a mean hourly reduction of 9.1 min of in-room activity (p=0.0002). Panel C shows that mean duration of room entrances in sleep protocol arm was 5.9 min compared with 8.8 min for usual care, corresponding to an average hourly reduction of 2.9 min per room entrance (p=0.02). Panel D shows that the mean time between entrances for the sleep protocol arm was 45.8 min and 26.4 min for usual care, corresponding to an hourly mean increase in rest time of 19.4 min (p=0.0004). Unadjusted data for all measures of in-room activity are presented in online supplementary table 1.
Supplemental material

Room activity variables as recorded by videography of the room door. For each variable, least-square mean estimates are presented for the usual care and sleep protocol arms. ‘ ’ and ‘
 ’ indicate usual care; ‘
 ’ and ‘
 ’ indicate sleep protocol. Filled-in shapes and ‘baseline’ indicate the 20:00–23:59 time block while open shapes and ‘rest’ indicate the 00:00–03:59 time block. Error bars indicate the 95% CIs. (A) Estimates of count of entrances per hour. (B) Estimates of minutes per hour of in-room activity. (C) Estimates of duration of room entrances. (D) Estimates of length of time between room entrances. (**) indicates p value<0.005 and (*) indicates p value<0.05 from the respective interaction terms between time block and arm from either simple linear regression or unadjusted negative binomial models.
Sound levels
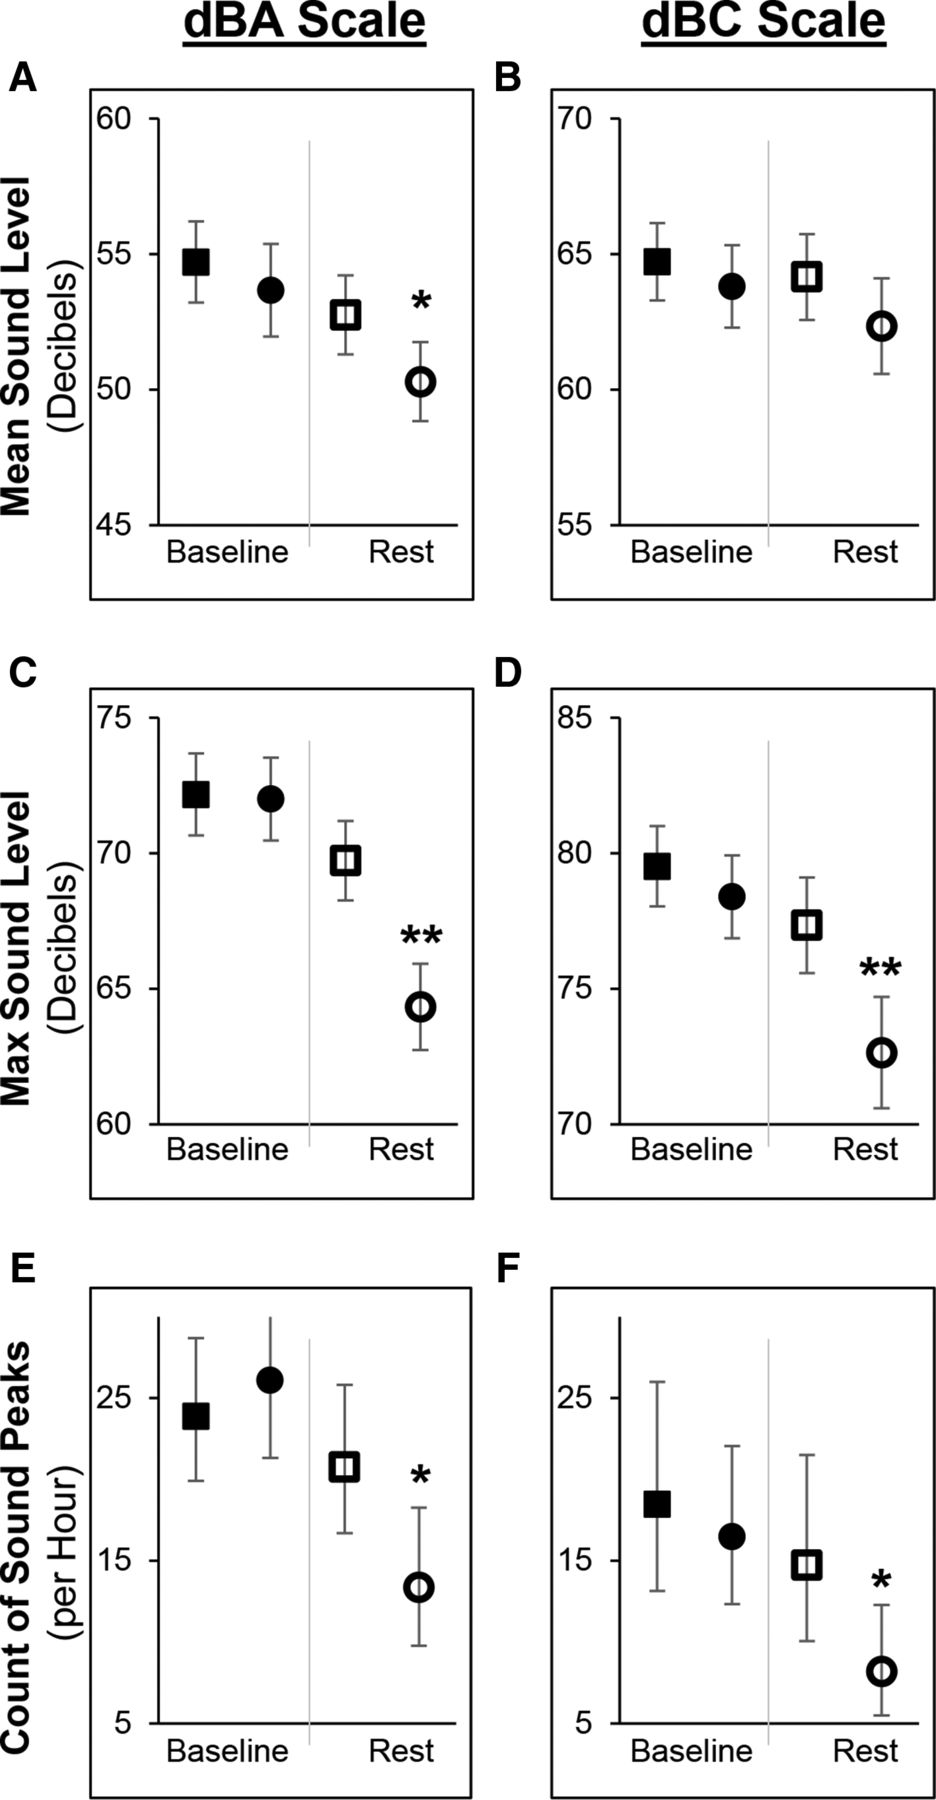
Model-generated LSM estimates of sound outcomes are shown in figure 3; each column presents results from one of the two sound scales measured, dBA (left) and dBC (right). There is no statistical difference between study arms for sound outcomes in the baseline time block. There are statistically significant differences between study arms for most sound outcomes on both scales in the rest time block. Panel A shows there was a mean sound level of 50.3 dBA in the sleep protocol arm and 52.8 dBA in the usual care arm, corresponding to a reduction of 2.5 dBA (p=0.02). In Panel C, there was a mean maximum sound level of 64.3 dBA in the sleep protocol arm and 69.7 dBA in the usual care arm, corresponding to a reduction of 5.4 dBA (p<0.0001). In Panel E, there was a mean dBA peak count of 13.4 peaks per hour in the sleep protocol arm and 20.8 peaks per hour in the usual care arm. This corresponds to an RR of 0.64 (p=0.02). Panels D (mean maximum sound level) and F (count of sound peaks) show similar patterns of significant change in sound levels on the dBC scale; mean sound level on the dBC scale (panel B) was not different between arms. Sound levels on the dBC scale are approximately 10 dB higher than concurrent sound levels measured on the dBA scale in the MICU. Unadjusted sound data are presented in online supplementary table 2.

In-room sound levels recorded by sound metres on decibels on the A-weighted (dBA) and decibels on the C-weighted scale (dBC) scales. For each variable, least-square mean estimates are presented for the usual care and sleep protocol arms. ‘ ’ and ‘
 ’ indicate usual care; ‘
 ’ and ‘
 ’ indicate sleep protocol. Filled-in shapes and ‘baseline’ indicate the 20:00–23:59 time block while open shapes and ‘rest’ indicate the 00:00–03:59 time block. Error bars indicate the 95% CIs. (A and B) Estimates of mean sound level. (C and D) Estimates of maximum sound level. (E and F) Estimates of count of sound peaks per hour. (**) indicates p value<0.005 and (*) indicates p value<0.05 from the respective interaction terms between time block and arm from either linear regression or unadjusted negative binomial models.
Light levels
Light levels were highly variable and not changed by the sleep protocol. There was a trend towards lower maximum light levels during the rest time block with a mean maximum light level of 46.1 lux in the sleep protocol arm and 80.4 lux in the usual care arm (p=0.08). Unadjusted light data are presented in online supplementary table 3.
Discussion
In this pilot study, we tested the effects of a sleep promotion protocol on in-room activity, sound and light. We observed significantly reduced in-room activity and sound during the rest time block. This evidence that the ICU environment is modifiable is an essential step towards improving sleep quality for critically ill patients. Improved sleep will, by inference, promote circadian alignment and may also reduce delirium.
Data from our usual care arm are consistent with previous literature reporting high levels of in-room activity16–18 and sound.15 19–26 The finding that patients have an average of approximately 20 min at a time to rest illustrates the high level of disturbance that patients experience. Our sleep protocol increased this rest time to greater than 45 min. Regarding sound, there has been concern that reductions are not possible and that a significant proportion of sound is generated outside of patient rooms by either life support equipment or air-handling systems.15 39 40 This work demonstrates that sound reductions are possible, even in the context of an existing hospital-wide ‘quiet protocol’.
The sleep protocol did not significantly alter light levels. Light levels were highly variable during all time blocks and markedly lower during the middle of the night-time block in both study arms. It may be that hospital-wide light protocols have already mitigated this source of environmental disturbance. Of note, morning light levels were relatively dim. This is consistent with the existing ICU light literature showing a common pattern of dim overnight light with multiple, brief exposures to bright light, and low daytime light levels.21 41–43 This combination of low morning light levels coupled with high variability may have significant effects on sleep. Light is the most important circadian entrainment cue.29 Normal entrainment requires bright light exposure during the day (wake) period and dim or no light during the night (sleep) period. Daytime light interventions typically occur in the morning hours and deliver 2500–10 000 lux over intervals ranging from 30 min to several hours.44 45 During the night, short bursts of bright light (eg, even for 5 min) at relatively lower intensities (eg, 100–250 lux) can cause circadian abnormalities.46
Limitations of this study include a small sample size that may have precluded detection of some environmental changes, particularly for light variables. For the video data, we only observed the room entrance area; we could not assess the purpose or urgency of the room entrances. We did not track patient preferences regarding the room environment and, in the case of light, this may have influenced our results. Although we were unable to blind patients or study team members to the sleep protocol, our outcomes were based on objective measures of sound and light data, and investigators were blinded during video scoring of in-room activity. Because this study did not include objective sleep measurement, such as polysomnography, our outcomes were limited to environmental measures.
Conclusions
Our sleep promotion protocol decreased in-room activity and sound levels and may improve the quality of sleep. Provision of robust sleep opportunity is part of a multicomponent approach to improve ICU sleep and prevent ICU delirium. Future directions include large-scale implementation of a nocturnal rest time and subsequent measurement of patient outcomes, such as quantity and quality of sleep, days of delirium, length of stay in both the ICU and hospital, and mortality.
Acknowledgments
We acknowledge the dedicated MICU team who supported this sleep protocol and the MICU patients who participated in this study.
References
Footnotes
Presented at This work was performed at the Yale University School of Medicine and Yale-New Haven Hospital.
Contributors MPK designed the intervention, collected all data, contributed to the analysis and wrote the manuscript. MP, NR, and HY assisted with the design of the intervention, contributed to the analysis and revised the manuscript. TM, KA, and SJ designed the database and conducted analysis.
Funding This project was supported by the Yale Center for Sleep Disturbance (P20 NR014126). MPK received career development funds from the National Center for Advancing Translational Science (KL2 TR000140) and NHLBI (K23 HL138229). MP was supported by funds from the Patrick and Catherine Weldon Donaghue Medical Research Foundation. NR and SJ were supported by the Yale Center for Sleep Disturbance (P20 NR014126). TM and KA were supported by the Claude D. Pepper Older Americans Independence Center at Yale (P30 AG021342). HY was supported by a Midcareer Investigator Award in Patient-Oriented Research by the National Heart Lung and Blood Institute (K24HL132093).
Competing interests None declared.
Patient consent for publication Not required.
Ethics approval This work was approved by the Yale Human Investigations Committee (HIC # 1112009428).
Provenance and peer review Not commissioned; externally peer reviewed.
Data availability statement Data are available on reasonable request.