Article Text

Abstract
Background Despite increasing capacity to remotely monitor non-invasive ventilation (NIV), how remote data varies from day to day and person to person is poorly described.
Methods Single-centre, 2-month, prospective study of clinically stable adults on long-term NIV which aimed to document NIV-device variability. Participants were switched to a ventilator with tele-monitoring capabilities. Ventilation settings and masking were not altered. Raw, extensible markup language data files were provided directly from Philips Respironics (EncoreAnywhere). A nested analysis of variance was conducted on each ventilator variable to apportion the relative variation between and within participants.
Results Twenty-nine people were recruited (four withdrew, one had insufficient data for analyses; 1364 days of data). Mean age was 54.0 years (SD 18.4), 58.3% male with body mass index of 37.0 kg/m2 (13.7). Mean adherence was 8.53 (2.23) hours/day and all participants had adherence >4 hours/day. Variance in ventilator-derived indices was predominantly driven by differences between participants; usage (61% between vs 39% within), Apnoea–Hypopnoea Index (71% vs 29%), unintentional (64% vs 36%) and total leak (83% vs 17%), tidal volume (93% vs 7%), minute ventilation (92% vs 8%), respiratory rate (92% vs 8%) and percentage of triggered breaths (93% vs 7%).
Interpretation In this clinically stable cohort, all device-derived indices were more varied between users than the day-to-day variation within individuals. We speculate that normative ranges and thresholds for clinical intervention need to be individualised, and further research is necessary to determine the clinically important relationships between clinician targets for therapy and patient-reported outcomes.
- non invasive ventilation
- assisted ventilation
- clinical epidemiology
This is an open access article distributed in accordance with the Creative Commons Attribution Non Commercial (CC BY-NC 4.0) license, which permits others to distribute, remix, adapt, build upon this work non-commercially, and license their derivative works on different terms, provided the original work is properly cited, appropriate credit is given, any changes made indicated, and the use is non-commercial. See: http://creativecommons.org/licenses/by-nc/4.0/.
Statistics from Altmetric.com
Key messages
What is the key question?
How much normal variability is there in remotely monitored, clinically stable, users of non-invasive ventilation?
What is the bottom line?
Night-to-night variance differ across machine-derived indices and is predominantly different between, rather than within, people making it challenging to set clinically relevant ranges for normality.
Why read on?
To detect clinically important change in patients, clinicians must be able to differentiate signal (pathology) versus noise (normal day-to-day variability) and this paper provides unique normative data.
Introduction
Telemonitoring of ventilator data has been possible for over a decade, however, its uptake within clinical services that provide long-term assisted ventilation has been variable.1 Potential benefits of collecting and interpreting the device data include identification of poor adherence and conversely, increasing ventilator dependence, without sole reliance on notoriously unreliable self-report. Others have suggested that ventilator-derived data could be used to guide alterations to ventilator settings to optimise therapy.2 It is also possible that a change in ventilator-derived indices observed using remote monitoring could identify a deteriorating patient or a malfunctioning device, thus allowing for earlier clinical intervention.
While these benefits may potentially exist, implementing remote monitoring across a large population of users of assisted ventilation poses considerable risks1 From an administrative perspective, storing and accessing large volumes of ventilator data may overwhelm clinical services. It may also lead to a greater frequency of staff interventions, and critically, it is unclear whether changes in resource utilisation deliver better clinical outcomes.3
Clinical opinion articles have proposed how clinicians could use remotely monitored ventilator data to support users of long-term assisted ventilation,4 5 however, we are unaware of any papers that comprehensively detail the actual raw non-invasive ventilation (NIV) data collected from unselected cohorts at NIV initiation, during periods of clinical stability, or as disease progresses and respiratory capacity declines. As such and despite the increasing sophistication of device technology and improvements in mobile communications, little is known about the true clinical value of this remote monitoring. Most studies in users of long-term assisted ventilation have either involved complex supplementary technology in addition to the ventilator data,6 or have been limited by their study design and lack of clarity about how ventilator data were collected, reviewed and acted on.7
Limited literature is available that details how remotely obtained ventilator data relate to directly observed data, how much any of the derived indices vary from day-to-day and person-to-person, and how much change in any or all of the variables is associated with clinically meaningful change from a patient and/or clinician perspective. All of these issues present barriers to integrating remotely obtained ventilator data into routine clinical care. In order to effectively monitor data from multiple ventilators, centralised home ventilation services would need to use (or determine) clinical limits which should initiate an intervention. Limits that are too conservative would result in unnecessary interventions potentially increasing healthcare utilisation without obtaining a clinical benefit. Limits that are too liberal could result in missed opportunities to intervene for deteriorating patients. In most situations, it is unclear what amount of change in, for example, machine-estimated minute ventilation, is normal day-to-day variability versus a change that indicates clinical deterioration. This study, therefore, aimed to determine the technical feasibility of remote ventilator monitoring and to report observed ventilator-derived data in a cohort of stable users of domiciliary NIV.
Methods
A single-centre, prospective observational study was undertaken, enrolling adults who were clinically stable on long-term NIV.
Participants
Participants were recruited from the outpatient services of Austin Health, the statewide ventilation service provider for Victoria, Australia.8 9 Clinical stability was defined as stable adherence with NIV, lack of unplanned hospital admission within the prior 3 months, and no recent or planned changes to ventilator settings. Ventilation settings at NIV initiation were determined as previously described.10 We excluded those using invasive ventilation and those using any form of ventilation for greater than 16 hours a day. Patients or the public were not involved in the design, or conduct, or reporting, or dissemination plans of this research project; public and patient review of research is provided through membership of the local Human Research Ethics committee.
Intervention
Participants were switched to a ventilator with tele-monitoring capabilities (either Philips Respironics A30 or Philips Respironics DreamStation BiPAP) for 2 months. Phillips Respironics Australia provided NIV devices for the trial and downloads of the online participant data as ‘in-kind’ support. Phillips Respironics played no role in the design, analysis or reporting of the study. Ventilation settings were not altered, although depending on the prior model, minor adjustments were made to provide the equivalent amount of support. The interface (mask) was not changed. At the conclusion of the period of telemonitoring, users were switched back to their original device and a participant questionnaire was completed to confirm clinical stability and to record the participant experience during the observation period (online supplemental).
Supplemental material
Data collection and statistical analysis
Data were collected and stored using Philips Respironics’ proprietary web-based platform, EncoreAnywhere. Raw extensible markup language (XML) data files were provided directly from Philips Respironics. The raw (unprocessed) XML detailed daily averages of: tidal volume; respiratory rate; minute ventilation; total and unintentional leak (unintentional leak=total leak minus device estimated leak through the mask expiratory port(s)). The daily percentage of patient triggered breaths and the machine Apnoea–Hypopnoea Index per hour (AHI) were also listed in the XML file. Usage time within the raw XML was obtained from the ‘humidification on time’ data, the only daily time:date variable in the XML.
These ventilator-derived indices are illustrated graphically. Normally distributed demographic and ventilator index data are summarised as mean (SD or 95% CIs), and non-normally distributed data as median (IQR or range) as appropriate.
It was anticipated that day-to-day variability would be observed over time in the data. To explore how much variability was within versus between participants, a nested analysis of variance was conducted on each ventilator measurement variable to apportion the variation to between and within participants. The estimated variance components are reported in terms of their percentage contribution to the total model variation. Participants with fewer than 5 days of ventilator data were not included in the final analysis. Exploratory univariate correlations between ventilator indices were performed in the one participant with marked night-to-night variance (P03).
Results
One hundred and one patients were screened for enrolment between April 2018 and October 2019, 4 were ineligible and 29 agreed to participate in the study. Four did not tolerate the new ventilator and withdrew. Of those who withdrew, only one had more than 5 days of data. Two participants had failure of the data to record and/or be retrieved. Data from another four patients failed to upload remotely, however, manual retrieval and upload of ventilator data was possible at the end of the study period. No data upload issues were experienced with the newer ventilator model (Philips Respironics DreamStation BiPAP). Twenty-four participants’ data were included in the final analyses. One participant using the A30 did not use a humidifier, and thus no usage (time) data were available for analyses.
The mean age of analysed participants was 54.0 years (SD 18.4), with a male predominance (58.3%) and mean body mass index of 37.0 kg/m2 (13.7). The median length of NIV usage was 9.5 years (IQR; 15.2). Oro-nasal masks were used by 18 participants and nasal masks by 6. The most common indication for long-term assisted ventilation was obesity hypoventilation syndrome (41.7%), followed by neuromuscular (29.1%), restrictive chest wall (16.7%) and obstructive lung disease (12.5%). Participant numbers across diagnostic categories were too small for meaningful statistical analyses, but pulmonary and respiratory muscle function values reflected the diagnostic groups (table 1). Pressure support was set similarly across participants, but expiratory positive airway pressure (EPAP) was predictably higher in patients with obesity hypoventilation syndrome.
Demographics, spirometry, respiratory muscle strength and ventilator pressure settings of the study population
A total of 1364 days of ventilator data were obtained. All participants demonstrated a median daily usage of greater than 4 hours (figure 1 and table 2), with an overall mean adherence of 8.53 (SD 2.23) hours per day. The mean of the average daily unintentional leak was low at 13.2 L/min (8.9), with a mean average daily total leak of 46 L/min (13.2) (table 3). Means of daily average tidal volume, respiratory rate and minute ventilation were 414 mL (127), 18 breaths per minute (2.9) and 7.6 L/min (2.3), respectively. The ventilator-derived mean AHI was 3.6 (6.2), and the mean percentage of participant triggered breaths was 62% (34.1).

Distribution of all ventilator measurements collected for each of the 24 participants, grouped according to diagnosis. Each box and whisker plot shows the distribution of the daily averages of the ventilator measurements for every participant over the study period. Cross in box: mean, horizontal line in box: median, bottom border of box: first quartile (Q1), top border of box: third quartile (Q3), lower whisker line: local minimum, upper whisker line: local maximum, dots: outliers (>1.5 x IQR), light grey (P1–10): obesity hypoventilation syndrome, white (P11–17): neuromuscular, dark grey (P18–21): restrictive chest wall, dotted (P22–24): obstructive lung disease, blue: obesity hypoventilation syndrome, red: neuromuscular, green: restrictive chest wall, yellow: obstructive lung disease. *No usage data for P04.
Median daily averages of each ventilator index measurements by diagnostic group
Group ventilation indices across all participants, and the relative contribution of the variance between and within participants for each of the ventilator measurement indices
Within each participant, little day-to-day variation was observed in tidal volume, respiratory rate, minute ventilation, AHI and both leak measurements whereas usage and the percentage of patient triggered breaths varied more (figure 1). As summarised in table 3, variance in ventilator-derived indices was predominantly driven by differences between participants; usage (61% between vs 39% within), AHI (71% vs 29%), unintentional (64% vs 36%) and total leak (83% vs 17%), tidal volume (93% vs 7%), minute ventilation (92% vs 8%), respiratory rate (92% vs 8%) and percentage of triggered breaths (93% vs 7%). Despite usage across all participants having a 95% CI of 7.78 to 9.29 hours overall, the day-to-day variance within participants was moderately large as illustrated in the daily usage box plot in figure 1, where, as an example, participants P01, P02 and P03 had ranges (not including outliers) of 5.68 to 10.89 hours, 6.23 to 9.2 hours and 0.11 to 13.13 hours, respectively.
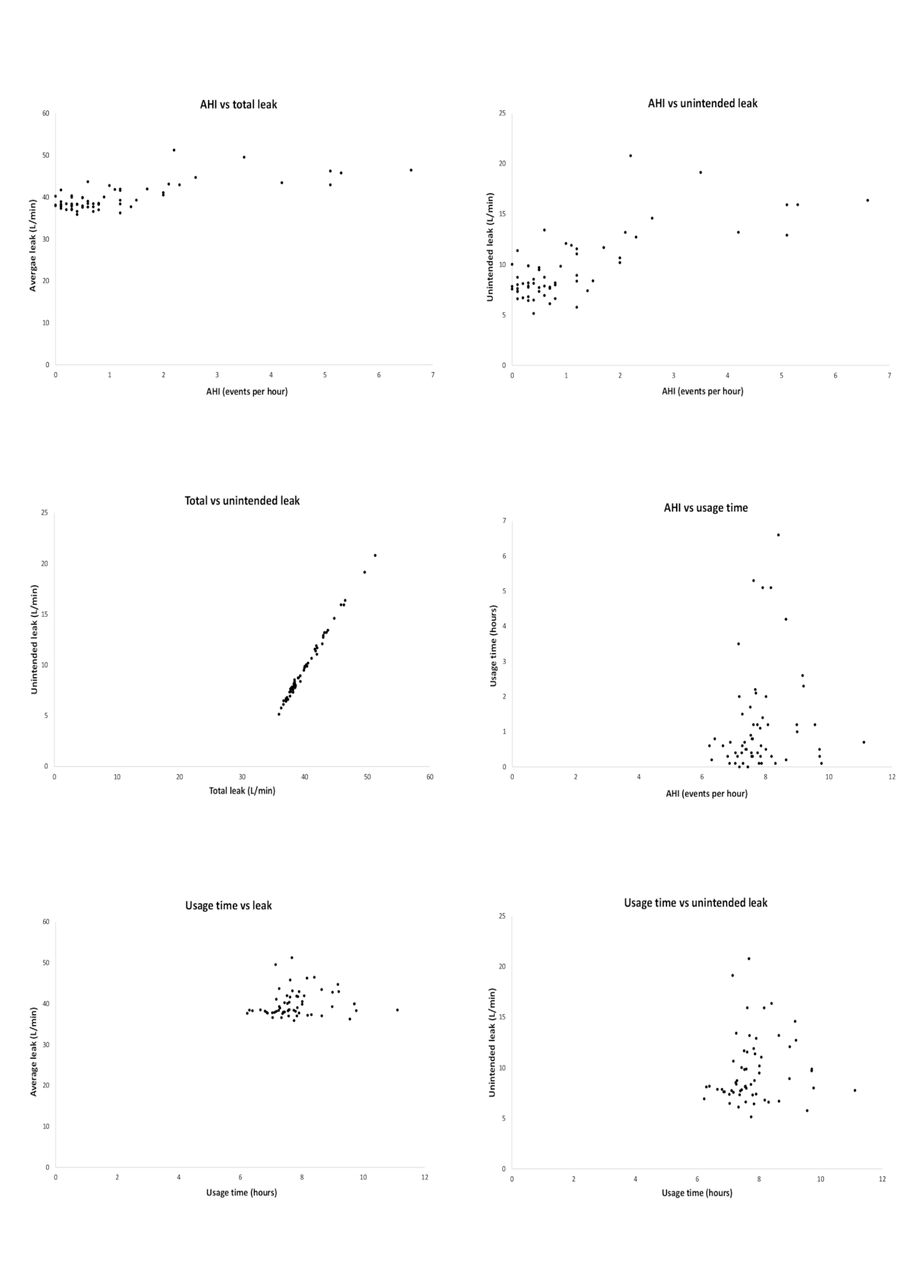
Individual variance was particularly apparent in participant P03 who demonstrated high total and unintended leak, high day-to-day variation in usage and an associated elevated AHI (figure 2), although mean use remained high at 7.03 hours. Univariate, pairwise correlations demonstrated that both total and unintentional leak were associated with higher machine-derived AHI but usage was not associated with any other index measure (AHI vs total leak, r=0.723 p<0.001; AHI vs unintentional leak, r=0.73 p<0.001; AHI vs usage, r=0.148 p=0.259; usage vs total leak, r=0.12 p=0.36; usage vs unintended leak, r=0.113 p=0.392; total vs unintended leak, r=0.997 p<0.001). This participant was prescribed higher absolute pressures than others, with an EPAP of 24 cmH2O and an inspiratory positive airway pressure of 28 cmH2O.
Illustrative scatterplots from Participant P03 (EPAP 24 and IPAP 28 cmH2O) who demonstrated high total and unintended leak, high day-to-day variation in usage and an associated elevated AHI yet still achieved an average nightly use of 7.03 hours overall. AHI, Apnoea–Hypopnoea Index; epap, EPAP, expiratory positive airway pressure; IPAP, inspiratory positive airway pressure.
Twenty-two out of 24 participants completed their poststudy questionnaire. Twenty had no change in respiratory symptoms over the 2 months; one patient had an ED presentation (figure 1 P10) and two (figure 1 P11 and P12) had inpatient admissions, all for non-respiratory reasons.
Discussion
This study has demonstrated that remote monitoring of stable, long term NIV is generally technically feasible (82% of available data were retrieved), especially with later generation devices. Importantly, device-derived summary indices exhibit substantial variance in value from day to day in a sample of clinically stable patients using NIV. Overall, day-to-day index variability was much larger between than within individuals and further, the summary indices themselves were variably variable. Variance in ventilator indices overall was predominantly driven by day-to-day differences between participants, but within the NIV indices themselves, usage, AHI, unintentional and total leak were relatively more variable within participants than tidal volume, minute ventilation, respiratory rate and percentage of triggered breaths (table 3 and figure 1). Figure 2 illustrates three important features of the relationships between these indices in a participant with the most overall index variance (and thus an example where the spread of the data allow for easier illustration); leak affected AHI, usage is unrelated to other indices and usage never dropped below 6 hours despite these high leak and AHI values.
Usage in NIV is related to clinically important outcomes. Reductions in arterial carbon dioxide (PaCO2) are largest in those who use continuous positive airway pressure for obstructive sleep apnoea the most.11 Similarly, Nickol et al12 demonstrated in a mixed cohort of neuromuscular and restrictive chest wall disease patients commenced on NIV that PaCO2 and daytime sleepiness (Epworth Sleepiness Scale) improved overall with NIV, but that individual improvement was driven by usage. A significant correlation was observed between change in both the PaCO2 and daytime sleepiness with a critical cut-off for benefit observable at 4 hours per night. Motor neuron disease, a rapidly progressive neurodegenerative disease, typically results in death due to ventilatory failure within 3–5 years. NIV in Motor neuron disease improves survival,13 14 shows dependence of benefit on tolerance15 16 and usage, with 4 hours per night similarly appearing to be a critical, clinically important, threshold.17 18 In the current cohort of clinically stable patients, usage was the most variable of any of the ventilator-derived indices, but importantly while variable as a measure from night to night, mean usage in all participants was above the clinically significant cut-off of 4 hours per night.
Unintentional mask leak is associated with NIV device triggering errors (both auto-cycling and triggering failure) and patient-ventilator asynchrony.19–22 Patient-ventilator asynchrony has been associated with reduced NIV usage23 24 and careful NIV titration with overnight polysomnography can change initially non-adherent NIV users into users of greater than 4 hours a night.10 In contrast to patient-ventilator asynchrony, machine-derived AHI is a difficult metric to interpret because it is typically calculated using proprietary algorithms that are not in the public domain. A machine-derived AHI has been shown to correlate well with polysomnography-derived AHI in obstructive sleep apnoea treated with continuous positive airway pressure therapy,25 and recently with polygraphy-derived AHI during NIV.26 27 An AHI generated during diagnostic polysomnography is based on agreed guidelines.28 Respiratory event scoring during NIV taxonomies have been proposed,29 but these are dependent on multiple signals, including mask pressure, flow, SpO2, abdominal and thoracic movements and are therefore unable to be generated from most NIV device signals alone. A machine-derived AHI during NIV is thus a ‘black-box’ index and while an association with unintended (and total) leak has face validity, the clinically important cut-off, responsiveness to mask fit changes is unclear.
In contrast with usage, machine-AHI and leak (unintentional and total), tidal volume, minute ventilation, respiratory rate and the proportion of patient triggered breaths were stable within participants. Adequate alveolar ventilation such that daytime normocapnia is achieved and symptoms optimised is a common treatment aim of domiciliary NIV treatment. Whether routine remote monitoring of NIV device-derived signals can assist to achieve this aim is unclear. Mansell et al reported on an uncontrolled cohort of stable NIV users in whom remote device monitoring was enabled.30 Clinical review aimed to ‘optimise minute ventilation (to achieve 8–10 mL/kg of ideal body weight), minimise leak and side effects’ and monitor subsequent usage. Unfortunately, setting, device and interface changes appear to have been made at both the time of transition to a new, remotely enabled NIV device and in the period after that change but before clinical review and data collection for analyses. As such, it is difficult to apportion the observed improvements in minute ventilation, leak and usage to the remote monitoring per se as opposed to the new device, setting and/or mask. Interestingly, improvements in usage were observed in the subset of participants who were initially non-users and in whom NIV delivery was optimised. This observation is similar to our preliminary findings of the value of polysomnography to optimise NIV initiation,10 perhaps suggesting a role for targeted monitoring of NIV usage with appropriate interventions if and when usage declines beyond a critical value, rather than routine monitoring of all signals in all people. Prospective studies of these questions, in particular the role of combining patient-reported outcome measures (PROM) and nightly usage below 4 hours as potential ‘triggers for clinical review’, are necessary if the clinical impact of remote monitoring is to be fully understood.
Minute ventilation was stable within individuals and while leak was variable in some, even high leak levels did not reduce mean usage below the clinically important cut-off of 4 hours nightly. Mansell et al demonstrated a non-significant reduction in PaCO2 with their strategy to minimise leaks and increase minute ventilation.30 If a similar remote optimisation strategy was confirmed as effective in controlled clinical trials, then minute ventilation may provide a therapeutic target to ensure ongoing control of PaCO2. While leak monitoring has been found to have a role in monitoring NIV efficacy,31 the confounding issues of the absolute leak amount that compromises device efficacy alongside differences in intentional leaks across different masks and the variable subjective impacts of leaks in individuals make any singular cut-off difficult to determine or apply.4 19
Our data show that between patient variability is higher than within patient and that usage overall is higher in NIV users with neuromuscular disease. When setting normative values for these ventilator measurements, an individualised approach is likely required, rather than one size (or cut-off) fits all. We speculate that normative ranges may be able to be estimated by using patient characteristics such as lung function, PROM and underlying disease process, but that within these ranges, users own data collected over a number of days may allow clinicians to determine each person’s normal limits. Qualitative research exploring the experience of NIV users, especially in motor neurones disease, are emerging32 however, more research into PROM that are both sensitive and specific to clinically important change across a range of diagnoses is a critically important, yet currently missing, building block for any such clinical management approach.
We suggest that health services research that goes beyond simple efficacy or impact of remote NIV monitoring through to examining the effect of models of integration of remote monitoring into routine care are necessary before widespread implementation can be supported. Additional care complexity and reliance on both ventilator technology and communications infrastructure are important considerations.
Limitations
Our data do not provide information about how routine remote monitoring of NIV could, would or should be integrated into routine clinical care. The deliberate selection bias towards clinically stable, longer-term NIV users allowed us to observe the magnitude of signal variability from night to night and person to person, but of course cannot deliver information regarding how to manage the deteriorating patient for example, because they were excluded from the trial. People with lived experience of NIV and the general public were not directly involved in the design, review or manuscript preparation of this study, and as such the translational impact of the findings is limited. However, the end-users of the findings of this paper are arguably clinical staff working with NIV. These staff were integral to the experimental design, conduct and paper preparation. Our data were collected on Phillips Respironics A30 and DreamStation BiPAP devices and leak, derived index values and variance in these device indices may be different in other machines.
Overall, in this stable home ventilation population, there was little variance in ventilation parameters within individuals. As such, these findings cannot be assumed to apply to other NIV user groups such as in rapidly progressive disease or those more recently commenced on ventilation. Remote monitoring may have a different role in NIV implementation or in the face of rapidly deteriorating function, where NIV settings could be titrated in an outpatient or home setting instead of an in-lab titration study. In the obstructive sleep apnoea setting, telemonitoring has been shown to improve autotitrating positive airway pressure usage through intervening early when problems occur.33 If controlled clinical trials can demonstrate similar improvements in NIV, this would likely benefit our patients, health services and society.
Conclusion
Telemonitoring of individuals using assisted ventilation is technically feasible but heavily reliant on device technology and communications infrastructure. In this clinically stable cohort, all device-derived indices were more varied between users compared with the day-to-day variation within an individual. We speculate that normative ranges and thresholds for clinical intervention will need to be individualised, although perhaps ‘more alike’ within disease groups, and much work is necessary to determine the clinically important relationships between clinician targets for therapy and patient-reported outcomes. Additional health services research is needed to understand the potential role and impact of remote monitoring on clinical care and service delivery models.
References
Supplementary materials
Supplementary Data
This web only file has been produced by the BMJ Publishing Group from an electronic file supplied by the author(s) and has not been edited for content.
Footnotes
Contributors VJ, SC, LR, LMH, MEH and DJB contributed to the study design. VJ, LR, SC, AR, KS, LMH and MEH contributed to the data collection. VJ, KS, MG and DJB conducted the statistical analysis. VJ and DJB drafted the initial manuscript. All authors approved the final manuscript as submitted.
Funding The authors have not declared a specific grant for this research from any funding agency in the public, commercial or not-for-profit sectors.
Competing interests Phillips Respironics provided NIV devices for the trial and downloads of the online participant data as “in-kind” support.
Patient consent for publication Not required.
Ethics approval Approval was granted by the Austin Health Research Ethics committee (LNR/17/Austin/272).
Provenance and peer review Not commissioned; externally peer reviewed.
Data availability statement Data are available on reasonable request. Participant approval for sharing of raw data was not obtained. As such, any reasonable request for data sharing would require consideration by the local institutional ethics committee.
Supplemental material This content has been supplied by the author(s). It has not been vetted by BMJ Publishing Group Limited (BMJ) and may not have been peer-reviewed. Any opinions or recommendations discussed are solely those of the author(s) and are not endorsed by BMJ. BMJ disclaims all liability and responsibility arising from any reliance placed on the content. Where the content includes any translated material, BMJ does not warrant the accuracy and reliability of the translations (including but not limited to local regulations, clinical guidelines, terminology, drug names and drug dosages), and is not responsible for any error and/or omissions arising from translation and adaptation or otherwise.