Article Text

Abstract
Purpose To determine whether generalised additive models of location, scale and shape (GAMLSS) developed for pulmonary diffusing capacity are superior to segmented (piecewise) regression models, and to update reference equations for pulmonary diffusing capacity for carbon monoxide (DLCO) and nitric oxide (DLNO), which may be affected by the equipment used for its measurement.
Methods Data were pooled from five studies that developed reference equations for DLCO and DLNO (n=530 F/546 M; 5–95 years old, body mass index 12.4–39.0 kg/m2). Reference equations were created for DLCO and DLNO using both GAMLSS and segmented linear regression. Cross-validation was applied to compare the prediction accuracy of the two models as follows: 80% of the pooled data were used to create the equations, and the remaining 20% was used to examine the fit. This was repeated 100 times. Then, the root-mean-square error was compared between both models.
Results In males, GAMLSS models were 7% worse to 3% better compared to segmented regression for DLCO and DLNO. In females, GAMLSS models were 2% worse to 5% better compared to segmented linear regression for DLCO and DLNO. The Hyp'Air Compact measured DLNO and alveolar volume (VA) that was approximately 16–20 mL/min/mm Hg and 0.2–0.4 L higher, respectively, compared to the Jaeger MasterScreen Pro. The measured DLCO was similar between devices after controlling for altitude.
Conclusions For the development of pulmonary function reference equations, we propose that segmented linear regression can be used instead of GAMLSS due to its simplicity, especially when the predictive accuracy is similar between the two models, overall.
- respiratory measurement
- equipment evaluations
- lung physiology
Data availability statement
Data are available upon reasonable request. The pooled data datasets used in this current study are available from the corresponding author [GSZ] on reasonable request. It is required that should the complete dataset be shared, then any abstract, conference proceedings, or article that will be published related to this dataset will have GSZ as one of its co-authors.
This is an open access article distributed in accordance with the Creative Commons Attribution Non Commercial (CC BY-NC 4.0) license, which permits others to distribute, remix, adapt, build upon this work non-commercially, and license their derivative works on different terms, provided the original work is properly cited, appropriate credit is given, any changes made indicated, and the use is non-commercial. See: http://creativecommons.org/licenses/by-nc/4.0/.
Statistics from Altmetric.com
Key messages
What is already known on this topic
Do segmented (piecewise) regression provide similar predictive accuracy compared to more complicated generalised additive models of location, scale and shape (GAMLSS) that the Global Lung Function Initiative Network uses for pulmonary function reference equations?
What this study adds
Segmented linear regression for pulmonary function show similar predictive accuracy as GAMLSS models. Furthermore, the pooled data from five previously published studies (total pooled subjects=1076) demonstrate that the Hyp'Air Compact device measured pulmonary diffusing capacity for nitric oxide (DLNO) and alveolar volume (VA) that was approximately 18 mL/min/mm Hg and 0.3 L higher, respectively, compared with the Jaeger MasterScreen Pro (CareFusion, Germany; now Vyaire Medical). However, it is not known which device measures DLNO and VA more correctly.
How this study might affect research, practice or policy
The Hyp'Air Compact (Medisoft, Sorinnes, Belgium) measured DLNO and VA that was systematically higher than that of the Jaeger MasterScreen Pro. Thus, the two manufacturers should come together to resolve these between-machine differences. In the meantime, more comprehensive reference equations are updated here, accounting for the lung function testing device, where applicable.
Introduction
In 2000, a new approach for the development of reference equations for spirometry was described that allowed for a smooth transition between childhood and adulthood in a continuous fashion.1 This modelling technique prevented discontinuities between paediatric and adult reference equations at the transition point, preventing misinterpretation. This methodology was based on a semiparametric regression approach of generalised additive models for location, scale and shape (GAMLSS) and was discussed again in the same journal in 2008.2 GAMLSS allowed for age-related differences in between-subject variability, improving the definition of the lower limits of normal (LLN).2
Subsequently, in 2010, a European Respiratory Society (ERS) Task Force was created to create multiethnic, all-age reference equations for lung function for world use using GAMLSS models.3 This allowed for a single reference source that would be able to monitor patients from childhood into old age.3 As there were over 400 published reference equations describing healthy lung function changes with age, sex and height, professionals were left with a decision of which equation to use.4 Thus, the Global Lung Function Initiative (GLI) Network was created to address discrepancies in lack of standardisation.4 These new ‘Global’ reference equations, using healthy subjects’ data from around the world, were developed to model changes in lung size with age and height from childhood to adulthood.3 These complex growth patterns were modelled using GAMLSS that smoothed centile curves.5
Since 2012, the GLI Network produced three significant papers that were endorsed by the ERS and the American Thoracic Society and published in the European Respiratory Journal, which provided global reference equations for spirometry,6 pulmonary diffusing capacity for carbon monoxide (DLCO)7 8 and static lung volumes.9 Those articles presented reference equations using GAMLSS models. GAMLSS were introduced initially in 200510 and updated in 2018,11 allowing for a variety of smoothing functions. Besides pulmonary medicine, GAMLSS have been used in several fields such as exercise science,12 13 chemistry,14 hydrological science,15 genomics16 and psychology,17 to name a few; thus, GAMLSS models have pertinence across many disciplines.
However, GAMLSS are highly complex and challenging to implement (ie, see www.gamlss.com). One needs to understand distributions of a variable (and its properties), then decisions need to be made regarding the distribution of the response variable, the choice of explanatory variables, the link function (ie, monotonic functions of the distribution parameters) and the amount of smoothing and random effects.15 Thus, the application of GAMLSS models estimates time-varying quantiles, which are distribution dependent, so the selection of a suitable distribution is important.15 As such, there is a sophisticated understanding of physiology, statistics and computer programming that is involved in producing a proper model using GAMLSS.
However, segmented or ‘broken-line’ models are regression models that are simpler to use and should be the model of choice for the development of reference equations for lung function across the whole lifespan. Segmented regression is less complex, easier to comprehend and can be applied more readily applied as the formulas are easier to understand. Segmented regression allows for predictions to be made without experiencing discontinuities due to transitions from one prediction equation to the next. This is especially important in lung function prediction equations, in which one prediction equation is developed for children, and then another separate equation is developed for adults. Furthermore, once the equations are developed, a simple calculator can be used to obtain the predicted value without the use of splines.
Fitting piecewise or segmented terms in regression models for pulmonary function use age as the non-linear covariate with two-line segments connected at one breakpoint.18 19 From visual observation, this breakpoint occurs somewhere around 20 years of age forced vital capacity (FVC), forced expiratory volume in one second (FEV1)18 20 and DLCO.21 Thus, it is the premise of this article to demonstrate segmented (piecewise) linear regression can be used more easily with similar prediction errors as GAMLSS models. We also believe that segmented regression models are more parsimonious compared with GAMLSS models, meaning that segmented regression could achieve goodness of fit using as few explanatory variables as possible. This reasoning comes from the idea of ‘Occam’s razor’, which says that the simplest explanation is probably correct.
As such, the primary purpose of this study was to determine whether pulmonary diffusing capacity modelled using segmented linear regression with one breakpoint provides similar prediction accuracies as GAMLSS but without the use of complicated splines. It is our assumption that DLCO, pulmonary diffusing capacity for nitric oxide (DLNO) and alveolar volume (VA) could be modelled using separate segmented linear equations for each sex, which would be less complex compared to GAMLSS while providing similar prediction errors as GAMLSS. A secondary purpose was to update the pulmonary diffusing capacity prediction equations published by an ERS Task Force in 2017.22 Nearly 80% of the subjects used in the development of reference equations for the ERS task force in 2017 had pulmonary diffusing capacity measured by the Hyp'Air Compact device (Medisoft, Sorrines, Belgium). However, evidence suggests that the predicted DLNO is varied depending on the reference equation applied,23 24 which can be due to the different pulmonary function devices used between studies.25 Thus, with a much larger pooled dataset to draw on, we also sought to evaluate between device discrepancies.
Materials and methods
Five previous studies that developed reference equations for DLNO in white individuals without cardiopulmonary disease were pooled and used in this study.26–30 Institutional Review Board approval was not needed as the deidentified data were obtained from previously published work. Data from three separate studies26–28 were obtained from a 2017 ERS task force on the technical standards of DLNO22; another set was publicly available online,29 and the fifth dataset set was created based on the anthropometric characteristics of another paper.30 (Note: Munkholm et al30 declined to provide us with their data after multiple repeated attempts. As such, we created simulated data that was statistically tested to be similar to their data using a statistical method called truncation. The procedures on how this fifth dataset was created are discussed in the online supplementary material).
Supplemental material
Segmented (piecewise) linear regression models
Reference equations were created for DLCO, DLNO and VA using the ‘R’ language environment (http://www.r-project.org). The ‘segmented’ package was originally developed in 2008,31 based on previous work on piecewise fitting of at least on breakpoint32 (V.1.3–4, April 2021) generated the segmented models.33 The covariate ‘age squared’ (Age2) was used to estimate the single breakpoint for the entire age range of the data (5–95 years of age). Based on a visual plot between age2 and either DLCO, DLNO or VA, an estimated starting value for the breakpoint is provided, and then an iterative procedure in R is used to estimate the breakpoint32 and the 95% CI of the breakpoint.34
Other covariates used in the models were height (cm) or height2, sex (1=male; 0=female), altitude (0–300 m), weight (kg) and the pulmonary function device. The brand of pulmonary function system was listed as a potential predictor of the model since there are discrepancies in DLNO depending on which equipment is used.35 The devices used to measure pulmonary diffusing capacity were the Jaeger MasterScreen PFT Pro (CareFusion, Hochberg, Germany), Jaeger Masterlab Pro (Erich Jaeger, Würzburg, Germany) with NO chemiluminescence (77AM, Eco Physics, Switzerland) and the Hyp'Air Compact device (Medisoft).
Generalised additive models of location, scale and shape
The GAMLSS models developed here are implemented in a series of CRAN packages in the R language environment and are currently available for download at http://wwwr-projectorg.10 The Lamda-Mu-Sigma (LMS) method of Cole and Green was applied as an extension of the normal distribution that adjusts for skewness5 and is embedded in GAMLSS. The LMS method is equivalent to Box-Cox Cole and Green distribution (BCCG), BCCG (µ, σ, υ) and parameters µ, σ, υ are the approximate median, approximate coefficient of variation and approximate skewness parameters of the distribution of the response variable.11 That is, µ controls the location, σ controls the scale and υ controls the skewness of the distribution as people grow and age.11 The complex effects for the predictor variables on the dependent variable were modelled using splines, which allow the dependent variable to vary smoothly (non-linearly) as a function of a predictor. Thus, a continuous, smooth fit over the entire age range can be obtained using splines. The goodness of fit was assessed by Akaike’s Information Criterion,36 Bayesian Information Criterion,37 Quantile–Quantile (Q–Q) plots38 and worm plots.39
The between-individual variability across age was assessed by obtaining the predicted SD divided by the predicted mean multiplied by 100. The predicted mean was determined by taking the median height at each age from the white US population40 and applying a zero altitude for each model. The predicted SD was the residual SD (RSD) obtained from the segmented linear regression models and the sigma value obtained from GAMLSS.
Prediction accuracy between models
To assess the prediction accuracy of the segmented linear regression and GAMLSS models, repeated random subsampling using the Holdout method was used that randomly sampled the complete dataset into two mutually exclusive subsets, a training set and a test set (also called a validation or Holdout set), repeated over several times.41 Eighty per cent of the pooled data was used to fit both models (training set), and then the fitted equation predicted the remaining 20% of the test subjects (validation set). This process was implemented for 100 replicates. The median, minimum, maximum and 95% CI of the root-mean-square error (ie, the square root of the average of the squared errors) from the 100 random samplings of the pooled data were compared between both models. The average correlation coefficients between each predicted value and the actual values obtained for 20% of the test data were also reported. The results of the repeated sampling would demonstrate whether GAMLSS or segmented linear regression models would be systematically favoured.
The LLN for both models was chosen as the fifth percentile. The LLN is the value below which there is only a 5% probability that the value from a population is normal. This was calculated by subtracting from the model the product of the one-sided area under the curve and the equation’s RSD (–1.645 RSD).
Other analyses
Correlations were used to examine associations between variables. The GLI equations for DLCO7 8 were also used to compare DLCO and VA against both segmented linear regression and GAMLSS models. A 2×3 repeated measures analysis of variance (RmANOVA) compared fitted z-scores between the three different types of prediction models (segmented linear regression, GAMLSS and GLI GAMLSS) for DLCO and VA and the pulmonary function device used. A 2×2 RmANOVA did the same for DLNO. A Passing-Bablok linear regression42 and Bland-Altman Plots43 were used to examine the agreement of the LLN between models. To determine whether there was agreement in determining whether the measured value was below the LLN between models, a Kappa statistic was performed where 1 is less than the LLN and 0 ≥LLN. The strength of for the Kappa statistic was: ≤0.20 = none; 0.21–0.39=minimal, 0.40–0.59=weak; 0.61–0.80=moderate; ≥ 0.80–0.90 = strong; ≥0.90 almost perfect.44
Receiver-operating characteristic (ROC) analysis for evaluating performance DLCO, DLNO and VA between models was also examined.
To classify the impairment in DLNO, DLCO and VA based on z-scores, a linear regression analysis was performed between the average per cent predicted for DLNO, DLCO and VA that correspond to the average fitted z-scores for both models. This would allow an examination of the variability in per cent predicted values matched to z-score classifications.
Patient and public involvement
Neither patients nor members of the public were involved in the design, conduct, reporting or dissemination of this research study.
Results
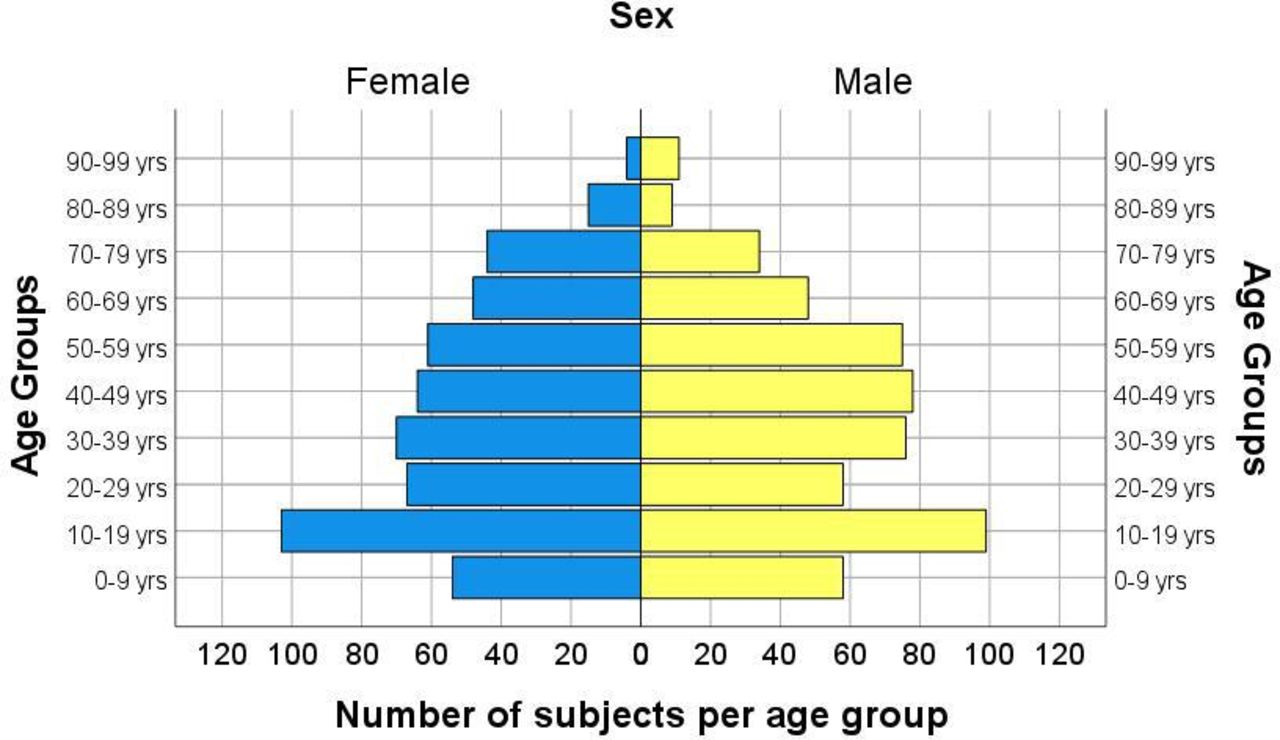
Pooled data from five studies were used to produce reference equations for DLCO, DLNO and VA.26–30 Age groups are displayed in figure 1 for a visual representation of the number of subjects in each age category. The five studies used three different pulmonary function machines. The numbers of subjects that were tested on each of these pulmonary function machines are presented in figure 2. The two Jaeger pulmonary function systems were combined into one pulmonary function system since there were no meaningful differences between them.

The pooled data used in the analysis display the number of subjects per age group. After removing outliers, 1076 subjects remained for analysis.
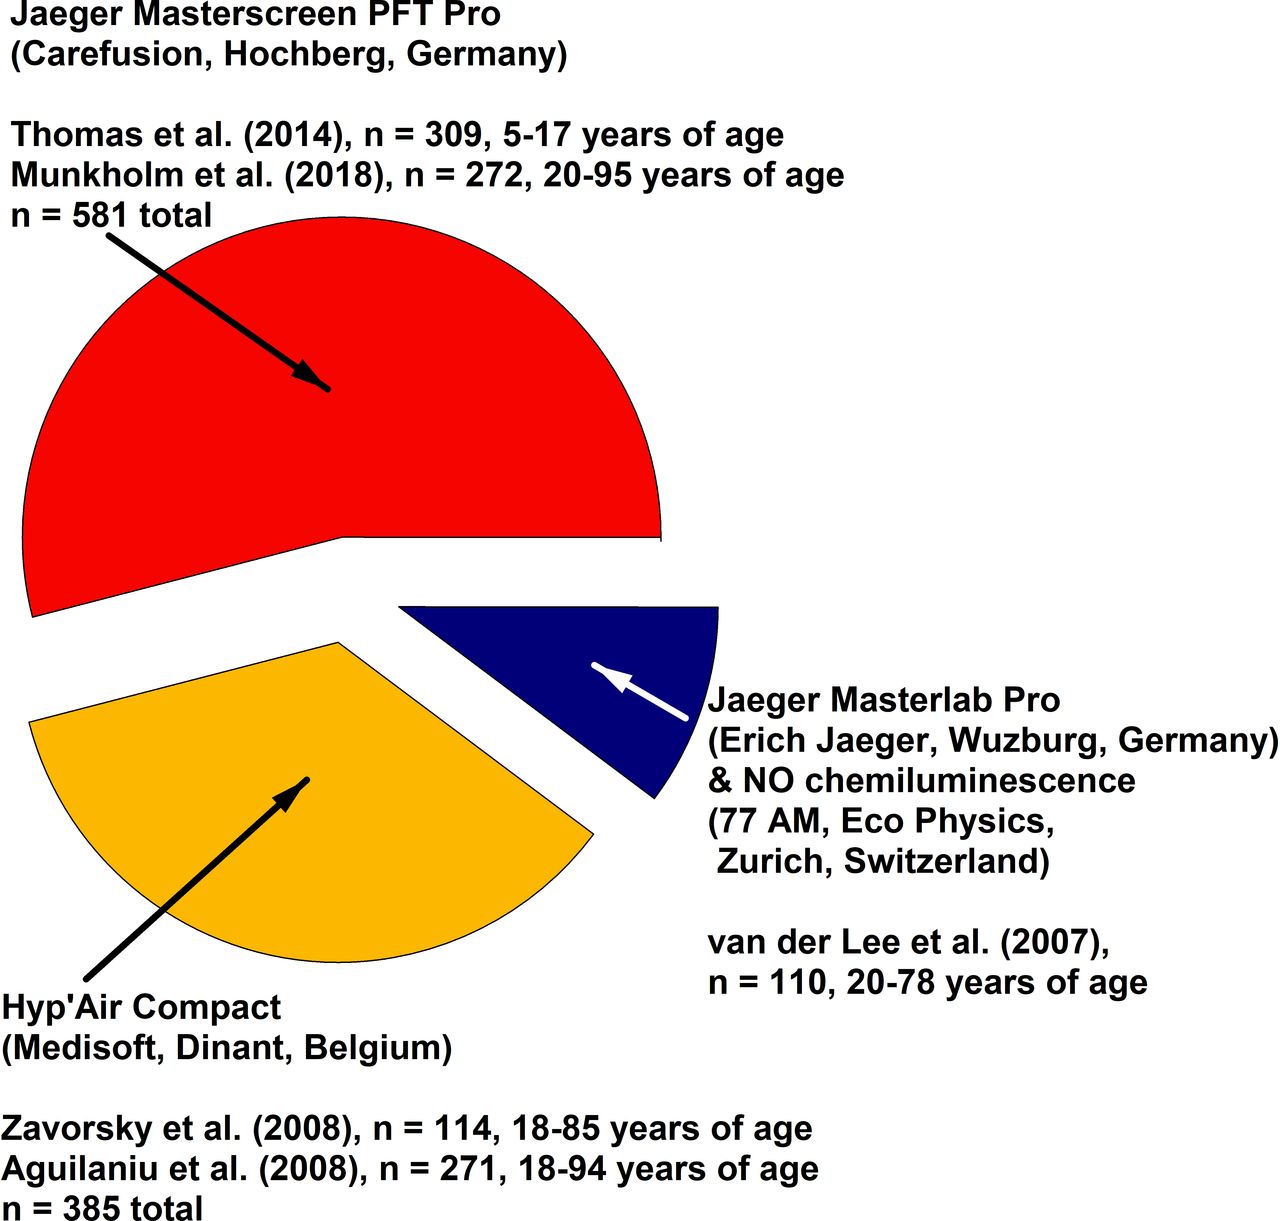
A representative breakdown of the pooled data and the equipment used in the development of reference equations for pulmonary diffusing capacity.
Outliers were screened and removed from the analysis. About 7% of the complete dataset was eliminated during initial screening, in which multiple linear regression models were used to examine studentised residuals. Any raw data point that had a studentised residual ≥3.0 was eliminated. There were a similar number of males and females with wide age ranges and heights, totalling 1076 never-smokers. Fractional age was not available in the datasets. As DLNO is minimally affected by haemoglobin concentration,45 DLNO was not adjusted for haemoglobin concentration. As well, DLCO was not adjusted for haemoglobin concentration since correcting for it does not improve the model fit for DLCO.7 There was a 2%–5% shared variance between breath-hold time and DLCO or DLNO (and no shared variance with VA). As such, breath-hold time was also not included as a covariate in the models. The subjects are presented in table 1.
Pooled anthropometric data previously published studies from which reference equations were made26–30
Simulated raw data were created from the anthropometric characteristics of Munkholm et al,30 as that group was unwilling to provide us with the actual raw data. The simulated data represented 24% of the total data set and resembled the actual data (online supplemental tables S1, S2A,B, S3); thus, the simulated data were used in the overall analysis.
Measured DLCO and measured DLNO were highly correlated with each other. The Jaeger MasterScreen Pro produced a correlation of 0.922 between DLCO and DLNO (R2=0.85), and the Hyp'Air Compact produced a correlation of 0.951 between DLCO and DLNO (R2=0.90) (combined R2 using both machines=0.87). For the Jaeger MasterScreen Pro, DLNO=4.20‧(DLCO)+8.42, (adjusted R2=0.85, p<0.001, with a residual SE=14.1 mL/min/mm Hg). The 95% CI of the slope 4.07 to 4.33. For the Hyp’Air Compact, DLNO=4.69‧(DLCO)+4.78, (adjusted R2=0.90, p<0.001, with a residual SE=11.9 mL/min/mm Hg). The 95% CI of the slope 4.54 to 4.85. Measured VA was correlated to measured DLCO (r=0.88, Jaeger MasterScreen Pro; r=0.80, Hyp’Air Compact).
The DLNO to DLCO ratio was relatively stable from 5 to 95 years of age (online supplemental figure S1). However, the Jaeger MasterScreen Pro yielded an approximal 0.29 units lower ratio compared with the Hyp'Air Compact due to its systematically larger DLNO values, with DLCO values being relatively unchanged between machine types. Prediction equations for the DLNO to DLCO ratio were not developed as the pulmonary function testing device (6.6% shared variance), altitude (2.2% shared variance), age (1.3% shared variance) and sex (0.6% shared variance) accounted for only 10% of the total shared variance.
Segmented linear reference equations and GAMLSS equations separated by sex are presented in tables 2 and 3. Segmented regression equations that include sex as a covariate are presented in online supplemental table S4. Weight was not a factor in any prediction equation since there was only a 1% shared variance between weight and DLCO or DLNO and 5% shared variance between weight and VA when controlling for height. The influence of the pulmonary function testing (PFT) device on DLCO was minor and therefore was not included in segmented reference equations. The Hyp'Air Compact PFT device produced an approximate 18 mL/min/mm Hg (15%) higher DLNO compared with the Jaeger MasterScreen Pro when all other variables were controlled for (online supplemental table S4). Controlling for all other variables, VA was found to be 0.76 L larger in men compared with females (online supplemental table S4). The Hyp'Air Compact PFT device was also found to produce a 0.28 L (5%) larger VA compared with the Jaeger MasterScreen PFT device. When standardising for the mean height (online supplemental table S10) and PFT device, both models show similar predicted values (figure 3A–C) and similar LLN (figure 4A–C).
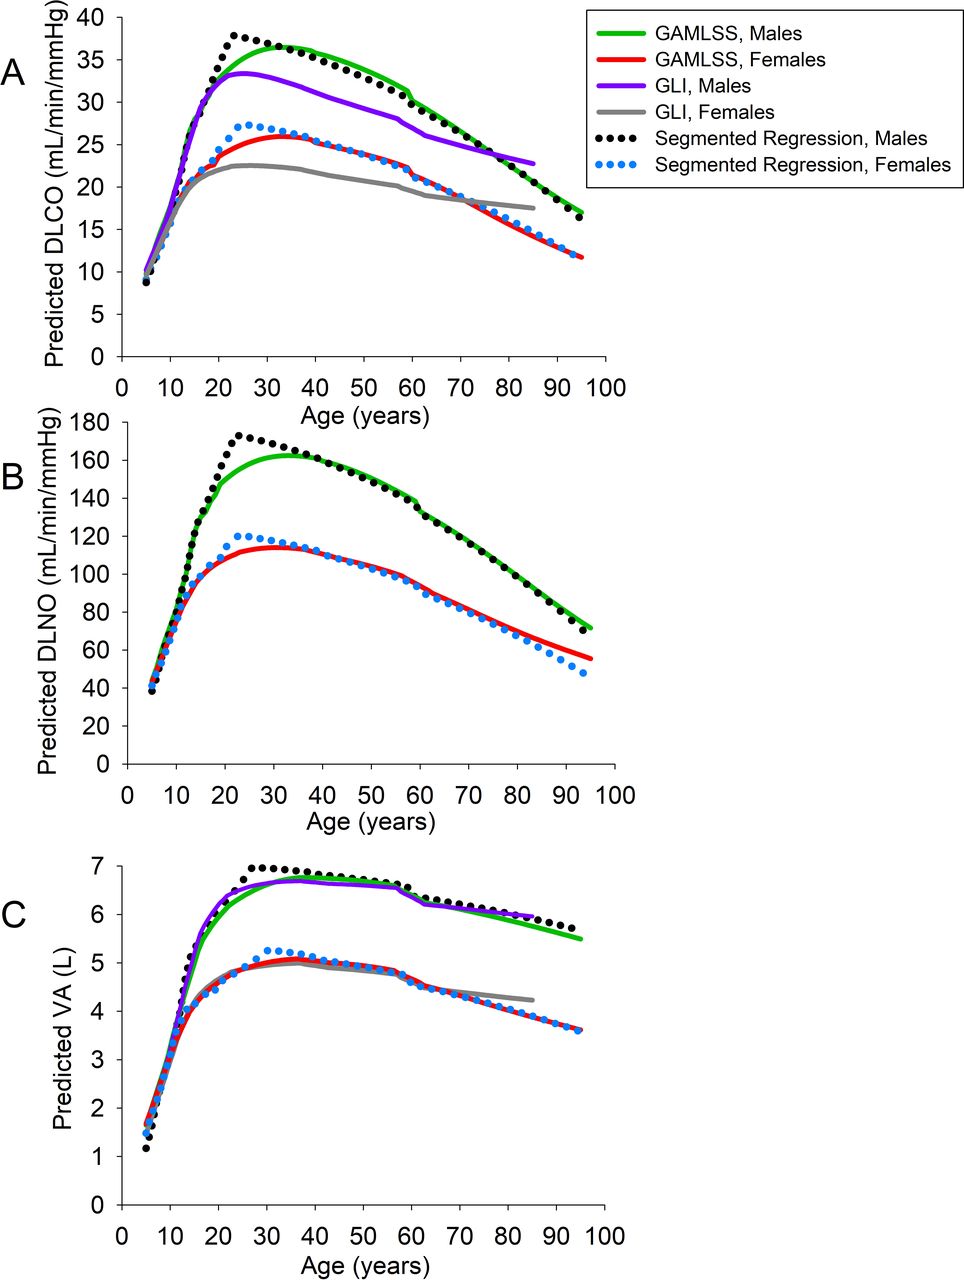
(A) predicted pulmonary diffusing capacity for carbon monoxide (DLCO) versus age, (B) predicted pulmonary diffusing capacity for nitric oxide (DLNO) versus age, (C) predicted alveolar volume (VA) versus age. The various fitted curves/lines are based on the median height for age and sex in the white US population,40 an altitude of 0 m and the Jaeger MasterScreen Pro equipment was used. Online supplemental table S10 in the supplement lists the heights with each age and sex. For DLCO and VA, the updated Global Lung Function Initiative (GLI) generalised additive models of location, scale and shape (GAMLSS) reference equations were included as a comparison.8 Notice that the (GLI) DLCO curves (grey in females, and purple in males) are lower compared with both GAMLSS and segmented regression models. The GLI GAMLSS prediction model is based on a 10 s breath-hold, which allows for a more homogenous inspired gas penetration in the lung, and thus a lower DLCO compared with the 5–6 s breath-hold manoeuvres. The GAMLSS and segmented linear regression curves/lines for DLCO, DLNO and VA are comparable.

(A) pulmonary diffusing capacity for carbon monoxide (DLCO) versus age at the lower limits of normal (LLN), (B) pulmonary diffusing capacity for nitric oxide (DLNO) versus age at the LLN, (C) alveolar volume (VA) versus age at the LLN. The various fitted curves/lines are based on the median height for age and sex in the white US population,40 an altitude of 0 m, and the Jaeger MasterScreen Pro equipment was used. Online supplemental table S10 in the supplement lists the heights with each age and sex. For DLCO and VA, the updated Global Lung Function Initiative (GLI) generalised additive models of location, scale and shape (GAMLSS) reference equations were included as a comparison.8 Notice that the (GLI) DLCO curves (grey in females, and purple in males) are lower compared to both GAMLSS and segmented regression models. The GLI GAMLSS prediction model is based on a 10 s breath-hold, which allows for a more homogenous inspired gas penetration in the lung, and thus a lower DLCO compared with the 5–6 s breath-hold manoeuvres. The segmented linear regression lines for DLNO and DLNO tend to show a lower LLN compared with the GAMLSS models, especially after 60 years of age for DLNO and after 80 years of age for DLCO.
Reference equations using segmented regression
Reference equations using generalised additive models of location, scale and shape models
Both segmented linear regression and GAMLSS models were fitted to the raw data (online supplemental table S5, online supplemental figures S2-S8). The mean (SD) z-scores of the fitted data in both segmented regression and GAMLSS models were alike. For DLCO and VA (online supplemental figures S6, S8), the fitted z-scores made by the DLCO and VA GLI GAMLSS reference equations7 were affected using the Hyp'Air Compact device. For DLNO, the fitted scores were similar between models and pulmonary function devices used. There were no GLI reference equations made for DLNO. Q–Q plots demonstrate that the fitted z-scores for DLNO, DLCO and VA can be approximated by a normal distribution in both models (online supplemental figures S4 and S5); however, there were some outliers remaining when the per cent predicted values were fitted to the segmented regression models (online supplemental figure S4).

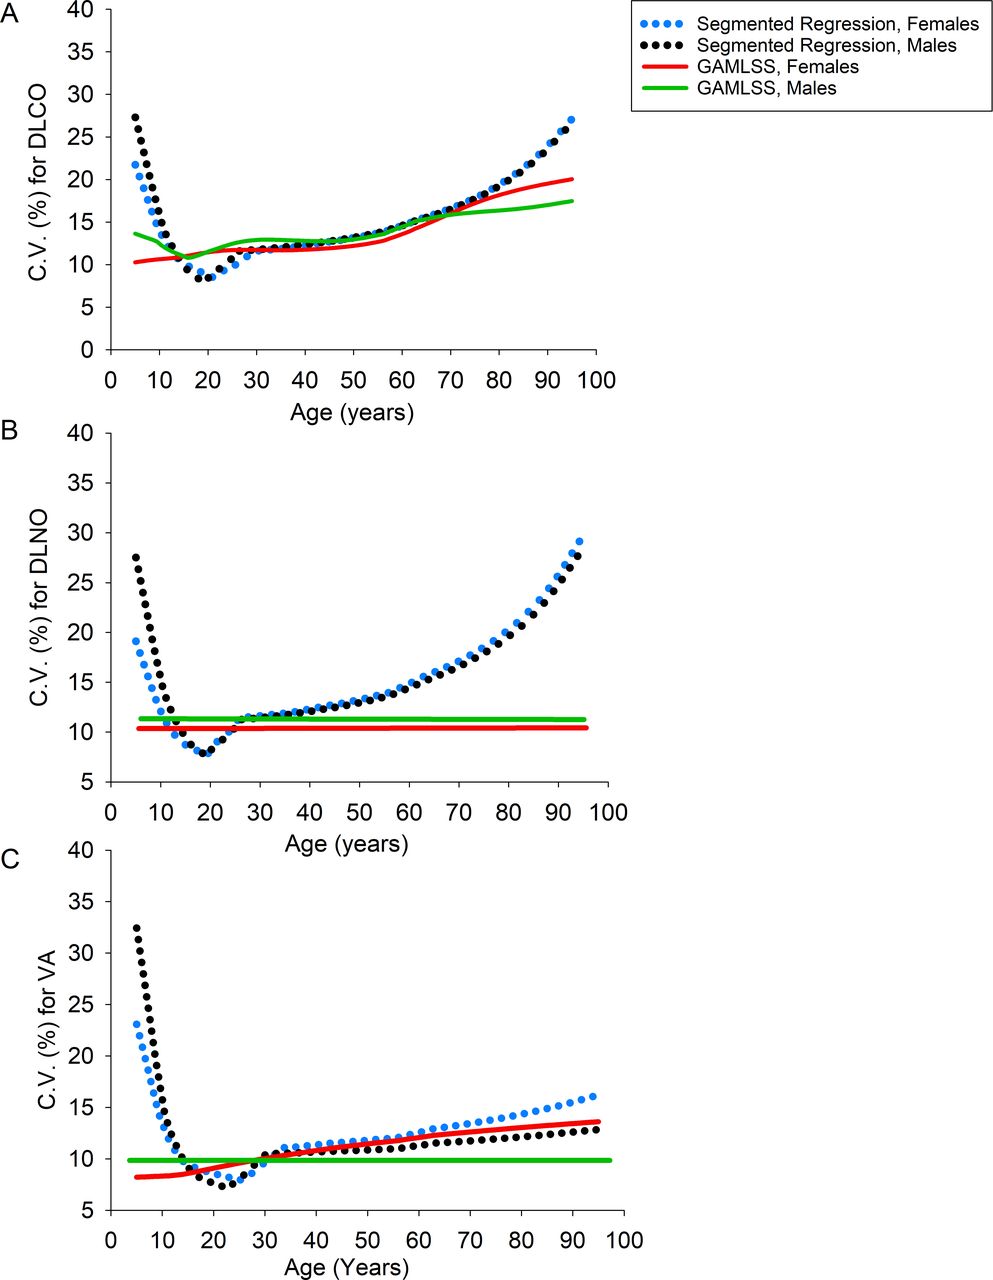
Between subject variability across age for (A) pulmonary diffusing capacity for carbon monoxide (DLCO) versus age, (B) pulmonary diffusing capacity for nitric oxide (DLNO) versus age, (C) alveolar volume (VA) versus age. The C.V. (%) = (predicted SD/predicted mean) ×100. The predicted mean and SD for each age were calculated using the median height of the US population at each age.40 The graph is also standardised for altitude (0 m). For DLCO and VA, the between subject variability unaffected by pulmonary function testing device. However, when measuring DLNO in females, those that were tested with the Hyp'Air Compact device showed a between subject variation of 14% compared with 10.5% in males throughout all ages (not shown). When using the Jaeger MasterScreen Pro, the between subject variation for DLNO was similar (panel B), 10.5%, females, 11.2% males). GAMLSS, generalised additive models of location, scale and shape.
A correlational matrix of fitted z-scores between models shows strong associations in z-scores between models for DLNO and DLCO (online supplemental table S6). The predicted VA obtained from all models is highly associated with the measured VA (online supplemental table S7).
The coefficient of variation between subjects was larger in the segmented regression models at <10 years of age for DLCO, DLNO and VA (figure 5). Segmented regression also had a larger variability for DLNO at >60 years of age (figure 5). The variability was greater in those <10 and >70 years of age when using the segmented regression models (figure 5).
Both models had similar prediction accuracies (table 4). There was no clear model winner. Both models were comparable as the 95% CI of improvement overlapped zero for all cases. The average correlation coefficients of the predicted values associated with the actual values were similar between the two models (table 5).
Prediction accuracy between both models
The correlation coefficients from the 100 samplings are compared between both models
There was a moderate agreement for DLCO and DLNO between both models (table 6). In the same vein, the Youden Index J (sensitivity+specificity–1) was determined from ROC analyses and described the overall diagnostic accuracy46 (table 7). Diagnostic accuracy was the highest for DLCO, then DLNO and then VA when segmented regression was compared against GAMLSS, given that the estimated prevalence of abnormal results (values below the LLN) is 5%. Another ROC analysis was performed comparing DLNO to DLCO when the estimated prevalence of abnormal results is 5% in a population (online supplemental table S8). All characteristics of the ROC curve were similar between models for DLCO and DLNO (online supplemental table S8).
A breakdown of the percentage of subjects below the lower limits of normal (LLN), including the agreement between the two models for each variable
Receiver-operating characteristic (ROC) analysis for evaluating the performance of both statistical models for pulmonary diffusing capacity for carbon monoxide (DLCO), pulmonary diffusing capacity for nitric oxide (DLNO) and alveolar volume (VA) when the estimated prevalence of an abnormal result in a population is 5% (ie, when 5% of the population is below the lower limits of normal (LLN))
The derived LLN obtained from segmented linear regression models was compared with the derived LLN from GAMLSS models (online supplemental figures S9-S14). There were systematic and proportional differences between models.
The impairment in DLNO, DLCO and VA was classified based on z-scores (table 8). As the per cent predicted matched to the LLN (z-score = – 1.645) varies with age (online supplemental table S9), and throughout a wide range of z-score values (online supplemental figure S15A,B), the classification of impairment is best defined via the z-scores. However, the per cent predicted value along with its variability is also provided in table 8 as it not only may be more intuitive than z-scores, but it can be an easier way for clinicians to assess the severity of a pulmonary function abnormality.
Classification of impairment in pulmonary diffusing capacity for nitric oxide, pulmonary diffusing capacity for carbon monoxide and alveolar volume, using the modified one-step NO–CO technique (4–6 s breath-hold manoeuvres)
Discussion
GAMLSS have been used by the GLI Network to develop reference equations for lung function for the world to use,6–9 but they are too complicated to implement (see online supplemental table S11 for a worked example). The first purpose of this study was to examine the accuracy of complicated GAMLSS models compared with simpler segmented (piecewise) linear regression models when developing reference equations for pulmonary diffusing capacity. We showed that segmented regression models are comparable to GAMLSS models in terms of prediction accuracy (tables 4 and 5). When identifying subjects below the LLN, there was a 61% and 66% true positive rate for DLCO and DLNO, respectively, when segmented regression was compared with GAMLSS, for which the estimated prevalence of abnormal results is 5% (table 7).
When evaluating reference equations for lung function indices, there are limited studies comparing regression to GAMLSS. All the comparisons involve comparing FVC and FEV1 between models, and none compared pulmonary diffusing capacity. Martinez-Briseňo et al47 compared spirometric reference equations between similar models and determined that while GAMLSS displayed a slightly better fit overs multiple linear regression, they were minimal. Brisman et al48 used a piecewise regression approach as discussed by Lubiński and Gólczewski,49 and that the mean square errors of the models were similar to GAMLSS developed the GLI. In a follow-up study by Brisman et al,50 they further determined that segmented linear regression should be used for the development of spirometric reference equations as the GLI GAMLSS equations identified too few subjects below the LLN.50 Kubota et al also compared multiple linear regression against GAMLSS for FVC and FEV1 in Japanese subjects.51 In that study, they claimed that their GAMLSS models more accurately reflected the transition in pulmonary function during young adulthood. However, they did not provide any information on prediction accuracy between models, nor did the study include children, and there was no real transition between adolescence and adulthood. Therefore, the results of this current study are particularly novel as we show similarity in prediction errors DLCO, DLNO and VA between GAMLSS and segmented linear regression.
Nevertheless, the Q–Q plots for per cent predicted generated by GAMLSS demonstrate a better fit to the normal distribution compared with segmented regression at the extreme ends of the plot. The Q–Q plot for VA, for example, shows that when the observed values are ≥140% predicted, the expected normal value is much different; hence about 12 values deviate off the linear line (online supplemental figure S4). Similarly, there are 1–2 subjects for DLCO and DLNO in which the expected normal value was much different compared with the observed per cent predicted values. In comparison, there were no subjects that strayed off the per cent predicted Q–Q plot line when GAMLSS were used for DLNO, DLCO or VA, even at the extreme ranges (online supplemental figure S5). However, these instances are rare (≤1% of the subject pool), and when comparing models (table 4), the overall prediction accuracies were similar.
As the validity of different reference sets for DLNO has been questioned,23 24 the second purpose of this study was to update predictions equations from the ERS 2017 Technical standards document22 based on more available data so that between-machine comparisons could be verified. We confirmed that the Hyp'Air Compact measured DLNO values that were larger than the Jaeger MasterScreen Pro by 16–20 mL/min/mm Hg (13%–16%) (online supplemental table S4). These data agree with another study that demonstrated similar findings, although the differences between devices were slightly larger, at 22–26 mL/min/mm Hg (17%).25 The slightly lower difference between devices observed in the current study is because our models include children, and their study did not. This study pooled all the available reference sets for DLNO that were published in the literature for white subjects from Europe27–30 and North America26 and confirmed a systematic increase in DLNO when the Hyp'Air Compact PFT device was used. The pooled data also demonstrate a 0.2–0.4 L (6%–8% larger VA when the Hyp'Air Compact was used, which is slightly smaller than the between machine differences from Radtke et al.35 The discrepancy estimating VA and the rates of alveolar uptake for nitric oxide per unit time and pressure (KNO) between the two systems could explain the discrepancy in DLNO and VA between devices.35 Furthermore, as the Jaeger MasterScreen Pro uses a demand valve, whereas the Hyp'Air Compact uses a reservoir bag from which the mixture of gases is inspired, this would alter the expired to inspired nitric oxide ratio.
The results presented here are concerning since the lung function testing device is now an important covariate to consider when measuring DLNO and VA. A 2017 ERS Task Force Report on the standardisation of DLNO22 presented reference equations based on pooled data of three studies. However, about 75% of the pooled data from those three studies were based on DLNO data determined by the Hyp'Air Compact PFT system26–28; yet 36% of the current pooled data was determined by the Hyp'Air Compact device. Thus, the results present a more balanced view of the between device findings, and we have updated the prediction equations here.
This study did not determine which pulmonary function testing device was more accurate, only that the two devices were different. For us to determine which is a more accurate device, a comparison would have to be made against a gold standard device. Chemiluminescence NO analysers are considered the gold standard of NO analysers, but it is highly costly. Even so, van der Lee et al used a nitric oxide chemiluminescence analyser (along with the Jaeger Masterlab Pro system) in its development of reference equations for DLNO.28 Our analysis showed no meaningful differences between DLNO measured by van der Lee et al28 versus the studies that used the Jaeger MasterScreen PFT Pro with the NO electrochemical cell.30 However, both the Jaeger Masterlab Pro system (with NO chemiluminescence) and Jaeger MasterScreen PFT Pro displayed lower DLNO values than the Hyp'Air Compact system.26 27 This would suggest that (1) either the Jaeger MasterScreen PFT Pro provides more accurate diffusing capacity values or (2) the software calculations provided by Jaeger were different compared with the calculations of the Hyp'Air Compact device.
We also examined agreement between models using a kappa statistic and a ROC analysis. The kappa statistic showed moderate agreement between models for DLCO and DLNO and a weak agreement for VA (table 6). When comparing against GAMLSS, segmented regression demonstrated ≥97% specificity (true negative rate) when the prevalence of an abnormal result in a population is 5% (ie, when 5% of the population is below the LLN). Moreover, when compared against GAMLSS, segmented regression was able to identify 75% of abnormal results for DLCO, 64% of abnormal results for DLNO, and 52% of abnormal results for VA, considering the prevalence of abnormal results in a population is 5%. This is termed the true positive rate.
The precision between both models was between 61% and 70%. That is, the probability that an actual abnormal result (ie, <LLN) identified by GAMLSS will also show an abnormal result using segment regression (aka precision) varies between 61% and 70% when the prevalence of abnormal results in a population is 5% (table 7). Is this acceptable? Well, we must consider the week-to-week variability in pulmonary diffusing capacity. For example, the week-to-week variability (reproducibility) of DLCO is at least 3.8 mL/min/mm Hg in those with a cardiopulmonary disease52–54 and at least 3.6 mL/min/mm Hg in healthy individuals,53 55–57 but the differences in the LLN for DLCO between both models that equal to or exceeds 3.6 mL/min/mm Hg occurred in only 1.7% of the pooled data (18/1076). Furthermore, the 95% CI of the SD of the residuals multiplied by two between both models is less than its reproducibility (ie, <3.6 mL/min/mm Hg) (online supplemental figures S9A,B, S10A,B). Thus, the ability to classify subjects below the LLN for DLCO using either model is similar when considering the intersession variability in DLCO. What about the ability of the two models to identify the LLN for DLNO? Since the week-to-week variability of DLNO is approximately 13 mL/min/mm Hg in those with cardiopulmonary disease,53 54 and around 20 mL/min/mm Hg in healthy individuals,55 56 the differences in the LLN between for DLNO models that were equal to or exceeded 13 mL/min/mm Hg occurred in 10% of the pooled data (111/1076) (online supplemental figures S11A,B, S12A,B). Additionally, the differences in the LLN between DLNO models that equal to or exceed 20 mL/min/mm Hg occurred in only 3% of the pooled data (34/1076). Thus, the ability to classify the LLN for DLNO using either model is similar when considering the intersession variability in DLNO.
Segmented (piecewise) regression makes a series of assumptions: linearity (the relationship between X and the mean of Y is linear), homoscedasticity (the variance of the residual is the same for any value of X), independence (observations are independent of each other) and normality (for any fixed value of X, Y is normally distributed). Overall, there was linearity (table 2, (online supplemental table S4), homoscedasticity (online supplemental figure S2), independence (each subject is tested only once) and normality (online supplemental figure S4). Still, the Q–Q plot for the per cent predicted VA from segmented regression is not perfect; it has about 10 outliers (online supplemental figure S4).
Establishing categories on diffusion impairment based solely on per cent predicted values, as reported back in 2005,58 is not appropriate. The LLN as expressed as a percentage of the predicted value changes with age for several different lung function indices, such as FEV16, FVC6 and DLCO,7 and we have demonstrated this to be true for DLCO, DLNO and VA (online supplemental table S9). As such, the z-scores should be used to define the severity of diffusion impairment (table 8). Nevertheless, the per cent predicted value along with its variability is also provided in table 8 as it may be more intuitive than z-scores, and it could be an easier way for clinicians to assess the severity of a pulmonary function abnormality.
In the past, an upper limit of normal (ULN) was not formally established for spirometry6 because high values are not clinically meaningful. A ULN for DLCO was also not established when the 2017 GLI DLCO reference equations were published.7 Nonetheless, abnormally high DLCO values may be pathologic, even though they are rare. In those rare cases where high values are seen (ie, pulmonary haemorrhage, polycythaemia, obesity, asthma),59–64 the DLCO test is not the standard for diagnosis.7 Even so, we believe that there is a role for the ULN moving forward, and we incorporate it here. An increase in DLNO and DLCO above the ULN may not be pathologic; an increase could be caused by a negative intrathoracic pressure during breath-hold (Müeller manoeuvre),65 66 or lung size may be very large. In fact, most nationally ranked swimmers have DLNO and DLCO above the ULN,67 which are strongly associated with their large lung volumes. Regular swimming training throughout childhood and adolescence may have aided in the development of larger lungs,68–70 although this remains controversial.71 There also may be a selection bias such that those with larger lungs become good swimmers. Furthermore, given an apparent association of DLNO and DLCO with cardiorespiratory fitness,72 setting a ULN could identify individuals with supra-normal diffusing capacities. As such, we agree with Quanjer et al,6 in that for those individuals suspected of lung disease, an LLN of the fifth percentile (z = –1.645) should be used; and if lung function testing is for screening and fact-finding purposes only, a value of the 2.5th and 97.5th percentile should be used (z-scores of ±1.96). Nonetheless, this classification of diffusion impairment in table 8 does not necessarily correlate with symptomatology, mortality and/or morbidity.
There are reasons why the shared variance between DLNO and DLCO is not 100%. Approximately 70%–80% of the barrier to carbon monoxide uptake resides within the red cell (ie, red cell resistance), while the remaining 25% or so is in the alveolar membrane (see figure 1 elsewhere22). In contrast, the main barrier to NO uptake resides between the alveolar and red cell membranes (about 60%) (ie, membrane resistance).73 Thus, DLNO is better represented by gas transfer through the alveolar-capillary membrane compared with DLCO, and DLNO is more affected by changes in lung volume.73 Thus, DLNO provides a more sensitive evaluation of fibrotic changes in the lung compared with DLCO, and DLCO provides a more sensitive evaluation of pulmonary vascular disorders than DLNO. Unlike DLCO, DLNO is relatively unaffected by changes in haemoglobin concentration45 or carboxyhaemoglobin concentration.74
From the pooled data in this study of non-diseased subjects, 88% of the variance in DLNO is shared by DLCO yet DLNO z-scores share about 39%–47% of the variance in DLCO z-scores (online supplemental table S6). Indeed, it seems logical that measuring DLNO and DLCO together would provide a better assessment of a patient’s pulmonary condition than measuring either one of them on its own since approximately 53%–61% of the total variance between the fitted DLCO z-scores and fitted DLNO z-scores are not shared. Moreover, the fact that there is a low true positive rate and a low positive predictive value between DLNO and DLCO when the prevalence of an abnormal result is 5% further demonstrates that DLNO and DLCO measure different things, even though there is considerable overlap (online supplemental table S8). Regardless of whether segmented linear regression or GAMLSS models are used in predicting DLNO and DLCO, there is only a 38%–42% probability that when DLNO is abnormal (<LLN), DLCO is also abnormal (online supplemental table S8). Thus, it behoves us to measure both DLNO and DLCO together to better understand a patient’s potential lung pathology.
The current GLI DLCO reference equations7 8 and the reference equations updated here for DLNO, DLCO and VA are for white subjects only. As there are slight but essential differences in DLNO,75 76 DLCO77 78 and VA between various ethnic groups,75 76 it is crucial to develop multiethnic reference equations79. For example, lung disease could be overdiagnosed by about 8% in the black population if reference equations for white subjects were used.75 This false-positive misdiagnosis could increase patient stress, and healthcare resources would be extended, resulting in a higher cost for a non-illness.75
In conclusion, when developing pulmonary function reference equations, we propose that segmented (piecewise) linear regression can be used instead of GAMLSS due to its simplicity, especially when overall prediction errors are similar between the two types of models. Still, the Q–Q plots of observed versus expected per cent predicted reveals a better fit to the normal distribution when GAMLSS models are used, but only at the upper end of per cent predicted (ie, ≥140% predicted), and these were rare occurrences. These reference equations for DLNO, DLCO and VA developed here are robust and should be used moving forward for any clinical assessment that uses the NO–CO double diffusion technique and breath-hold time of about 6 seconds. Since the Hyp'Air Compact device measures DLNO and VA that is systematically higher than that of the Jaeger MasterScreen Pro, we urge the two manufacturers to come together to resolve these differences.
Supplemental material
Data availability statement
Data are available upon reasonable request. The pooled data datasets used in this current study are available from the corresponding author [GSZ] on reasonable request. It is required that should the complete dataset be shared, then any abstract, conference proceedings, or article that will be published related to this dataset will have GSZ as one of its co-authors.
Ethics statements
Patient consent for publication
Ethics approval
This study does not involve human participants.
Acknowledgments
GSZ and JC thank the authors that provided the data for the development of these updated reference equations.
References
Supplementary materials
Supplementary Data
This web only file has been produced by the BMJ Publishing Group from an electronic file supplied by the author(s) and has not been edited for content.
Footnotes
Contributors Conception and design (GSZ); statistical analyses (JC primary, GSZ secondary); interpretation (all authors); guarantor (GSZ). All authors edited and approved the final version of the manuscript.
Funding JC received monetary compensation for developing the GAMLSS and segmented regression models.
Competing interests GSZ is a Global Lung Function Initiative Network member, which published reference equations for pulmonary diffusing capacity and static lung volumes using GAMLSS. GSZ is the current co-chair of the European Respiratory Society Task Force on the interpretation of pulmonary diffusing capacity for nitric oxide.
Provenance and peer review Not commissioned; externally peer reviewed.
Supplemental material This content has been supplied by the author(s). It has not been vetted by BMJ Publishing Group Limited (BMJ) and may not have been peer-reviewed. Any opinions or recommendations discussed are solely those of the author(s) and are not endorsed by BMJ. BMJ disclaims all liability and responsibility arising from any reliance placed on the content. Where the content includes any translated material, BMJ does not warrant the accuracy and reliability of the translations (including but not limited to local regulations, clinical guidelines, terminology, drug names and drug dosages), and is not responsible for any error and/or omissions arising from translation and adaptation or otherwise.