Article Text

Abstract
Background An outbreak of novel coronavirus (SARS-CoV-2)-associated respiratory infectious diseases (COVID-19) emerged in 2019 and has spread rapidly in humans around the world. The demonstration of in vitro infectiousness of respiratory specimens is an informative surrogate for SARS-CoV-2 transmission from patients with COVID-19; accordingly, viral isolation assays in cell culture are an important aspect of laboratory diagnostics for COVID-19.
Methods We developed a simple and rapid protocol for isolating SARS-CoV-2 from respiratory specimens using VeroE6/TMPRSS2 cells, a cell line that is highly susceptible to the virus. We also investigated a correlation between isolation of SARS-CoV-2 and viral load detected by real-time RT-PCR (rRT-PCR) using N2 primer/probe set that has been developed for testing of COVID-19 in Japan.
Results The SARS-CoV-2 isolation protocol did not require blind passage of inoculated cells and yielded the results of viral isolation within 7 days after inoculation. Specimens with cycle threshold (Ct) values of <20.2, determined by rRT-PCR, were predicted to be isolation-positive. On the other hand, 6.9% of specimens with Ct values >35 were virus isolation-positive, indicating that low viral loads (high Ct values) in upper respiratory specimens do not always indicate no risk of containing transmissible virus.
Conclusion In combination with rRT-PCR, the SARS-CoV-2 isolation protocol provides a means for assessing the potential risk of transmissible virus in upper respiratory specimens.
- COVID-19
- viral infection
This is an open access article distributed in accordance with the Creative Commons Attribution Non Commercial (CC BY-NC 4.0) license, which permits others to distribute, remix, adapt, build upon this work non-commercially, and license their derivative works on different terms, provided the original work is properly cited, appropriate credit is given, any changes made indicated, and the use is non-commercial. See: http://creativecommons.org/licenses/by-nc/4.0/.
Statistics from Altmetric.com
Key messages
The correlation between the results of N2 set real-time RT-PCR (rRT-PCR) and the presence of transmissible SARS-CoV-2 in respiratory specimens remains unclear.
An establishment of efficient SARS-CoV-2 isolation protocol is essential to investigate the correlation between the results of N2 set rRT-PCR and SARS-CoV-2 isolation.
This study provides helpful information for the assessment of potential risk of transmissible SARS-CoV-2 in respiratory specimens by viral isolation assays in cell culture in combination with the results of N2 set rRT-PCR.
Introduction
The outbreak of novel coronavirus (SARS-CoV-2)-associated respiratory infectious disease (COVID-19) began in Wuhan, China, at the end of 2019.1–3 Subsequently, the number of cases and countries reporting confirmed cases increased rapidly. On 30 January 2020, the WHO declared the outbreak a Public Health Emergency of International Concern. As of the end of October 2020, more than 43 million confirmed cases have been reported worldwide.4
Real-time RT-PCR (rRT-PCR) has been used widely to test specimens from patients suspected of having COVID-19, providing information about clinical management and outbreak control.5–7 Specimens for SARS-CoV-2 rRT-PCR can be taken from the upper (nasopharyngeal/oropharyngeal swabs, nasal aspirate, nasal wash or saliva) or lower respiratory tract (sputum or tracheal aspirate or bronchoalveolar lavage).5 Upper respiratory samples are recommended for initial diagnostic testing for SARS-CoV-2.8
The cycle threshold (Ct) value of rRT-PCR of respiratory sample reflects the amount of viral nucleic acid in the respiratory tract. Specifically, low Ct values indicate abundant viral nucleic acid. Several studies demonstrate that Ct values are inversely correlated with the presence of infectious SARS-CoV-2 virus in specimens.9–11 Because sensitivity varies among rRT-PCR assay systems due to differences in primer/probe sets, reaction conditions and so on,12 it is important to bear in mind that it may not be possible to extrapolate the correlation between Ct value and the presence of infectious virus to other laboratory settings. In Japan, the nationwide rRT-PCR method for SARS-CoV-2 laboratory diagnosis is based on the N and N2 primer/probe sets.13 The N2 set is highly effective for SARS-CoV-2 detection.13 At present, however, the correlation between the results of N2 set rRT-PCR and the presence of infectious virus in specimens remains unclear.
Virus isolation using cell culture is the most reliable laboratory assay for diagnosing viral infection, and this approach also provides surrogate information regarding viral transmission. Recent work showed that transmembrane protease, serine 2 (TMPRSS2)-expressing Vero E6 cells (VeroE6/TMPRSS2) are useful for isolating SARS-CoV-2 from respiratory specimens.14 The appearance of a cytopathic effect (CPE) that includes rounding and detaching in VeroE6/TMPRSS2 cells inoculated with specimens is a reliable indicator of the presence of infectious SARS-CoV-2. In the virus isolation assay, however, it is necessary to perform blind cell passages until viruses grow efficiently. It is not clear whether the appearance of CPE is delayed when SARS-CoV-2 grows poorly or whether blind passage is needed for the SARS-CoV-2 isolation assay. In this study, we established a protocol for SARS-CoV-2 isolation from respiratory specimens using VeroE6/TMPRSS2 cells without the need for blind cell passages. Furthermore, we demonstrated a correlation between isolation of SARS-CoV-2 from specimens and viral load detected by rRT-PCR using the N2 set.
Materials and methods
Cells
VeroE6/TMPRSS2 cells14 were maintained in culture medium Dulbecco's Modified Eagle Medium (DMEM) supplemented with 10% fetal bovine serum (FBS).
Specimens
Upper respiratory samples (nasopharyngeal/nasal swabs or saliva) suspended in phosphate-buffered saline or viral transport medium were collected from patients suspected as having COVID-19 as part of public health diagnostic activities conducted from February to June at the National Institute of Infectious Diseases (NIID), Tokyo, Japan. Specimens were examined for rRT-PCR and virus isolation as anonymous samples.
Patient and public involvement
Patients and the public were not involved in the design, conduct, reporting or dissemination plans for this study.
rRT-PCR
rRT-PCR for SARS-CoV-2 using the N2 set was performed as described previously.13 Briefly, 20 µL of reaction mixture, consisting of 2× Master mix and RT from the QuantiTect probe RT-PCR kit (Qiagen, Hilden, Germany), the N2 primer/probe set (NIID_2019-nCoV_N_F2 primer, NIID_2019-nCoV_N_R2 primer and NIID_2019-nCoV_N_P2 probe), and 5 µL of RNA extracted from upper respiratory specimens, was subjected to rRT-PCR on a LightCycler 480 (Roche, Basel, Switzerland). Reaction conditions were as follows: 50°C for 30 min; 95°C for 15 min; and 45 cycles of 95°C for 15 s and 60°C for 1 min. For all rRT-PCR-positive samples, Ct values were obtained. RNA copy number in each reaction was also determined based on the Ct value of synthetic standard RNA (500 copies per reaction).13
Virus isolation
Upper respiratory samples positive for SARS-CoV-2 rRT-PCR were stored at −80°C before being processed in cell culture. VeroE6/TMPRSS2 cells were inoculated with upper respiratory samples as described in Matsuyama et al.14 Briefly, VeroE6/TMPRSS2 cells seeded on 12-well culture plates or 12.5 cm2 culture flasks were inoculate with 100–200 µL of respiratory samples mixed with DMEM supplemented with 5% FBS. At 1-day post-inoculation (dpi), culture supernatants were replaced with fresh culture medium. Cell morphology was observed daily using a microscope. The virus isolation assay was considered positive when CPE was observed in the inoculated cells. To confirm the presence of SARS-CoV-2, SARS-CoV-2 spike antigen was detected in cells inoculated with supernatants of CPE-positive cells (online supplemental figure S1). Viral isolation was considered negative when the CPE was not observed until 6 dpi or after blind passages. Blind passage was performed as follows: a total of 45 upper respiratory samples (Ct values ranging from 20.2 to 40.0, median 32.4) were inoculated to VeroE6/TMPRSS2 cells as described above. After 5–6 days, in the absence of obvious CPE, the inoculated cells were trypsinised for the cell passage. Then, one-third or one-fifth of the cells were transferred to the fresh culture medium. This procedure was repeated two more times. All virus isolation procedures were performed in a biosafety level 3 laboratory at NIID, Japan.
Supplemental material
Receiver operating characteristic analysis
A receiver operating characteristic (ROC) analysis to determine cut-off Ct value for successful viral isolation was performed using the STAT Flex (V.7.0) software (Artec, Osaka, Japan).
Results
Establishing a procedure for SARS-CoV-2 isolation
A total of 203 upper respiratory specimens (nasal/nasopharyngeal swab or saliva) positive for SARS-CoV-2 rRT-PCR were inoculated to VeroE6/TMPRSS2 cells for isolation of virus. In cells inoculated with 72 of these specimens, obvious CPE was observed within 4 dpi. To determine whether blind cell passages were necessary for SARS-CoV-2 isolation, cells inoculated with 45 specimens that did not exhibit CPE at 5 dpi were subjected to cell passaging. After the third cell passage, no CPE was observed in these cells. The cells inoculated with these 45 specimens were considered to be virus isolation-negative. This result indicated that the cell passage after inoculation with respiratory specimens was not needed for isolation of SARS-CoV-2 when using VeroE6/TMPRSS2 cells. Also, because CPE was obvious within 4 dpi in all cases that were virus isolation-positive, we decided to make the observation at 6 dpi, which allows an additional margin for detecting CPE in cultured cells (figure 1). According to this protocol, the remaining 86 specimens were virus isolation-negative, as CPE was not observed at 6 dpi or after longer incubation.

Flowchart for the SARS-CoV-2 isolation assay established in this study. CPE, cytopathic effect; dpi, day post-inoculation.
Correlation of virus isolation and rRT-PCR
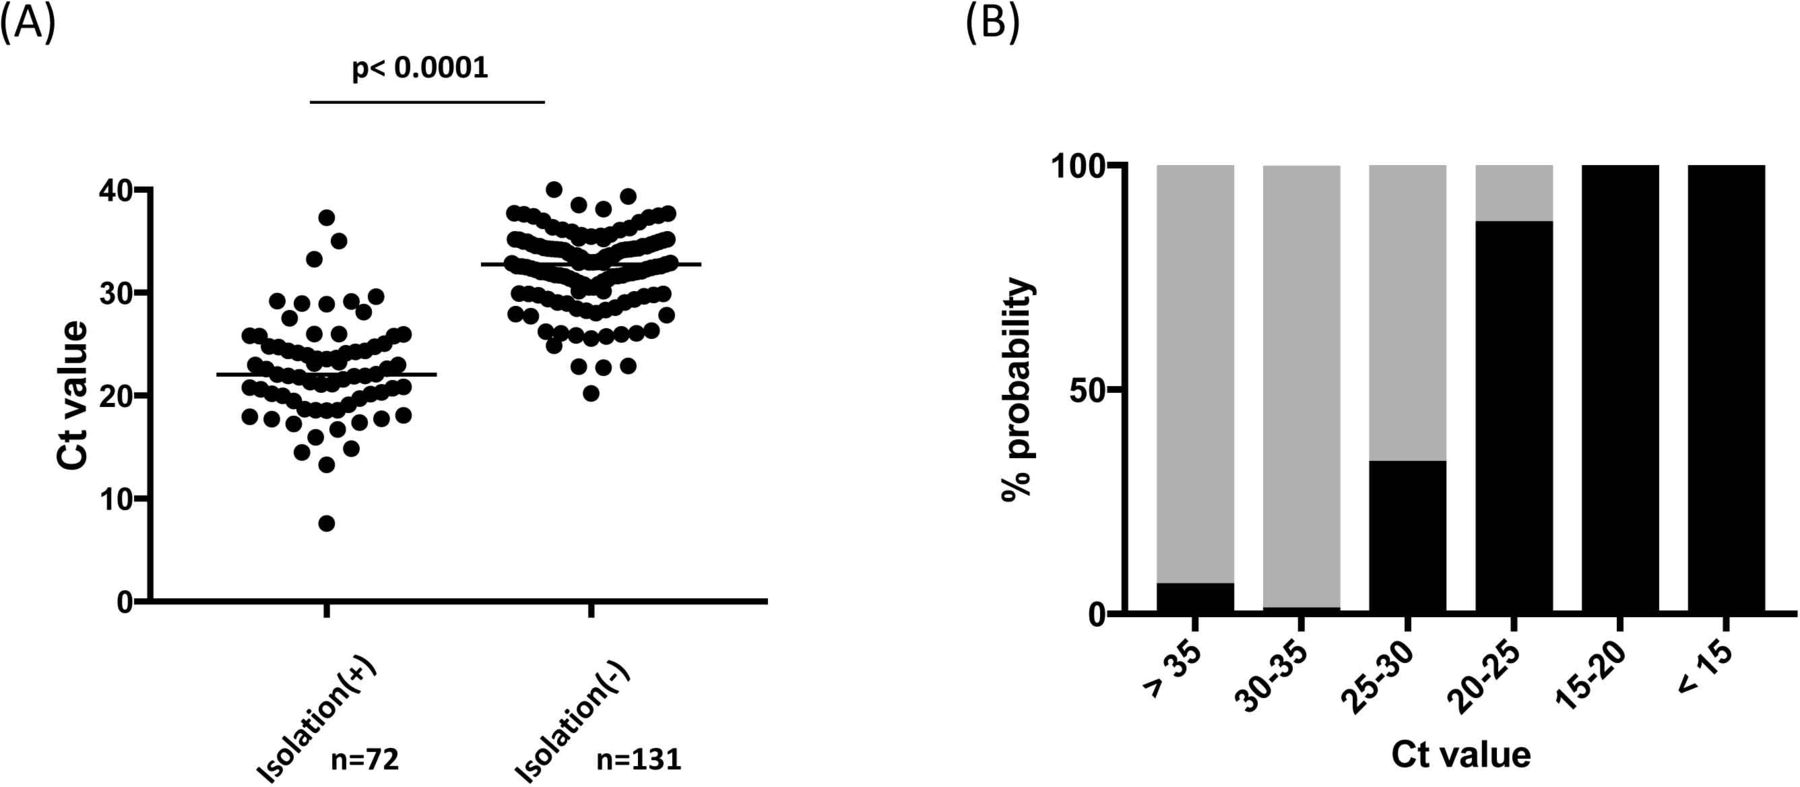
The Ct values were obtained from 203 specimens that were positive according to real-time PCR conducted by the Virus Diagnosis Group (NIID Toyama) using a previously reported method.13 The Ct values among isolation positives (n=72) ranged between 7.6 and 37.3 (median 22.1), whereas those among isolation negatives (n=131) ranged between 20.2 and 40.0 (median 32.7). There was a significant difference (p<0.0001) in the Ct values between isolation positives and negatives (figure 2A). Isolation probability decreased progressively as Ct values increased. Among 73 specimens with Ct values ranging from 30 to 35, and 29 specimens with Ct value >35, one (1/73, 1.4%) and two (2/29, 6.9%) were isolation-positive, respectively (figure 2B). ROC analysis indicated that positive virus isolation had an area of 0.94 (95% CI 0.90 to 0.98, p<0.0001) with 100% specificity at Ct values <20.2; the cut-off Ct value for 87.5% specificity (=sensitivity) was 28.1.

Correlation of successful virus isolation with cycle threshold (Ct) value from SARS-CoV-2 real-time RT-PCR (rRT-PCR) in 203 positive upper respiratory specimens. (A) Ct values obtained from rRT-PCR of upper respiratory specimens were compared between virus isolation positives and negatives. (B) Percentage of positive (black bar) and negative (grey bar) viral isolation of upper respiratory specimens according to the range of Ct values, expressed as probabilities.
Our rRT-PCR results were based on the N2 primer/probe set, and the Ct values might not be applicable to rRT-PCR with other primer/probe sets. Because the viral loads could be calculated using synthetic standard RNA used in the rRT-PCR assay, RNA copy numbers in the specimens were calculated based on the Ct value of a standard synthetic RNA sample included in each rRT-PCR assay. The lowest RNA copy number among isolation-positive samples was 2.4×10³ copies/mL (Ct value=37.3), whereas the highest RNA copy number among isolation-negative samples was 3.2×10⁶ copies/mL (Ct value=20.2).
Discussion
Because the demonstration of in vitro infectiousness of respiratory specimens is an informative surrogate for SARS-CoV-2 transmission from patients with COVID-19, the cell culture-based viral isolation assay is an important aspect of laboratory diagnostics for COVID-19. In this study, we demonstrated that when using VeroE6/TMPRSS2 cells for virus isolation, the cell culture passage after inoculation was not necessary for investigation of viral infectivity of respiratory specimens. A total of 45 upper respiratory specimens did not exhibit CPE after the third passage of inoculated cells. These results enabled us to establish a simple and rapid protocol for SARS-CoV-2 isolation that did not require blind passage (figure 1), and that yielded the results of viral isolation within 7 days after inoculation.
The Ct value of rRT-PCR reflects the quantity of viral RNA in the clinical specimens. Several studies have demonstrated that successful isolation of SARS-CoV-2 in cell culture is correlated with Ct value, suggesting that patients with COVID-19 with relatively high Ct values may not be contagious. The efficiency of SARS-CoV-2 isolation differs among cell lines,14 and the Ct value varies among rRT-PCR systems with different primer/probe sets targeting different viral genes (eg, E, RdRp, N and so on). Using VeroE6/TMPRSS2 cells, we investigated the correlation between virus infectivity and Ct values determined by rRT-PCR using the N2 set13 in a total of 203 upper respiratory specimens. Specimens with Ct values <20.2 were predicted to be isolation-positive; infectivity decreased significantly as Ct value progressively increased. The results were consistent with previous studies reporting that SARS-CoV-2–positive isolation samples had significantly lower Ct values than negative samples.9–11 Interestingly, we showed that 6.9% of specimens with Ct values >35 were virus isolation-positive, indicating that low viral loads (high Ct values) do not always indicate no risk of containing transmissible virus in upper respiratory specimens. Similar results were obtained from a UK study in which virus was recovered from 8% of samples with Ct values >35.11
In other studies, specimens with Ct values >34 are found not to be contagious,9 11 and in 50% tissue culture infectious dose (TCID50) assays, infectivity is significantly reduced when RT-PCR Ct values are >24.10 Furthermore, Wölfel et al showed that infectious virus is not recovered from specimens with RNA copies <1.0×10⁶/mL.15 In this study, we detected infectious virus from specimens with <1.0×10⁶ copies/mL. This discrepancy might be due to differences among rRT-PCR systems and virus culture procedures, including the cells used for isolation.
Based on the N2 set primer/probe for rRT-PCR, specimens with Ct value lower than 20.2 were all infectious, and although the probability of the presence of infectious virus decreased significantly as Ct values increased, it was still possible for specimens with Ct values >35 to include infectious virus, although the positivity rate was low. One limitation of this study was that we could not access the clinical information of the subjects (date of onset, date of specimen collection and presenting symptoms). Information on clinical course (acute/recovery phase) could have been useful for estimating better the probability of virus isolation from specimens with various Ct values.
In summary, we established a SARS-CoV-2 isolation protocol that can assess existence of infectious virus in a specimen within a week. Using the protocol in combination with the rRT-PCR system that has been used in Japan, we clarified that specimens with Ct values <20.2 were all contagious, and also that specimens with Ct values >35 were not always free of infectious virus, in contrast to earlier studies. Results suggested that Ct values of specimen may provide useful information for decision-making of countermeasure against COVID-19 from the standpoint of assessing whether patients with COVID-19 can spread infectious virus.
Acknowledgments
The VeroE6/TMPRSS2 cell line was kindly provided by Dr Shutoku Matsuyama of the National Institute of Infectious Diseases (NIID).
Supplementary materials
Supplementary Data
This web only file has been produced by the BMJ Publishing Group from an electronic file supplied by the author(s) and has not been edited for content.
Footnotes
Collaborators Virus Diagnosis Group (NIID Toyama): Nozomu Hanaoka, Naomi Nojiri (Center for Infectious Disease Risk Management); Ai Kawana-Tachikawa, Shigeru Kusagawa, Koichi Ishikawa, Shigeyoshi Harada, Saori Matsuoka, Tadashi Kikuchi, Hiroshi Ishii, Sayuri Seki, Midori Nakamura-Hoshi, Shoji Miki, Lucky Ronald Runtuwene (AIDS Research Center); Nobuo Koizumi, Sunao Iyoda, Hideyuki Takahashi, Hidemasa Izumiya, Jiro Mitobe, Shouji Yamamoto, Masatomo Morita, Ken-ichi Lee, Ken Shimuta (Department of Bacteriology I); Kyoko Saito, Masayoshi Fukasawa (Department of Biochemistry and Cell Biology); Yasutaka Hoshino, Ken Miyazawa (Department of Chemotherapy and Mycoses); Minoru Nagi (Antimicrobial Resistance Research Center); Chikako Shimokawa, Yasuyuki Morishima (Department of Parasitology); Takashi Sakudoh (Department of Quality Assurance and Radiological Protection); Yoshihiro Kaku (Department of Veterinary Science); Chang Kweng Lim, Shigeru Tajima, Takahiro Maeki, Eri Nakayama, Satoshi Taniguchi, Motohiko Ogawa (Department of Virology I); Takanobu Kato, Hussein Hassan Aly, Kousho Wakae, Kento Fukano (Department of Virology II).
Contributors Virus Diagnosis Group (NIID Toyama) contributed to the collection and analysis of data. SY, SF, HK, TF and KM had full access to all of the data in the study and take responsibility for the integrity of the data. SF, MO, TS, MS and KM substantially contributed to the study design, data interpretation and the writing of the manuscript.
Funding This work was supported by a grant-in-aid from the Japan Agency for Medical Research and Development (AMED) (grant no. JP20fk0108058 and JP20fk0108070) and by a grant for Research on Emerging and Re-emerging Infectious Diseases and Immunization from the Japanese Ministry of Health, Labour and Welfare (grant no. 10153302).
Competing interests None declared.
Patient consent for publication Not required.
Ethics approval All protocols and procedures were approved by the research ethics committee of the NIID for the use of human subjects (No. 1178).
Provenance and peer review Not commissioned; externally peer reviewed.
Data availability statement All data relevant to the study are included in the article or uploaded as supplementary information.
Supplemental material This content has been supplied by the author(s). It has not been vetted by BMJ Publishing Group Limited (BMJ) and may not have been peer-reviewed. Any opinions or recommendations discussed are solely those of the author(s) and are not endorsed by BMJ. BMJ disclaims all liability and responsibility arising from any reliance placed on the content. Where the content includes any translated material, BMJ does not warrant the accuracy and reliability of the translations (including but not limited to local regulations, clinical guidelines, terminology, drug names and drug dosages), and is not responsible for any error and/or omissions arising from translation and adaptation or otherwise.