Article Text

Abstract
Introduction The eucapnic voluntary hyperpnoea (EVH) challenge is used to screen for exercise-induced bronchoconstriction. Several criteria have been proposed to determine the decrease in lung function (fall index, FI) following EVH. We compared three published FI calculation methods to determine if they affect the diagnostic classification.
Methods The three FIs were calculated for 126 EVH tests. Spirometry was performed in duplicate at baseline and repeated 3, 5, 10, 15 and 20 min following 6 min of EVH. The higher of the two forced expiratory volume in 1 s (FEV1) measures at all time-points post-hyperpnoea was selected for the calculation of the FIs. The FIA was determined as the single lowest of the five postchallenge values, and a test was considered positive if FEV1 decreased ≥10 %. In FIB, a test was considered positive if FEV1 decreased ≥10% at two consecutive post-challenge time-points. The FIC was calculated identically to FIA, but was normalised to the achieved minute ventilation during the EVH challenge.
Results Calculation method affected the raw FIs with FIB generating the smallest and FIC generating the highest values (p<0.001) and a within-subject range of 7%±10%. The number of positive tests differed between the calculation criteria: FIA: 62, FIB: 48 and FIC: 70, p<0.001. Nineteen participants (15%) tested positive in one or two FI methods only, indicating that the FI method used determined whether the test was positive or negative.
Discussion Inconsistency in methodology of calculating the FI leads to differences in the diagnostic rate of the EVH test, with potential implications in both treatment and research outcomes.
- asthma
- asthma guidelines
- exercise
- lung physiology
- asthma in primary care
- respiratory measurement
This is an open access article distributed in accordance with the Creative Commons Attribution Non Commercial (CC BY-NC 4.0) license, which permits others to distribute, remix, adapt, build upon this work non-commercially, and license their derivative works on different terms, provided the original work is properly cited, appropriate credit is given, any changes made indicated, and the use is non-commercial. See: http://creativecommons.org/licenses/by-nc/4.0
Statistics from Altmetric.com
Key messages
This analysis answers the question of whether varying criteria within previously published calculation methods of the respiratory response to eucapnic voluntary hyperpnoea (EVH) affect the diagnosis of exercise-induced bronchoconstriction (EIB).
The criteria used to calculate the respiratory response to EVH affect the test interpretation and subsequently the diagnosis of EIB.
Read on to learn about the differences between the three analysed calculation methods of the respiratory response to EVH, which will permit an informed decision on which method may suit the reader’s purpose most adequately when screening for EIB.
Introduction
Exercise-induced bronchoconstriction (EIB) is defined as the transient narrowing of the airways resulting from exercise.1 Mucosal dehydration caused by evaporation and mucosal cooling with subsequent hyperaemia are the stimuli thought to cause EIB,2 affecting 5%–20% of individuals in the general population and 4%–55% of athletes, depending on the athletes’ type of sport and the diagnostic test used.1 The high prevalence of EIB in athletes, particularly in endurance trained athletes such as cross-country skiers, runners and cyclists is thought to be a result of the repeatedly sustained high minute ventilations over prolonged periods of time.1 2 High minute ventilations can cause the above-described mucosal dehydration and mucosal cooling, ultimately resulting in EIB. The International Olympic Committee (IOC) considers the eucapnic voluntary hyperpnoea (EVH) test the best available laboratory-based challenge to screen for EIB.3 In one of the first descriptions of the EVH challenge in 1985, Phillips et al. 4 asked individuals to hyperventilate dry air with 4.7% added CO2 for 8 min at the minute ventilation they had generated during an exercise challenge on a previous test day. Spirometry was performed at baseline, 5, 10 and 20 min after the hyperpnoea period. The authors concluded that the EVH challenge was suitable to identify individuals with exercise-induced asthma due to the comparable decreases in forced expiratory volume in 1 s (FEV1) between the exercise and the EVH challenges. One advantage of the EVH challenge compared with an exercise test is the high degree of standardisation that can be achieved for athletes, independent of their sport. Standardised, sport-specific test protocols to screen for EIB that are recognised by major sporting agencies or by the IOC do not exist. Particularly in outdoor sports where athletes train and compete in varying terrain and meteorological conditions, such as cross-country skiing, standardisation for an exercise test is nearly impossible.
Since its introduction, the EVH test protocol has been continuously adjusted to minimise potential misdiagnoses. The determination of the fall index (FI) is one parameter that has evolved over time; however, some of the presented changes to the calculation of the FI have not yet been evaluated, and it is unclear if the FI criteria in previously published studies affect the diagnostic classification of the EVH challenge. The FI is defined as the difference in FEV1 pre-EVH and post-EVH, expressed as a per cent of baseline.5 An EVH challenge is considered positive (EVH+) and subsequently indicative of EIB, if the FI exceeds a predetermined cut-off.6 In a landmark paper by Andersen et al 7 spirometry was performed in duplicate at baseline and repeated at 5, 10, 15 and 20 min post-EVH. The higher of the two values was recorded for every time point. Of the postchallenge values, the one showing the greatest decline from baseline was reported (in this manuscript referred to as FIA). To minimise the risk of low readings due to technique error or poor effort, the current American Thoracic Society (ATS) Clinical Practice Guideline recommends the calculation of the FI based on two consecutive values with a decrease in FEV1 ≥10% rather than one single value (in this manuscript referred to as FIB).8 9 Argyros et al. 10 and Hurwitz et al. 11 recommended using the criteria of FIA but normalising the calculated FI by the achieved minute ventilation during the EVH challenge (in this manuscript referred to as FIC). Normalisation of FI is suggested because a dose-response relationship between the achieved minute ventilation during the EVH challenge and the experienced degree of bronchoconstriction has been previously shown;10 12 therefore, a greater release of inflammatory mediators following higher relative minute ventilations during the EVH challenge are thought to increase the stimulus for bronchoconstriction. Recently, Price et al. 13 suggested a shift in the diagnostic cut-off from 10% to 15%. In their experience, the majority of competitive athletes with normal baseline lung function and no respiratory symptoms present with an FI after EVH close to or beyond 10%.
The aim of this retrospective analysis was to compare three previously published calculation methods of the FI (FIA, FIB and FIC) in the EVH challenge. We calculated the FIs using the three methods and evaluated the resulting clinical classification (EVH+ vs EVH-). We hypothesised that the calculation method of the FI would significantly affect the diagnostic classification of the EVH challenges. To assess ecological validity of the FI calculation methods, we compared them to the change in FEV1 induced by a short-duration, high-intensity exercise bout. Furthermore, we assessed if the change in the proportion of positive and negative tests following a shift in the cut-off from 10% to 15% varied between FI calculation methods.
Methods
Overview of included EVH tests
The EVH tests from five different projects were pooled, adding up to 165 data sets that were checked for eligibility.14–18 A total of 39 data sets were removed from the analysis due to participants’ repeated study participation within our laboratory (n=13) or due to spirometry measures that did not meet the repeatability criteria for duplicate measures as per the ATS guidelines (n=26).19 For individuals who participated in several studies pooled for this analysis, only the data set from participants’ first EVH test were included. Participants, whose EVH tests were included were non-smokers, not pregnant and free from cardiovascular and metabolic disease (except for EIB). Ethics approval for this study was granted by the University of British Columbia Clinical Research Ethics Board in accordance with the Helsinki Declaration. All study participants provided written, informed consent.
Experimental protocol
All participants completed an EVH challenge to screen for EIB. Since participants only mimic the breathing of a high-intensity exercise bout without actually conducting any form of exercise, some researchers refer to the EVH challenge as a tool to screen for bronchial hyper-responsiveness instead of EIB. Due to the ATS and the IOC describing the EVH challenge as a validated test to screen for EIB, we will use this term for the purpose of this manuscript. A subset of 41 well-trained cyclists completed a 10 km cycle time trial (TT) on a separate test day with pre-TT and post-TT spirometry. The EVH challenge and the TT were completed in the same laboratory with a washout period of a minimum of 3 days, and a maximum of 2 weeks. Predicted spirometric values were obtained following Crapo et al.20 For the EVH challenge and the TT, all participants were asked to withhold from short-acting and long-acting bronchodilators for 12 hours prior to testing, but were permitted to continue corticosteroid treatment. Participants did not exercise on either of the study days to avoid exercise-induced bronchodilation and abstained from caffeine.
EVH challenge and calculation of fall indices
Baseline lung function was determined as the highest FEV1 from three manoeuvres using spirometry (TrueOne 2400; ParvoMedics, Sandy, Utah, USA).19 The target minute ventilation for the EVH period was calculated as 30× baseline FEV1. Individuals breathed dry gas (5% CO2, 21% O2, balanced N2) for 6 min wearing a nose clip, and repeated spirometry in duplicate 3, 5, 10, 15 and 20 min after completion of the hyperventilation. Real-time feedback of their minute ventilation was provided as 10 sec averages to ensure that the target was maintained. If the target ventilation was not met, participants were verbally encouraged to increase respiratory rate or tidal volume based on the test administrator’s observations.
The FI was calculated as:21

To investigate how different calculation methods of the FI affect the diagnostic classification of the EVH challenge, we used FIA, FIB and FIC as summarised in table 1.
FI calculation criteria
The severity of EIB was graded as mild (FI≥10%, but <25%), moderate (FI≥25%, but <50%) and severe (FI≥50%) for all FI calculation methods following the ATS guidelines.9
Spirometry precycling and postcycling time trials
A subset of 41 trained cyclists performed a short-duration, high-intensity cycle bout in the form of a simulated 10 km TT on a cycle ergometer. Spirometry was performed in duplicate before and immediately after the completion of the TT, as soon as it was safe for the participant to get off the cycle ergometer. During the TT, a virtual course was displayed on a screen with distance, cadence and gearing information shown. Participants wore a facemask attached to a two-way-non-rebreathing valve (7450V2Mask, Hans Rudolph, Shawnee, Kansas, USA) during the TT. Of the 41 individuals who completed post-TT spirometry measures, seven (17%) had to be removed from the analysis because they did not meet ATS guidelines, most commonly because duplicate measures were not within 150 mL.19 The change in FEV1 between pre-TT and post-TT (FITT) was analysed for a total of 39 well-trained cyclists (18 men and 21 women). The highest of the two measures taken at baseline and on completion of the TT, respectively, were chosen, and FITT was expressed as a per cent of baseline.
Statistical analyses
All data are presented as mean values (M) with standard deviations (SD). First, raw values of FIA-C and FITT were compared with each other using repeated measures analyses of variance, with sex serving as the between-subject variable. If a main effect was found, a Sidak test was performed to test for significance.
In a second analysis, the number of EVH+ and EVH- tests resulting from the three FI calculation methods were compared with each other using a 10% and a 15% cut-off, respectively, with the Friedman test. If a significant main effect was found, posthoc analysis was performed using the Wilcoxon signed-rank test.
The changes in FEV1 pre-TT and post-TT in the subset of 39 athletes were calculated using a repeated-measures T-test.
For all tests, the significance level was set at 0.05. Statistical procedures were completed using SPSS (V.24, IBM, Armonk, New York, USA).
Results
Study participant characteristics
Of the 126 included individuals, 34 reported a previous asthma diagnosis. These 34 previously received asthma diagnoses could not be further classified by their mode of diagnosis, as the majority of participants could not recall how the diagnosis was made. Of the 34 individuals with a previous asthma diagnosis, 20 treated their symptoms with daily inhalations of corticosteroids and inhaled ß2-agonists on an as-needed basis. Two individuals relied on inhaled ß2-agonists on an as-needed basis only, and 12 did not take any medications to treat respiratory symptoms. All collected anthropometric, baseline lung function and fitness parameters are summarised in table 2.
Anthropometric, pulmonary and physical fitness characteristics of 86 male and 40 female participants
Comparisons of raw fall indices across three EVH fall-index calculation methods
Comparing the raw values of FIA (M (SD)=−12.7 (±11.4)%), FIB (−9.7 (±10.3)%) and FIC (−16.1 (±15.9)%) led to a significant main effect for calculation method (p<0.001). Posthoc testing revealed significant differences in the raw FI values between all possible combinations (p<0.001). The mean raw FIs for those testing EIB+ were FIA: −20.1 (±10.8)%, FIB: −19.0 (±59.2)% and FIC: −25.1 (±16.2)%. The mean raw FIs for those testing EIB- were FIA: −4.9 (±3.6)% , FIB: −3.8 (±5.6)% and FIC: −4.9 (±3.5)%. The FIB led to the smallest falls in FEV1, making it the most conservative of the three calculation methods, whereas FIC resulted in the greatest decreases in FEV1 post-EVH. On average, the difference between the highest and lowest FI calculated for every participant with FIA-C was 7%±11%. Of the 34 individuals with a previous asthma diagnosis, 30 tested positive using FIA, 29 tested positive using FIB and 33 tested positive using FIC.
Comparisons of diagnostic classification across three EVH fall index calculation methods
The number of EVH+ and EVH- tests differed significantly between all three FI calculation methods, (χ2 (2, n=126)=33.812, p≤0.001). Analysing the EVH challenge with FIA, FIB and FIC led to EVH+ tests suggestive of EIB+ in 62, 48 and 70 athletes when using a cut-off of 10%, respectively (table 3). The Wilcoxon signed-rank test demonstrated significant differences between all FI methods (FIA vs FIB: p≤0.001; FIA vs FIC: p=0.005; FIB vs FIC: p<0.001). Increasing the EVH+ cut-off from 10% to 15% for FIA, FIB and FIC reduced the number of positives to 37, 28 and 46, respectively (p≤0.001). As with the 10% cut-off, the number of EVH+ and EVH- tests from the three FI calculation methods differed significantly from each other with 15% cut-off (χ2 (2, n=126)=27.00, p≤0.001). The Wilcoxon signed-rank test demonstrated significant differences between all FI methods (FIA vs FIB: p=0.003; FIA vs FIC: p=0.003; FIB vs FIC: p≤0.001). When using FIA, FIB and FIC, 19.8%, 15.9% and 19.0%, respectively, of the included participants experienced a decrease in FEV1 following EVH ranging between the two discussed FI cutoffs of 10% and 15%.
Number of EVH+ and EVH- tests based on a cut-off of 10% and 15% using the FIA, FIB and FIC calculation method, respectively
Fifty-two (41%) individuals tested EVH+ and 55 (44%) individuals tested EVH- in all three FI calculation methods. Five tested EVH+ in only one FI calculation method, which was FIC for all 5. Fourteen tested EVH+ in two FI calculation methods, but negative in the third analysed method. This indicates that for 19 (15%) participants, the diagnostic classification of the EVH challenge depended on the choice of FI method.
Evaluation of post-EVH time-points when individuals tested EVH+
The majority of those individuals with a positive challenge tested EVH+ within the first 5 min (FIA: 47/62 (76%); FIB: 32/48 (67%); FIC: 53/70 (76%)). The identical two individuals tested EVH+ at the 20 min time point for FIA and FIC, while two other individuals tested positive at the 20 min time point using FIB. A breakdown of the number and percentage of individuals testing EVH+ at the five post-hyperpnoea time-points is provided in table 4.
Effect of FIA, FIB and FIC on time-point at which test determined EVH+
Comparison of EVH fall indices to the change in FEV1 pre-time and post-time trial
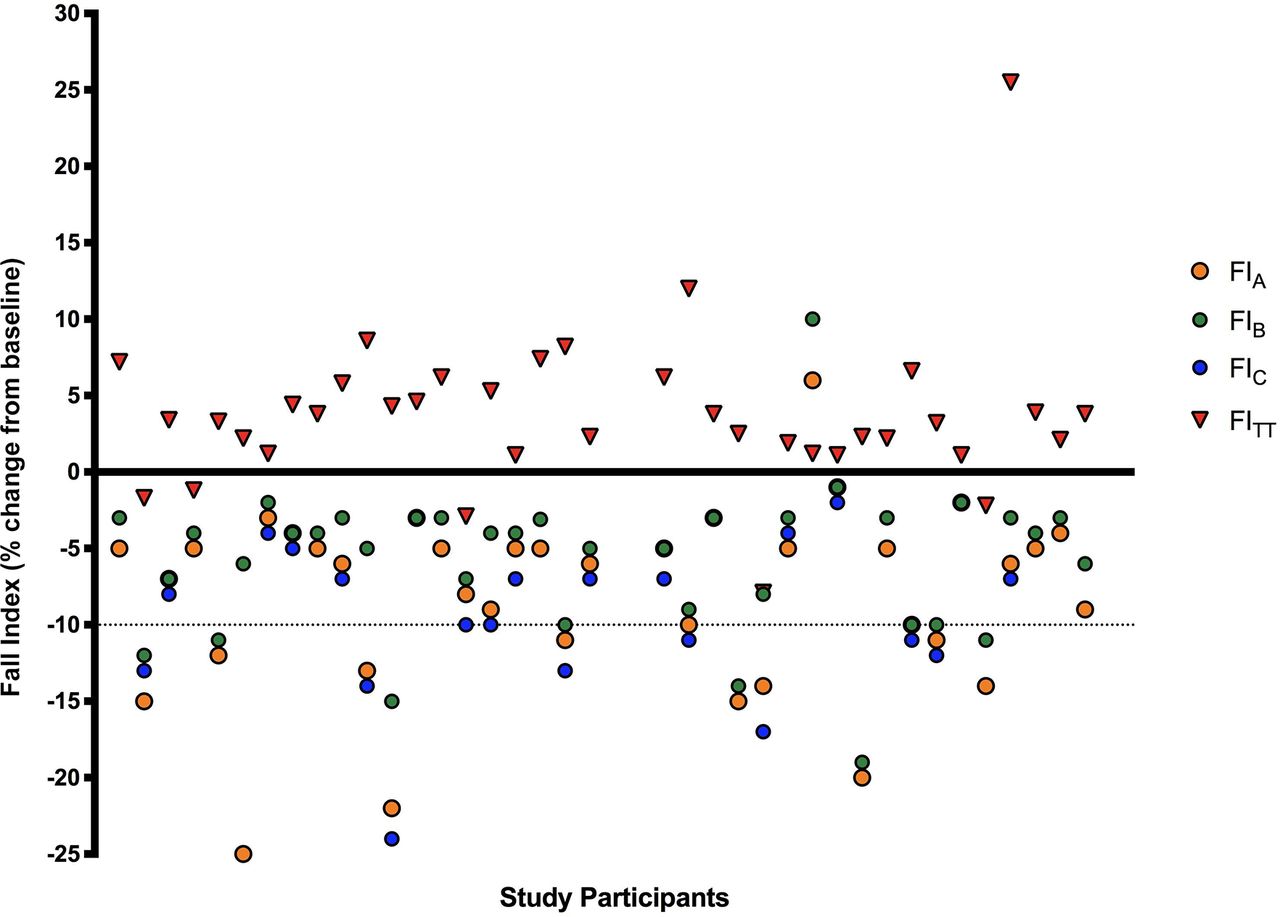
When using FIB following the current ATS guidelines to calculate the FI, 5 (13%) of the 39 athletes who completed spirometry pre-TT and post-TT, presented with a mild decrease in FEV1 following the TT of on average 0.11L±0.09L (p=0.054) with the FITT decreases ranging between −1.2% and −7.9%. Four athletes tested EVH+ when using all three FI calculation methods, but no one presented with a FITT≥10%. The remaining 33 (87%) athletes bronchodilated significantly with an average increase in FEV1 of 0.2L±0.2L (p≤0.001) equalling an increase ranging from 1%-26% (see figure 1).

Comparison of FIA, FIB, FIC and FITT for 39 (21 female and 18 male) cyclists. FI, fall index.
Discussion
In the past, studies have focused on optimising and standardising several components of the EVH challenge protocol such as the duration10 22 and target minute ventilation10 23 of the EVH period. This retrospective analysis is the first to show that the clinical classification of the EVH challenge depends on the FI calculation method used. We compared three previously published FI methods and found a mean intra-individual range of 7%±11% between the lowest and highest FI when using FIA, FIB and FIC. The raw FI values and the number of EVH+ and EVH- tests differed significantly between all three FI criteria. Basing a positive test on a decrease in FEV1 ≥10% in two consecutive post-hyperpnoea values, as suggested in FIB, was the most cautious approach, led to the lowest raw FIs values and subsequently to the smallest number of positives. Adjusting the FI to the achieved minute ventilation in the EVH period led to the highest FI values and the greatest number of positives. When comparing the FIs of a subset of 39 cyclists to their respiratory response following a 10 km cycling TT, 33 athletes presented with significant bronchodilation, including 8/10 athletes who tested EVH+ by the current guidelines (FIB). Though we recognise that a 10 km TT does not replace an exercise challenge, it represents a short-duration, high-intensity exercise bout that cyclists perform repeatedly. The comparison of the FI following a 10 km TT to the FIs following the EVH challenge underlines the high sensitivity of the EVH test in the diagnosis of EIB compared with the exercise bout. The bronchoconstricting stimulus induced by the EVH challenge is higher than that of the high-intensity cycle bout in the present study. Thus, individuals who test negative in the EVH test are unlikely to develop EIB following a high-intensity exercise test. Additionally, the findings of this study highlight the powerful bronchodilatory stimulus that a high-intensity exercise bout places on athletes. Based on this comparison between FIA, FIB and FIC to FITT, there appears to be no rationale to deviate from the current guidelines (FIB).
In this study, the FI calculation methods applied to determine the change in lung function following an individual’s EVH challenge varied on average by 7%±11%, which affected the EVH interpretation in 15% of participants. Thus, the course of treatment and training advice given to those 15% could depend on the chosen calculation method. As a result, the calculation method of the FI needs careful consideration in clinical and research settings, and the chosen methodology should be clearly described. When the EVH+ tests were classified into categories, the number of moderate and severe diagnoses varied almost threefold between the FI calculation methods, with FIC leading to the highest number of moderate and severe EIB cases. Given the severity of their EIB, these are individuals who would need the most medical support in managing their respiratory symptoms to pursue sport or physical activity. Therefore, the calculation method of the FI appears to be more important for individuals with more severe EIB compared with individuals with an FI just above or below the 10% cut-off.
The FIC led to significantly higher FIs and a significantly greater number of EVH+ tests compared with FIA and FIB. These findings are in contrast to Hurwitz et al. 11 who investigated older participants and individuals with a history of smoking. They found only a 1% difference between raw and VEEVH-achieved-adjusted FIs.11 The reasons for this disparity are unclear, however, the current study examined young, physically active non-smokers. As such, the average per cent predicted FEV1 of participants in this study was greater compared with that of Hurwitz’ study population (FEV1 per cent predicted in healthy individuals and asthmatics=98.3 (1.9)% and 90.9 (1.6)%, respectively).11 It appears that adjusting FI for VEEVH-achieved in healthy individuals with high static lung volumes might give starkly different results compared with the raw FI values, and thus such a method should be used with caution.
The shift of the cut-off from 10% to 15% approximately halved the number of mild EVH+ tests. In our study, the FEV1 of 16%–20% of the included participants fell between 10% and 15% when using FIA, FIB and FIC. This rate is comparable to that of Price et al. 13 with 20% of their asymptomatic individuals falling into this range. The high number of athletes presenting with bronchodilation following the TT, regardless of their FI, did not confirm our EVH test findings, making conclusions on the optimal cut-off for the EVH difficult. With 87% of the athletes showing bronchodilation regardless of the FI calculation method, the FIB following the current guidelines8 9 appears to be the most cautious approach in the determination of the FI when compared with FIA and FIC. One potential concern when using FIB might be to falsely identify individuals with a late onset of bronchoconstriction as EVH-, as a decrease in FEV1 in two consecutive measurements is needed. This analysis shows that the majority of individuals test EVH+ within the first 5 min. To avoid a potential misdiagnosis if an individual only starts to present with bronchoconstriction at the 20 min post-hyperpnoea time point, it might be advisable to add an extra spirometric assessment 25 min post-hyperpnoea to confirm a sustained bronchoconstriction induced by EVH.
Limitations
We collected spirometric data up to 20 min following the EVH challenge, but performed just a single (duplicate) spirometry assessment immediately following the TT. Blackie et al. 22 concluded that the onset of bronchoconstriction was delayed with increasing duration of isocapnic hyperventilation in asthmatics. Hyperventilation itself may inhibit bronchoconstriction or the mechanisms inducing bronchoconstriction may be delayed in response to hyperventilation.22 It would have been preferable to have spirometric data following the TT over a comparable 20 min time-period as for the EVH test. Furthermore, an analysis of the FI methods against experienced asthma symptoms during and following exercise might have helped to further characterise the FI calculation methods.
Conclusion
The FI calculation method significantly affects the number of EVH+ and EVH- tests and the magnitude of the raw FI value used to classify the severity of EIB. Individuals with moderate and severe EIB are affected most by the FI calculation method. Careful consideration should be paid to the choice of calculation method since it affects the course of treatment and symptom management provided to physically active individuals. A 10 km cycling TT in this study acted as a powerful bronchodilator and did not accurately confirm the individuals’ response to the EVH challenge. With FIB leading to the smallest decreases in FEV1 following EVH and the lowest number of EVH+ tests, it appears to be the most conservative of the three calculation methods. The use of FIC may not be advisable in individuals with high per cent predicted FEV1 at baseline as it may lead to unachievable target VEs in the EVH challenge. Further research is needed to better address the question of whether a shift from 10% to 15% for the FI-cutoff in the EVH challenge should be recommended. The symptoms and the degree of EIB experienced in individuals with mild EIB, commonly observed in well-trained athletes, are variable.24 Having individuals with mild EIB complete multiple exercise tests and multiple EVH challenges to compare the results between the exercise and EVH challenges would provide a better assessment. As previously recommended by Mastronarde25 and Price et al.,13 minute ventilations for the exercise and the EVH challenges should be matched to further investigate the role of minute ventilation, and a comprehensive airway inflammatory profile should be included to provide a more detailed basis for a decision on the shift from 10% to 15%.
Acknowledgments
We would like to thank Dr M.E. Karim for his assistance with the statistical analysis of the FI criteria.
References
Footnotes
Contributors SMS and SK collected and analysed the data. MSK secured funding and provided guidance throughout the analyses. All three coauthors (SMS, MSK and SK) wrote and reviewed the manuscript together.
Funding Funding for this project was kindly provided by the World Anti-Doping Agency (WADA) and the Natural Sciences and Engineering Research Council of Canada (NSERC).
Competing interests None declared.
Patient consent Not required.
Ethics approval University of British Columbia, Vancouver, Canada. Clinical Research Ethics Board.
Provenance and peer review Not commissioned; externally peer reviewed.
Data sharing statement No additional data are available.